Q2 2021 Austin Industrial Report
•
0 likes•78 views

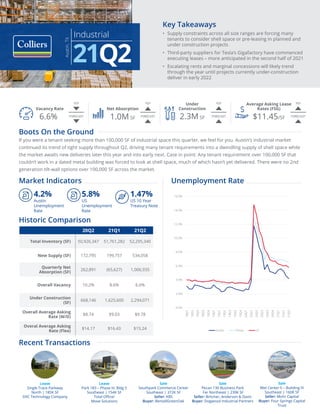
The industrial market in Austin, TX continued to experience tight supply and strong demand in the second quarter of 2021. Net absorption was 1,006,935 SF while vacancy dropped to 6.6%. However, the large development pipeline will not provide meaningful relief on vacancy until late 2021 and early 2022 as 2.3 million SF is currently under construction. With constrained supply across all size ranges, escalating rents and limited concessions are expected to continue through the rest of the year.

Recommended
Recommended
More Related Content
What's hot
What's hot (20)
Similar to Q2 2021 Austin Industrial Report
Similar to Q2 2021 Austin Industrial Report (20)
More from Colliers International | Houston
More from Colliers International | Houston (20)
Recently uploaded
Recently uploaded (20)
Q2 2021 Austin Industrial Report
- 1. 20Q2 21Q1 21Q2 Total Inventory (SF) 50,926,347 51,761,282 52,295,340 New Supply (SF) 172,795 199,757 534,058 Quarterly Net Absorption (SF) 262,891 (65,627) 1,006,935 Overall Vacancy 10.2% 8.6% 6.6% Under Construction (SF) 668,146 1,625,600 2,294,071 Overall Average Asking Rate (W/D) $8.74 $9.03 $9.78 Overal Average Asking Rate (Flex) $14.17 $16.43 $15.24 Lease Single Trace Parkway North | 185K SF DXC Technology Company Sale Pecan 130 Business Park Far Northeast | 239K SF Seller: Birtcher, Anderson & Davis Buyer: Dogwood Industrial Partners Sale Met Center II – Building III Southeast | 160K SF Seller: Mohr Capital Buyer: Four Springs Capital Trust Lease Park 183 – Phase III, Bldg 5 Southeast | 154K SF Total Office/ Move Solutions Sale Southpark Commerce Center Southeast | 372K SF Seller: KBS Buyer: BentallGreenOak YOY FORECAST YOY YOY FORECAST YOY FORECAST FORECAST Industrial Austin, TX 21Q2 Boots On the Ground If you were a tenant seeking more than 100,000 SF of industrial space this quarter, we feel for you. Austin’s industrial market continued its trend of tight supply throughout Q2, driving many tenant requirements into a dwindling supply of shell space while the market awaits new deliveries later this year and into early next. Case in point: Any tenant requirement over 100,000 SF that couldn’t work in a dated metal building was forced to look at shell space, much of which hasn’t yet delivered. There were no 2nd generation tilt-wall options over 100,000 SF across the market. Unemployment Rate Market Indicators Historic Comparison 4.2% Austin Unemployment Rate 1.47% US 10 Year Treasury Note 5.8% US Unemployment Rate Vacancy Rate 6.6% Net Absorption 1.0M SF Average Asking Lease Rates (FSG) $11.45/SF Under Construction 2.3M SF Key Takeaways • Supply constraints across all size ranges are forcing many tenants to consider shell space or pre-leasing in planned and under construction projects • Third-party suppliers for Tesla’s Gigafactory have commenced executing leases – more anticipated in the second half of 2021 • Escalating rents and marginal concessions will likely trend through the year until projects currently under-construction deliver in early 2022 Recent Transactions 0.0% 2.0% 4.0% 6.0% 8.0% 10.0% 12.0% 14.0% 16.0% 18Q1 18Q2 18Q3 18Q3 18Q4 19Q1 19Q1 19Q2 19Q3 19Q3 19Q4 20Q1 20Q1 20Q2 20Q3 20Q3 20Q4 21Q1 21Q1 21Q2 Austin Texas US
- 2. Colliers | Austin | 21Q2 | Industrial Report Industrial Austin, TX 21Q2 Absorption, Supply & Demand 0.0% 4.0% 8.0% 12.0% (200,000) 0 200,000 400,000 600,000 800,000 1,000,000 1,200,000 Q2 2020 Q3 2020 Q4 2020 Q1 2021 Q2 2021 Net Absorption Completions Vacancy Rate Future Forecast The strong demand in the area has everyone’s sights set on the development pipeline which, while extensive, won’t provide significant relief on vacancy until at least Q4 2021 and into Q1 2022. Planned projects and those currently under construction promise to deliver an additional 5 million square feet of space by the first part of 2022, which we anticipate will temper rate growth and stimulate more competition amongst developers and landlords for deals. That said, the market remains constrained in the 2nd quarter of 2021, and with no signs of slowing demand, we anticipate inflated rents and skinny tenant concessions in the near term until the real competition starts. The Market, at a Glance With the market constrained for space across size ranges, Austin continued the novel trend of pre-leasing with much of the activity taking place in the Southeast and Hays County submarkets. Notably, in June, NorthPoint Development officially delivered the Plum Creek Industrial Center 92% pre-leased. Between deals struck in Phase I (444,058 SF) and one of the largest lease deals ever signed in the Austin area totaling 491,651 SF in Building III, the Plum Creek Industrial Center is left with only 73,528 SF of vacant space out of the 935,709 SF planned in the park. Elsewhere, spec industrial projects have seen similarly robust pre-leasing activity, including Phase II at Park 183 in the Southeast submarket which is nearly 80% pre-leased across its two buildings totaling 317,572 SF under construction. Since Tesla’s announcement of their new manufacturing facility in East Austin, all eyes have been on the cadre of third-party suppliers and ancillary manufacturers that were competing for lucrative contracts with the company. The second quarter brought the first of these leases, with more planned in the coming months. Robust demand and lagging supply have squeezed the Austin market, benefiting Landlords with inflated rates and abundant preleasing. This is clearly illustrated by Q2’s absorption of 1,006,935 SF – a 12-month high in an already bustling year. Many construction projects (2,294,071 SF currently under-construction) won’t be shell complete until early 2022, which will continue to drive fierce competition amongst the multitude of tenants seeking space through the second half of 2021.
- 3. Colliers | Austin | 21Q2 | Industrial Report Industrial Austin, TX 21Q2 0 1,000,000 2,000,000 3,000,000 4,000,000 5,000,000 6,000,000 7,000,000 East Georgetown Hays County Northeast & Far Northeast Round Rock Southeast Under Construction Planned Proposed Upcoming Projects Jul ‘21 Jul ‘21 Mar ‘22 Mar ‘22 NorthPark 35, Bldg. I & II 331,030 SF | Georgetown Titan Development | Q3 2021 Tuscany Logistics Center – Buildings I, II & III 373,477 SF | Northeast Dalfen Industrial | Q4 2021 Springbrook Corporate Center – Buildings I & II 246,435 SF | Round Rock IDI Logistics | Q4 2021 130 Logistics Center – Buildings I & II 248,112 SF | Far Northeast Lincoln Property Group | Q1 2022 Speculative Development Pipeline
- 4. Copyright © 2021 Colliers The information contained herein has been obtained from sources deemed reliable. While every reasonable effort has been made to ensure its accuracy, we cannot guarantee it. No responsibility is assumed for any inaccuracies. Readers are encouraged to consult their professional advisors prior to acting on any of the material contained in this report. John O’Sullivan Research Associate Austin +1 512 539 3012 john.o’sullivan@colliers.com David Bremer, SIOR Managing Director Austin +1 512 539 3014 david.bremer@colliers.com FOR MORE INFORMATION Travis Hicks, SIOR Vice President Austin +1 512 539 3005 travis.hicks@colliers.com Chase Clancy Associate Vice President Austin +1 512 539 3023 chase.clancy@colliers.com Submarket Existing Inventory (SF) Direct Vacancy (SF) Sublease Vacancy (SF) Overall Vacancy Rate Quarterly Net Absorption (SF) Weighted Average Asking Rate Market Total Warehouse/Distribution 36,453,229 2,177,821 274,903 6.7% 1,028,834 $9.78 Office Service/Flex 15,842,111 880,980 125,625 6.4% (21,899) $15.24 TOTAL 52,295,340 3,058,801 400,528 6.6% 1,006,935 $11.45 Flex/Office Service Central 391,323 23,559 – 6.0% 16,770 $14.79 Cedar Park 680,893 114,769 – 16.9% 4,242 $16.46 East 1,181,798 15,582 3,354 1.6% 3,284 $32.89 Far Northeast 338,788 9,800 – 2.9% (1,700) $15.25 Far Northwest 133,390 1,516 – 1.1% 3,017 $15.51 Georgetown 222,496 – – 0.0% – – Hays County 420,392 20,572 – 4.9% 5,571 – North 3,438,030 174,511 9,305 5.3% (31,361) $16.73 Northeast 3,436,693 305,297 9,000 9.1% (12,143) $10.40 Northwest 1,646,625 27,195 4,311 1.9% – $14.29 Round Rock 341,056 20,511 – 6.0% 4,278 $10.62 South 323,824 2,000 – 0.6% (2,000) $34.00 Southeast 3,139,578 165,668 99,655 8.5% (11,857) $15.04 Southwest 147,225 – – 0.0% – – TOTAL 15,842,111 880,980 125,625 6.4% (21,899) $15.24 Austin | Q2 2021 | Industrial | Market Statistics Warehouse/Distribution Central 666,931 139,062 – 20.9% (75,350) $16.52 Cedar Park 61,632 – – 0.0% – – East 2,038,579 185,506 – 9.1% 61,010 $10.53 Far Northeast 3,085,153 146,961 33,600 5.9% 77,471 $10.39 Far Northwest 397,685 28,500 – 7.2% (13,000) $12.00 Georgetown 1,719,561 403,896 – 23.5% 71,954 $7.18 Hays County 3,884,241 107,145 46,253 4.6% 252,554 $6.64 North 8,748,880 320,382 49,661 4.2% 276,433 $10.34 Northeast 3,655,447 225,582 609 6.2% 54,608 $9.96 Northwest 1,079,275 16,788 – 1.6% 1,300 – Round Rock 2,021,630 250,339 – 12.4% 42,547 $11.65 South 994,345 52,323 – 5.3% (14,728) $15.52 Southeast 7,990,865 301,337 144,780 5.6% 294,035 $9.38 Southwest 109,005 – – 0.0% – – TOTAL 36,453,229 2,177,821 274,903 6.7% 1,028,834 $9.78