Downloaded 596 times
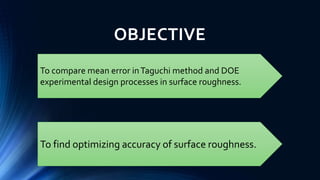


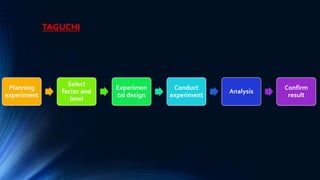

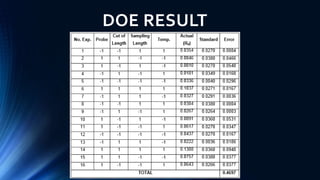
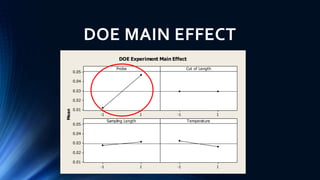
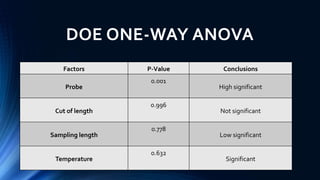
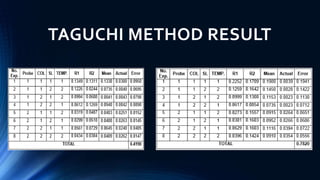
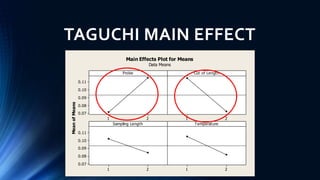
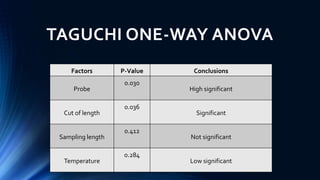
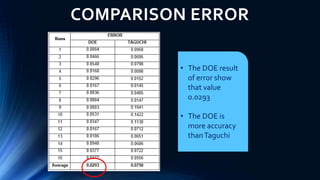
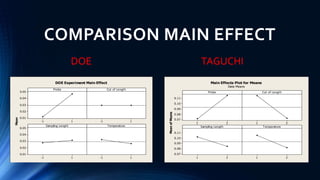
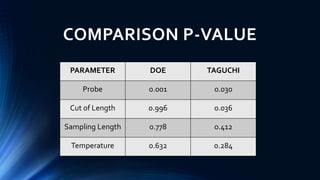
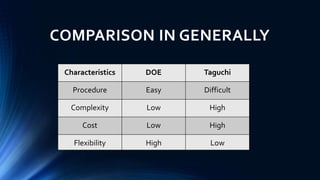


This document presents a comparative study between the Taguchi method and the Design of Experiments (DOE) technique in measuring surface roughness. The results indicate that the DOE method yields a lower error value and greater accuracy compared to the Taguchi method. The study concludes that the DOE process is simpler and more flexible, while the Taguchi method is more complex and expensive.