PH- portland headlandmap on left- is a section of a coastline off .pdf
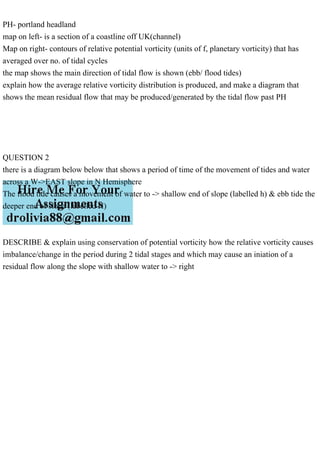
PH- portland headland map on left- is a section of a coastline off UK(channel) Map on right- contours of relative potential vorticity (units of f, planetary vorticity) that has averaged over no. of tidal cycles the map shows the main direction of tidal flow is shown (ebb/ flood tides) explain how the average relative vorticity distribution is produced, and make a diagram that shows the mean residual flow that may be produced/generated by the tidal flow past PH QUESTION 2 there is a diagram below below that shows a period of time of the movement of tides and water across a W->EAST slope in N Hemisphere The flood tide causes a movement of water to -> shallow end of slope (labelled h) & ebb tide the deeper end of slope (labelled H) DESCRIBE & explain using conservation of potential vorticity how the relative vorticity causes imbalance/change in the period during 2 tidal stages and which may cause an iniation of a residual flow along the slope with shallow water to -> right.
Recommended
Recommended

More Related Content
Similar to PH- portland headlandmap on left- is a section of a coastline off .pdf
Similar to PH- portland headlandmap on left- is a section of a coastline off .pdf (20)
More from alicesilverblr
More from alicesilverblr (20)
Recently uploaded
Recently uploaded (20)
PH- portland headlandmap on left- is a section of a coastline off .pdf
- 1. PH- portland headland map on left- is a section of a coastline off UK(channel) Map on right- contours of relative potential vorticity (units of f, planetary vorticity) that has averaged over no. of tidal cycles the map shows the main direction of tidal flow is shown (ebb/ flood tides) explain how the average relative vorticity distribution is produced, and make a diagram that shows the mean residual flow that may be produced/generated by the tidal flow past PH QUESTION 2 there is a diagram below below that shows a period of time of the movement of tides and water across a W->EAST slope in N Hemisphere The flood tide causes a movement of water to -> shallow end of slope (labelled h) & ebb tide the deeper end of slope (labelled H) DESCRIBE & explain using conservation of potential vorticity how the relative vorticity causes imbalance/change in the period during 2 tidal stages and which may cause an iniation of a residual flow along the slope with shallow water to -> right