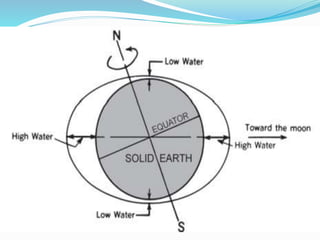
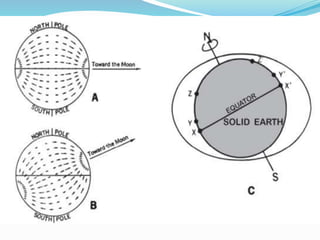
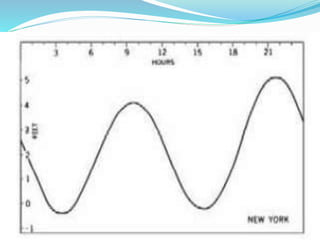
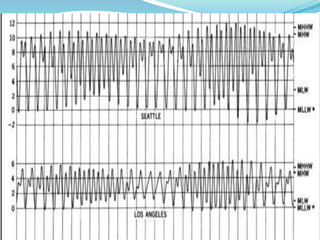
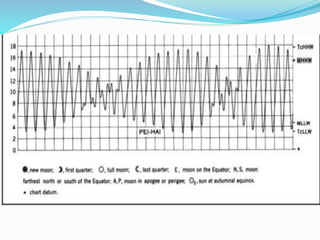
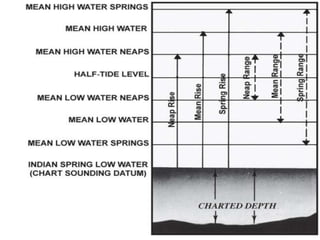
Seismic Hazard Assessment Software in Python by Prof. Dr. Costas Sachpazis
MET-O 222 Final wk1 PPT comprehensive explanation
1.
2.
3.
4. Learning Outcomes:
At the end of this session the students
should be able to:
Discuss the causes and features of
tides and its tidal datum.
Explain the significance of tide and
current prediction
5. TIDES
Tides are the periodic motion of the
waters of the sea due to changes in the
attractive forces of the Moon and Sun
upon the rotating Earth
6. Tides can either help or hinder a
mariner. A high tide may provide
enough depth to clear a bar, while a
low tide may prevent entering or
leaving a harbor.
7. Tidal current may help progress or
hinder it, may set the ship toward
dangers or away from them.
8. By understanding tides and making
intelligent use of predictions
published, the navigator can plan an
expeditious and safe passage through
tidal waters.
9. Tide and Current
The rise and fall of tide is accompanied
by horizontal movement of the water
called tidal current.
10. It is necessary to distinguish clearly
between tide and tidal current, for the
relation between them is complex and
variable.
11. For the sake of clarity mariners have
adopted the following definitions:
Tide is the vertical rise and fall of the
water, and tidal current is the
horizontal flow.
12. The tide rises and falls, the tidal
current floods and ebbs. The
navigator is concerned with the
amount and time of the tide, as it
affects access to shallow ports.
13. The navigator is concerned with the
time, speed, and direction of the tidal
current, as it will affect his ship’s
position, speed, and course.
14. Tides are superimposed on nontidal
rising and falling water levels, caused
by weather, seismic events, or other
natural forces.
15. Similarly, tidal currents are
superimposed upon non-tidal currents
such as normal river flows, floods, and
freshets.
16. Causes of Tides
The principal tidal forces are generated
by the Moon and Sun. The Moon is
the main tide-generating body.
17. Due to its greater distance, the Sun's
effect is only 46 percent of the Moon's.
Observed tides will differ considerably
from the tides predicted by
equilibrium theory because size,
depth,
18. and configuration of the basin or
waterway, friction, land masses, inertia
of water masses, Coriolis acceleration,
and other factors are neglected in this
theory.
19. Nevertheless, the equilibrium theory is
sufficient to describe the magnitude
and distribution of the main tide-
generating forces across the surface of
the Earth.
20.
21. where d is the distance between the
two masses, and G is the universal
gravitational constant which depends
upon the units employed. This law
assumes that m1 and m2 are point
masses.
22. Newton was able to show that
homogeneous spheres could be treated
as point masses when determining
their orbits.
23. Using the law of gravitation, it is found
that the orbits of two point masses are
conic sections about the barycenter of
the two masses.
24. In the case of the Earth-Moon system,
both the Earth and the Moon describe
elliptical orbits about their barycenter
if both bodies are assumed to be
homogeneous spheres and the
gravitational forces of the Sun and
other planets are neglected.
25. The Earth-Moon barycenter is located
74/100 of the distance from the center
of the Earth to its surface, along the
line connecting the Earth’s and Moon’s
centers. See Figure 3502a.
26.
27. Thus the center of mass of the Earth
describes a very small ellipse about the
Earth-Moon barycenter, while the
center of mass of the Moon describes a
much larger ellipse about the same
barycenter.
28. If the gravitational forces of the other
bodies of the solar system are
neglected, Newton’s law of gravitation
also predicts that the Earth-Moon
barycenter will describe an orbit which
is approximately elliptical about the
barycenter of the Sun-Earth-Moon
system.
30. FEATURES OF TIDES
At most places the tidal change occurs
twice daily. The tide rises until it
reaches a maximum height, called
high tide or high water, and then
falls to a minimum level called low
tide or low water.
31. The rate of rise and fall is not uniform.
From low water, the tide begins to rise
slowly at first, but at an increasing rate
until it is about halfway to high water
32. The rate of rise then decreases until
high water is reached, and then the rise
ceases.
33. The falling tide behaves in a similar
manner. The period at high or low
water during which there is no
apparent change of level is called
stand.
34. The difference in height between
consecutive high and low waters is the
range.
35.
36.
37.
38. Types of Tide
A body of water has a natural period of
oscillation, dependent upon its
dimensions.
39. None of the oceans is a single
oscillating body; rather each one is
made up of several separate oscillating
basins.
40. As such basins are acted upon by the
tide-producing forces, some respond
more readily to daily or diurnal forces,
others to semidiurnal forces, and
others almost equally to both.
41. Hence, tides are classified as one of
three types, semidiurnal, diurnal, or
mixed, according to the characteristics
of the tidal pattern.
42. In the semidiurnal tide, there are
two high and two low waters each tidal
day, with relatively small differences in
the respective highs and lows.
43. Tides on the Atlantic coast of the
United States are of the semidiurnal
type, which is illustrated in Figure
3505a by the tide curve for Boston
Harbor.
44.
45. In the diurnal tide, only a single high
and single low water occur each tidal
day. Tides of the diurnal type occur
along the northern shore of the Gulf of
Mexico, in the Java Sea, the Gulf of
Tonkin, and in a few other localities.
46. The tide curve for Pei-Hai, China,
illustrated in Figure 3505b, is an
example of the diurnal type
47. In the mixed tide, the diurnal and
semidiurnal oscillations are both
important factors and the tide is
characterized by a large inequality in
the high water heights, low water
heights, or in both.
48. There are usually two high and two
low waters each day, but occasionally
the tide may become diurnal.
49. Such tides are prevalent along the
Pacific coast of the United States and
in many other parts of the world.
Examples of mixed types of tide are
shown in Figure 3505c.
50.
51. At Los Angeles it is typical that the
inequalities in the high and low waters
are about the same. At Seattle the
greater inequalities are typically in the
low waters, while at Honolulu it is the
high waters that have the greater
inequalities.
52. Solar Tide
The natural period of oscillation of a
body of water may accentuate either
the solar or the lunar tidal oscillations
53. Though as a general rule the tides
follow the Moon, the relative
importance of the solar effect varies in
different areas.
54. There are a few places, primarily in the
South Pacific and the Indonesian
areas, where the solar oscillation is the
more important, and at those places
the high and low waters occur at about
the same time each day.
55. At Port Adelaide, Australia the solar
and lunar semidiurnal oscillations are
equal and nullify one another at neaps.
56. Special Tidal Effects
As a wave enters shallow water, its
speed is decreased. Since the trough is
shallower than the crest, it is retarded
more, resulting in a steepening of the
wave front.
57. In a few estuaries, the advance of the
low water trough is so much retarded
that the crest of the rising tide
overtakes the low, and advances
upstream as a breaking wave called a
bore.
58. Bores that are large and dangerous at
times of large tidal ranges may be mere
ripples at those times of the month
when the range is small.
59. Examples occur in the Petitcodiac
River in the Bay of Fundy, and at
Haining, China, in the Tsientang
Kaing. The tide tables indicate where
bores occur.
60. Other special features are the double
low water (as at Hoek Van Holland)
and the double high water (as at
Southampton, England).
61. At such places there is often a slight
fall or rise in the middle of the high or
low water period.
62. The practical effect is to create a longer
period of stand at high or low tide. The
tide tables list these and other
peculiarities where they occur.
63. Variations in Range
Though the tide at a particular place
can be classified as to type, it exhibits
many variations during the month
(Figure 3508a).
64.
65.
66.
67. The range of the tide varies according
to the intensity of the tide-producing
forces, though there may be a lag of a
day or two between a particular
astronomic cause and the tidal effect.
68. The combined lunar-solar effect is
obtained by adding the Moon’s tractive
forces vectorially to the Sun’s tractive
forces.
69. The resultant tidal bulge will be
predominantly lunar with modifying
solar effects upon both the height of
the tide and the direction of the tidal
bulge.
70. Special cases of interest occur during
the times of new and full Moon (Figure
3508b)
71. With the Earth, Moon, and Sun lying
approximately on the same line, the
tractive forces of the Sun are acting in
the same direction as the Moon’s
tractive forces (modified by declination
effects).
72. The resultant tides are called spring
tides, whose ranges are greater than
average.
73. Between the spring tides, the Moon is
at first and third quarters. At those
times, the tractive forces of the Sun are
acting at approximately right angles to
the Moon’s tractive forces. The results
are tides called neap tides, whose
ranges are less than average.
74. With the Moon in positions between
quadrature and new or full, the effect
of the Sun is to cause the tidal bulge to
either lag or precede the Moon (Figure
3508c). These effects are called
priming and lagging the tides.
75.
76.
77. Thus, when the Moon is at the point in
its orbit nearest the Earth (at perigee),
the lunar semidiurnal range is
increased and perigean tides occur.
78. When the Moon is farthest from the
Earth (at apogee), the smaller apogean
tides occur.
79. When the Moon and Sun are in line
and pulling together, as at new and full
Moon, spring tides occur (the term
spring has nothing to do with the
season of year);
80. when the Moon and Sun oppose each
other, as at the quadratures, the
smaller neap tides occur. When
certain of these phenomena coincide,
perigean spring tides and apogean
neap tides occur.
81. These are variations in the semidiurnal
portion of the tide. Variations in the
diurnal portion occur as the Moon and
Sun change declination.
82. When the Moon is at its maximum
semi-monthly declination (either
north or south), tropic tides occur in
which the diurnal effect is at a
maximum.
83. When it crosses the equator, the
diurnal effect is a minimum and
equatorial tides occur.
84. Tidal Cycles
Tidal oscillations go through a number
of cycles. The shortest cycle,
completed in about 12 hours and 25
minutes for a semidiurnal tide, extends
from any phase of the tide to the next
recurrence of the same phase.
85. During a lunar day (averaging 24
hours and 50 minutes) there are two
highs and two lows (two of the shorter
cycles) for a semidiurnal tide.
86. The Moon revolves around the Earth
with respect to the Sun in a synodical
month of about 29 1/2 days, commonly
called the lunar month.
87. The effect of the phase variation is
completed in one-half of a synodical
month or about 2 weeks as the Moon
varies from new to full or full to new.
88. The effect of the Moon’s declination is
also repeated in one-half of a tropical
month of 27 1/3 days, or about every 2
weeks.
89. The cycle involving the Moon’s
distance requires an anomalistic
month of about 27 1/2 days. The Sun’s
declination and distance cycles are
respectively a half year and a year in
length.
90. An important lunar cycle, called the
nodal period or Metonic cycle (after
Greek philosopher Meton, fifth
century B.C., who discovered the
phenomenon) is 18.6 years (usually
expressed in round figures as 19 years).
91. For a tidal value, particularly a range,
to be considered a true mean, it must
be either based upon observations
extended over this period of time, or
adjusted to take account of variations
known to occur during the nodal
period.
92. The nodal period is the result of axis of
the Moon’s rotation being tilted 5
degrees with respect to the axis of the
Earth’s rotation. Since the Earth’s axis
is tilted 23.5 degrees with respect to the
plane of its revolution around the sun,
93. the combined effect is that the Moon’s
declination varies from 28.5 degrees to
18.5 degrees in a cycle lasting 18.6
years.
94. For practical purposes, the nodal
period can be considered as the time
between the Sun and Moon appearing
in precisely the same relative positions
in the sky.
95. TIDAL DATUMS
Low Water Datums
A tidal datum is a given average tide
level from which heights of tides and
overhead clearances are measured.
96. It is a vertical datum, but is not the
same as vertical geodetic datum, which
is a mathematical quantity developed
as part of a geodetic system used for
horizontal positioning.
97. There are a number of tidal levels of
reference that are important to the
mariner. See Figure 3512.
98.
99. The most important level of reference
is the sounding datum shown on
charts. The sounding datum is
sometimes referred to as a reference
plane to distinguish it from vertical
geodetic datum.
100. Since the tide rises and falls
continually while soundings are being
taken during a hydrographic survey,
the tide is recorded during the survey
so that soundings taken at all stages of
the tide can be reduced to a common
sounding datum.
101. Soundings on charts show depths
below a selected low water datum
(occasionally mean sea level), and tide
predictions in tide tables show heights
above and below the same level.
102. The depth of water available at any
time is obtained by adding
algebraically the height of the tide at
the time in question to the charted
depth.
103. The following are some of the datums
in general use.
Mean low water (MLW) is the average
height of all low waters at a given place.
About half of the low waters fall below
it, and half above.
104. Mean low water springs (MLWS),
usually shortened to low water springs,
is the average level of the low waters
that occur at the times of spring tides.
105. Mean lower low water (MLLW) is the
average height of the lower low waters
of each tidal day.
106. Tropic lower low water (TcLLW) is
the average height of the lower low
waters (or of the single daily low waters
if the tide becomes diurnal) that occur
when the Moon is near maximum
declination and the diurnal effect is
most pronounced. This datum is not in
common use as a tidal reference.
107. Indian spring low water (ISLW),
sometimes called Indian tide plane
or harmonic tide plane, is a low water
datum that includes the spring effect
of the semi-diurnal portion of the tide
and the tropic effect of the diurnal
portion
108. It is about the level of lower low water
of mixed tides at the time that the
Moon’s maximum declination
coincides with the time of new or full
Moon.
109. Mean lower low water springs
(MLLWS) is the average level of the
lower of the two low waters on the days
of spring tides
110. Some lower datums used on charts are
determined from tide observations and
some are determined arbitrarily and
later referred to the tide. Most of them
fall close to one or the other of the
following two datums.
111. Lowest normal low water is a datum
that approximates the average height
of monthly lowest low waters,
discarding any tides disturbed by
storms.
112. Lowest low water is an extremely low
datum. It conforms generally to the
lowest tide observed, or even
somewhat lower
113. High Water Datums
Heights of terrestrial features are
usually referred on nautical charts to a
high water datum. This gives the
mariner a margin of error when
passing under bridges, overhead
cables, and other obstructions
114. The one used on charts of the United
States, its territories and possessions,
and widely used elsewhere, is mean
high water (MHW), which is the
average height of all high waters over a
19 year period.
115. Any other high water datum in use on
charts is likely to be higher than this.
Other high water datums are mean
high water springs (MHWS), which
is the average level of the high waters
that occur at the time of spring tides;
116. mean higher high water (MHHW),
which is the average height of the
higher high waters of each tidal day;
117. and tropic higher high water
(TcHHW), which is the average height
of the higher high waters (or the single
daily high waters if the tide becomes
diurnal) that occur when the Moon is
near maximum declination and the
diurnal effect is most pronounced.
118. A reference merely to “high water”
leaves some doubt as to the specific
level referred to, for the height of high
water varies from day to day. Where the
range is large, the variation during a 2
week period may be considerable.
119. Because there are periodic and
apparent secular trends in sea level, a
specific 19 year cycle (the National
Tidal Datum Epoch) is issued for all
United States datums.
120. The National Tidal Datum Epoch
officially adopted by the National
Ocean Service is presently 1983
through 2001. The Epoch is reviewed
for revision every 20 -25 years.
121. Tidal and Nontidal Currents
Horizontal movement of water is
called current. It may be either “tidal”
and “nontidal.” Tidal current is the
periodic horizontal flow of water
accompanying the rise and fall of the
tide. Nontidal current includes all
currents not due to the tidal
movement.
122. Nontidal currents include the
permanent currents in the general
circulatory system of the oceans as well
as temporary currents arising from
meteorological conditions. The current
experienced at any time is usually a
combination of tidal and nontidal
currents.
123. General Features
Offshore, where the direction of flow is
not restricted by any barriers, the tidal
current is rotary; that is, it flows
continuously, with the direction
changing through all points of the
compass during the tidal period.
124. This rotation is caused by the Earth’s
rotation, and unless modified by local
conditions, is clockwise in the
Northern Hemisphere and
counterclockwise in the Southern
Hemisphere.
125. The speed usually varies throughout
the tidal cycle, passing through two
maximums in approximately opposite
directions, and two minimums about
halfway between the maximums in
time and direction. Rotary currents can
be depicted as in Figure 3515a
126.
127. In rivers or straits, or where the
direction of flow is more or less
restricted to certain channels, the
tidal current is reversing; that is, it
flows alternately in approximately
opposite directions with an instant or
short period of little or no current,
called slack water, at each reversal of
the current.
128. During the flow in each direction,
the speed varies from zero at the time
of slack water to a maximum, called
strength of flood or ebb, about
midway between the slacks.
Reversing currents can be indicated
graphically, as in Figure 3515b,
129.
130. by arrows that represent the speed
of the current at each hour. The flood
is usually depicted above the slack
waterline and the ebb below it.
131. The tidal current curve formed by
the ends of the arrows has the same
characteristic sine form as the tide
curve. In illustrations and for certain
other purposes it is convenient to
omit the arrows and show only the
curve.
132. The tides at the two ends of a strait
are seldom in phase or equal in range,
and the current, called hydraulic
current, is generated largely by the
continuously changing difference in
height of water at the two ends.
133. The speed of a hydraulic current
varies nearly as the square root of the
difference in height.
134. The speed reaches a maximum
more quickly and remains at strength
for a longer period than shown in
Figure 3515b, and the period of weak
current near the time of slack is
considerably shortened.
135. The current direction, or set, is the
direction toward which the current
flows. The speed is sometimes called
the drift. The term “velocity” is often
used as the equivalent of “speed”
when referring to current, although
strictly speaking “velocity” implies
direction as well as speed.
136. The term “strength” is also used to
refer to speed, but more often to
greatest speed between consecutive
slack waters. The movement toward
shore or upstream is the flood, the
movement away from shore or
downstream is the ebb.
137. In a purely semidiurnal current
unaffected by nontidal flow, the
flood and ebb each last about 6
hours and 13 minutes. But if there is
either diurnal inequality or nontidal
flow, the durations of flood and ebb
may be quite unequal.
138. Tidal Current Periods and
Cycles Tidal currents have periods
and cycles similar to those of the
tides, and are subject to similar
variations, but flood and ebb of the
current do not necessarily occur at
the same times as the rise and fall of
the tide.
139. The speed at flood or ebb strength
increases and decreases during the 2
week period, month, and year along
with the variations in the range of
tide
140. Thus, the stronger spring and
perigean currents occur near the
times of new and full Moon and near
the times of the Moon’s perigee, or at
times of spring and perigean tides;
the weaker neap and apogean
currents occur at the times of neap
and apogean tides.
141. Tropic currents with increased
diurnal speeds or with larger diurnal
inequalities in speed occur at times of
tropic tides and equatorial currents
with a minimum diurnal effect occur
at times of equatorial tides.
142. As with the tide, a mean value
represents an average obtained from a
19 year series. Since a series of current
observations is usually limited to a
few days, and seldom covers more
than a month or two
143. it is necessary to adjust the
observed values, usually by
comparison with tides at a nearby
place, to obtain such a mean.
144. Tidal Current Observations
Observations of current are made
with sophisticated electronic current
meters. Current meters are
suspended from a buoy or anchored
to the bottom with no surface marker
at all.
145. Very sensitive current meters
measure and record deep ocean
currents; these are later recovered by
triggering a release mechanism with a
signal from the surface.
146. Untended current meters either
record data internally or send it by
radio or satellite to a base station on
ship or land. The period of
observation varies from a few hours
to few years.
147. TIDE AND CURRENT
PREDICTION Tidal Height
Predictions To measure the height of
tides, hydrographers select a
reference level, sometimes referred to
as the reference plane, or vertical
datum.
148. This vertical tidal datum is not the
same as the vertical geodetic datum.
Soundings shown on the largest scale
charts are the vertical distances from
this datum to the bottom.
149. At any given time the actual depth is
this charted depth plus the height of
tide. In most places the reference
level is some form of low water.
150. But all low waters at a given place are
not the same height, and the selected
reference level is seldom the lowest
tide occurring at the place.
151. When lower tides occur, these are
indicated in the tide tables by a
negative sign. Thus, at a spot where
the charted depth is 15 feet, the actual
depth is 15 feet plus the tidal height.
152. When the tide is three feet, the
depth is 15 + 3 = 18 feet. When it is -1
foot, the depth is 15 - 1 = 14 feet. The
actual depth can be less than the
charted depth.
153. In an area where there is a
considerable range of tide (the
difference between high water and
low water), the height of tide might
be an important consideration when
using soundings to determine if the
vessel is in safe water.
154. The heights given in the tide tables
are predictions, and when assumed
conditions vary considerably, the
predictions shown may be
considerably in error.
155. Heights lower than predicted can be
anticipated when the atmospheric
pressure is higher than normal, or
when there is a persistent strong
offshore wind.
156. The greater the range of tide, the
less reliable are the predictions for
both height and current.
157. Tidal Heights
The nature of the tide at any place
can best be determined by
observation
158. The predictions in tide tables and
the tidal data on nautical charts are
based upon detailed observations at
specific locations, instead of
theoretical predictions.
159. Tidal elevations are usually observed
with a continuously recording gauge.
A year of observations is the
minimum length desirable for
determining the harmonic constants
used in prediction.
160. For establishing mean sea level and
long-term changes in the relative
elevations of land and sea, as well as
for other special uses, observations
have been made over periods of 20,
30, and even 120 years at important
locations
161. Observations for a month or less will
establish the type of tide and suffice
for comparison with a longer series of
observations to determine tidal
differences and constants.
162. Mathematically, the variations in the
lunar and solar tide-producing forces,
such as those due to changing phase,
distance, and declination, are
considered as separate constituent
forces,
163. and the harmonic analysis of
observations reveals the response of
each constituent of the tide to its
corresponding force.
164. At any one place this response
remains constant and is shown for
each constituent by harmonic
constants which are in the form of a
phase angle for the time relation and
an amplitude for the height.
165. Harmonic constants are used in
making technical studies of the tide
and in tidal predictions on
computers.
166. Tidal Current Predictions
Tidal currents are due primarily to
tidal action, but other causes are
often present. The Tidal Current
Tables give the best prediction of
total current.
167. Following heavy rains or a drought, a
river’s current prediction may be
considerably in error
168. Set and drift may vary considerably
over different parts of a harbor,
because differences in bathymetry
from place to place affect current.
169. Since this is usually an area where
small errors in a vessel’s position are
crucial, a knowledge of predicted
currents, particularly in reduced
visibility, is important.
170. Strong currents occur mostly in
narrow passages connecting larger
bodies of water.
171. Currents of more than 5 knots are
sometimes encountered at the
Golden Gate in San Francisco, and
currents of more than 13 knots
sometimes occur at Seymour
Narrows, British Columbia.
172. In straight portions of rivers and
channels, the strongest currents
usually occur in the middle of the
channel.
173. In curved portions the swiftest
currents (and deepest water) usually
occur near the outer edge of the
curve.
174. Countercurrents and eddies may
occur on either side of the main
current of a river or narrow passage,
especially near obstructions and in
bights
175. In general, the range of tide and the
velocity of tidal current are at a
minimum in the open ocean or along
straight coasts.
176. The greatest tidal effects are usually
encountered in estuaries, bays, and
other coastal indentations.
177. A vessel proceeding along an
indented coast may encounter a set
toward or away from the shore; a
similar set is seldom experienced
along a straight coast.
Figure 3503c. Theoretical equilibrium configuration due to Moon’s differential gravitational forces. One bulge of the water envelope is located at the sublunar point, the other bulge at the antipode.
Figure 3503d. Effects of the declination of the Moon.
Figure 3504 is a graphical representation of the rise and fall of the tide at New York during a 24-hour period. The curve has the general form of a variable sine curve.
Figure 3508b. (A) Spring tides occur at times of new and full Moon. Range of tide is greater than average since solar and lunar tractive forces act in same direction. (B) Neap ties occur at times of first and third quarters. Range of tide is less than average since solar and lunar tractive forces act at right angles.