Congo offshore
•
1 like•296 views

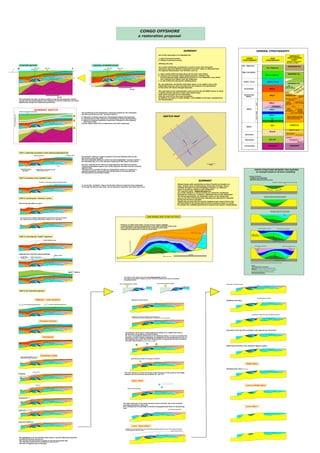
The document describes the restoration of geological sequences in an area affected by salt tectonics and uplift. The restoration involves 5 steps: 1) restoring a sequence to a reference dip, 2) correcting a synthetic drop using a horizontal target, 3) recovering an eroded reference surface, 4) recovering eroded sequences, and 5) applying the overall restoration approach. A forward model of salt tectonics involving subsidence and diapirism provides context for interpreting a turtle structure in the area.

Recommended
More Related Content
What's hot
What's hot (20)
Similar to Congo offshore
Similar to Congo offshore (20)
More from Michele Marco Comisso
More from Michele Marco Comisso (12)
Recently uploaded
Recently uploaded (20)
Congo offshore
- 1. apparent inversion reference target geometry The restoration has been carried on without using the decompaction module. Anyway only the backstripping of the Oligocene to Recent sequences (A) would significantly change the underneath geometries. B C Reference depositional geometry The partitioning of the sedimentary sequences utilized for the restoration has been put forward on the “summary sketch”: STEP 1: restoration of module C to the reference depositional dip Aim of the restoration is to highlight the: 1. type of structural events 2. timing of structural events affecting the area. It is worth mentioning, in particular in such an area, that during the restoration approach different hypothesis has been made, as deducted from the regional interpretation and remarks, such as: a. deep-rooted uplift involving above all the inner area (East); b. presence of truncation and/or gliding surfaces, related to the abovementioned uplift, splitting the section in a non-deposition area (East) and a basinal area (West) from the Oligocene; c. no salt withdrawal during the uplifting phase. So, any deduction, during the restoration steps, is not relative only to the interpreted sections, but is deriving from the analysis of the geometries of the entire 3D volume through Geoprobe. The used data for the interpretation come out from the 3D PSDM volume in which 4 seismic section has been chosen (see sketch map): XLNs 2734 and 2512 for the restoration, ILNs 632 and 475 for the cross-correlation. In addition, the data of 3 wells (KTNS1, 4 and SUNDA 4) has been considered for the interpretation SUMMARY No particular reference target is present in the area affected either by the salt motion and by the uplift. The only noticeable reference surface has been highlighted “summary sketch” : the calculated dip (2°) is the reference target dip of the bottom salt surface. a restoration proposal CONGO OFFSHORE To correct the “synthetic” drop an horizontal reference target has been supposed, so through the flexural slip mode the pre-Senonian sequences have been stuck to it. correction of the drop through an horizontal target STEP 2: correction of the “synthetic” drop Anyway, restoring to the reference target geometry the deformed section incoherent geometries appear such as the apparent inversion and the eastward regional drop. The hazard is to consider the dip of a depositional surface as a target of a regional monocline, anyway the inferred dip seems to be coherent with the depositional environment (delta). STEP 3: recovering the “reference” surface STARTING SECTION 2° 10 km INL 632 INL 475 0.0 5.0 km EW 10 km 0.0 5.0 km ORIGINAL INTERPRETATION INL 632 INL 475 KITIN A-04 KITIN A-01 SO UN DA-4 2512 2734 632 475 5 km SKETCH MAP KTNS 4KTSM 4 Aptian Cenomanian Albian SEQ.5Cenomanian POINT INDIENNE Fm. (lacustrine shales) LIKOUALA Fm. TCHALA Fm . SENDJI Fm. CHELA Fm. (gres) LOEME Fm. Basement Syn-rift Presalt Salt 1B 1A Seq.1 2A4 Seq.2 intraseq.3 SEQ.3 SEQ.4 Coniac.-Turon. Olig.-Low.Senon. Rec.-Oligocene POINT NOIRE Fm. DJENO Fm. SIALIVAKOU Fm. VANDJI Fm. BASEMENT Barremian Neocomian Precambrian Albian seq. d’ennoyement upperlowertomiddle Tight carbonates of external platform with sandstone and oolitic grainstone levels shales Siltitic carbonates (ext. platform) Bioclastic oncolitic carbonates (open shallow platform) Siltitic carbonates (ext. plat.) Dolomitic-silt (plat./prodelta) Carbonates and marls (ext. plat.) Dolomite (lagoon) Fuvial/deltas’ sds. (shore/barrier) Silt dolomitic-silt (plat./prodelta) MADINGO Fm. Coniac.-Turon. Olig.-Low.Senon. Rec.-Oligocene PALOUKOU Fm. CRONO- STRATIGRAPHY USED STRATIGRAPHY REFERENCE STRATIGRAPHIC CHART (offshore Congo basin) ENI-SPES, June 2004 GENERAL STRATIGRAPHY SUMMARY SKETCH erosionalandglidingsurfaces A A. Oligocene to Recent sequences: backstripped without decompaction; B. Low.Senonian to Olig. Sequences: backstripped without decompaction; C. Aptian to Coniacian sequences: sequences undergone to the proposed restoration steps; D.Lower Aptian (post-rift?) to Neocomian (syn-rift?) sequences. D 2° Original dip of the base of salt (deformed state section) “synthetic” drop Recovering the offset on seq.4 Used reference top Uplift = 1500 m Oligocene - Lower Senonian Coniacian-Turonian Cenomanian Cenomanian-Albian To recover the original depositional geometries of top of seq.5 the resored top of seq.4 has been chosen as a reference Supposed top Coniacian paleomorphology gliding surface re-sedimented Coniacian - Turonian sequences? eroded sequence(s) inward migrating sequence(s) outward migrating sequence(s) STEP 4: recovering the “eroded” sequences STEP 5: the restoration approach Recovering the offset along the left-hand turtle side (top of seq.4) Total offset recover along the highlighted fault Former reference Sticking the hgw. to the regional through flex. slip New reference (.6° anticlockwise) Eroded area Stripping away the light-coloured) portion of seq.4 upper ( (see the above sketch) A The new reference surface of the top of the intraseq.3 is the result of the merge between the two previous top surfaces (w” and “z”).“ New top turtlereference. Proposed westward dipping fault trajectory (either according to coherent turtle geometries and 2512 geoseismic section indications) The restore of the right-hand turtle side setting apart the left limb from the post-kynematic collapse has been carried out isolating the turtle and splitting the gliding surface. (constant growing area) Setting the whole section Old reference boundary Modifing the turtle decollement until reaching the best-fitting between the top of the restored intraseq.3 and the regional reference surface The highlighted area (red dotted circle) shows a reverse offset that should be considered ficticious because of: -the scarcely focused seismic imaging on the left hand turtle side -the lack of regional pins on the hgw. (the interpretation should be revised according to the proposed model) ; 2,5 km SOME REMARKS ABOUT KITINA SUD TURTLE Verypoorseismicimaging Poor seismic imaging - Presence, on both turtle limbs, of areas of poor seismic imaging; - constant presence of growing sequences on the right-hand side of the turtle - outer migration of the depocentral zones (eastward turtle limb) - complete salt withdrawal on both the turtle limbs Depo-central areas Area of post-kynematic collapse Area of post-kynematic collapse According to the forward model proposed by Hudec & al. (2003) the turtle is bordered by rising diapirs on both its limbs. So, even if completely withdrawed in the deformed state, it is wise to consider the presence of such a diapirs supposing, as antithetical to the interpreted one (A), an east-dipping listric fault (B) which interpretation is impossible because erased by the later structuration (post-kynematic collapse) B Recovering the offset of intraseq.3 on fault B w z w z Upper Albian The right-hand side of the turtle has been stuck to the ftw. due to the constant growing geometries on that limb. As a consequence the salt diapirs should be topographically lower on the growing side. regional reference surface Lower “Upper Albian” Restoration of the top of seq.2 Stripping away seq.2 Overestimated salt diapir Geoseismic section 2512 top salt reference surface Correction of the top salt according to the regional top salt surface Referring the top2A4 to the reference regional surface Stripping away seq.2 (turtle area) Middle Albian Lower Albian Lower to Middle Albian From: AGL Geodynamics Laboratory Topographic relief keeps sedimentation focused in the basin Central basin welds to base salt, causing subsequent withdrawal to shift towards the diapirs on either side Subsidence of flanks may not be synchronous; here subsidence begins first on the right flank. Subsidence begins on left flank Volume of salt decreases with time due to dissolution Central basin isopach thick Right-hand basin isopach thick Central basin isopach thick Left-hand basin isopach thick Right-hand basin isopach thick Salt is still left under both flanks, so the structure could continue to evolve Annual Progress Report to Industrial Associates for 2003 Slide Set 22 M.R.Hudec, M.P.A.Jackson, B.C.Vendeville, D.D. Schultz-Ela. Bureau of Economic Geology, Scott W.Tinker, Director Jackson School of Geosciences The University of Texas at Austin TURTLE STRUCTURE BETWEEN TWO DIAPIRS: an example based on forward modelling Boundary conditions: - subsidence of a central basin - grounding of the central basin - shifting of withdrawal to the two flanks Michael Hudec with contribution by Kerza Prewitt and Xuejiao Liu (AGL, Jackson Scool of Geosciences, University of Austin, Texas) realized, through a forward modelling in Geosec sw. different cases of structures related to salt withdrawal. The reported model depicts the evolution of a turtle related to a central sinking of a sequence (minibasin) followed by continuous “jumping” subsidence due to salt withdrawal. The derived geometries are amazingly similar to the interpreted ones on the XLN 2734 particularly regarding the depocentre migration during the structure evolution. Taking into account that the seismic imaging is poor most of all on the left-hand flank of the interpreted structure (westward side) it is worth to consider the modelled geometries to improve the seismic interpretation. (see right-hand sketch) SUMMARY