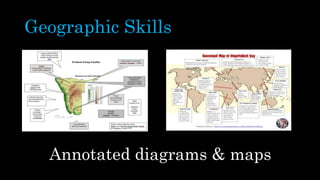
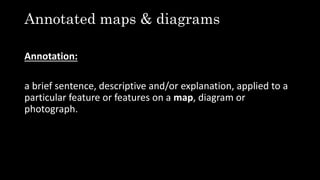
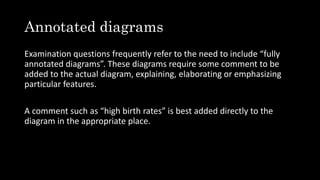
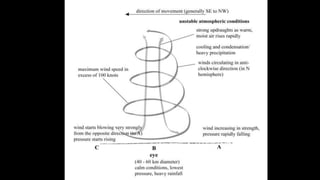
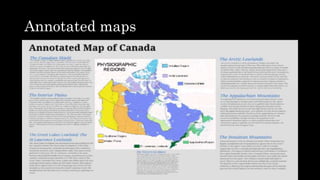
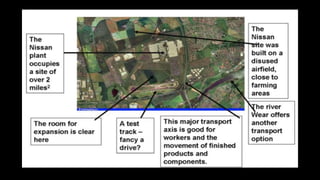
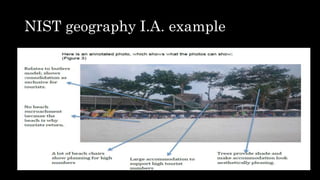
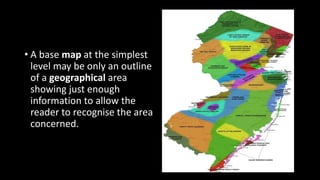
Successfully reported this slideshow.
Your SlideShare is downloading. ×

Annotated maps & diagrams

Ad
Ad
Ad
Ad
Ad
Ad
Ad
Ad
Ad
Ad
Ad
Upcoming SlideShare
Urbanization in Asia
Loading in …3
×

Check these out next

1 of 15 Ad

More Related Content

Slideshows for you (20)

Advertisement

Recently uploaded (20)

Advertisement

Annotated maps & diagrams

  1. 1. Geographic Skills Annotated diagrams & maps
  2. 2. Annotated maps & diagrams Annotation: a brief sentence, descriptive and/or explanation, applied to a particular feature or features on a map, diagram or photograph.
  3. 3. Annotated diagrams Examination questions frequently refer to the need to include “fully annotated diagrams”. These diagrams require some comment to be added to the actual diagram, explaining, elaborating or emphasizing particular features. A comment such as “high birth rates” is best added directly to the diagram in the appropriate place.
  4. 4. Example: Tropical cyclone Using only an annotated diagram describe the change of weather that can be experienced as the weather system passes directly overhead
  5. 5. Annotated maps
  6. 6. NIST geography I.A. example
  7. 7. NIST geography I.A. example
  8. 8. • A base map at the simplest level may be only an outline of a geographical area showing just enough information to allow the reader to recognise the area concerned.
  9. 9. In IB Geography Examination questions frequently refer to the need for “fully annotated maps”. Annotating maps requires students to include comments on the map itself and to place these comments in the relevant locations. Comments added after the maps are not acceptable.
  10. 10. NIST geography I.A. example Note: in the fieldwork, labels (anything <10 words. e.g. names of countries on map below) do not count for the word limit while annotations (anything >10 words) do count.
  11. 11. Common problems tend to be that students produce small, untidy, inaccurate maps that are not located and lack orientation.
  12. 12. Skill Application 10 minute test: Use an annotated diagram to explain the population distribution of one country

×