SlideShare a Scribd company logo
1 of 9
Download to read offline
News Release
FOR IMMEDIATE RELEASE:
Increased demand helps housing market reach balanced territory
VANCOUVER, BC – October 2, 2019 – Home buyer demand has returned to more historically
typical levels in Metro Vancouver* over the last three months.
The Real Estate Board of Greater Vancouver (REBGV) reports that residential home sales in the
region totalled 2,333 in September 2019, a 46.3 per cent increase from the 1,595 sales recorded
in September 2018, and a 4.6 per cent increase from the 2,231 homes sold in August 2019.
Last month’s sales were 1.7 per cent below the 10-year September sales average.
“We’re seeing more balanced housing market conditions over the last three months compared to
what we saw at this time last year,” Ashley Smith, REBGV president said. “Home buyers are
more willing to make offers today, particularly in the townhome and apartment markets.”
There were 4,866 detached, attached and apartment properties newly listed for sale on the
Multiple Listing Service® (MLS®) in Metro Vancouver in September 2019. This represents a
7.8 per cent decrease compared to the 5,279 homes listed in September 2018 and a 29.9 per cent
increase compared to August 2019 when 3,747 homes were listed.
The total number of homes currently listed for sale on the MLS® system in Metro Vancouver is
13,439, a 2.7 per cent increase compared to September 2018 (13,084) and a 0.3 per cent increase
compared to August 2019 (13,396).
For all property types, the sales-to-active listings ratio for September 2019 is 17.4 per cent. By
property type, the ratio is 12.7 per cent for detached homes, 18.9 per cent for townhomes, and
21.9 per cent for apartments.
Generally, analysts say that downward pressure on home prices occurs when the ratio dips below
12 per cent for a sustained period, while home prices often experience upward pressure when it
surpasses 20 per cent over several months.
“This is a more comfortable market for people on both sides of a real estate transaction,” said
Smith. “Home sale and listing activity were both at typical levels for our region in September.”
The MLS® Home Price Index composite benchmark price for all residential homes in Metro
Vancouver is currently $990,600. This represents a 7.3 per cent decrease over September 2018
and a 0.3 per cent decrease compared to August 2019.
Sales of detached homes in September 2019 reached 745, a 46.7 per cent increase from the 508
detached sales recorded in September 2018. The benchmark price for a detached home is
$1,406,200. This represents an 8.6 per cent decrease from September 2018 and is virtually
unchanged compared to August 2019.
Sales of apartment homes reached 1,166 in September 2019, a 43.6 per cent increase compared
to the 812 sales in September 2018. The benchmark price of an apartment property is $651,500.
This represents a 6.5 per cent decrease from September 2018 and a 0.4 per cent decrease
compared to August 2019.
Attached home sales in September 2019 totalled 422, a 53.5 per cent increase compared to the
275 sales in September 2018. The benchmark price of an attached home is $767,500. This
represents a 7.2 per cent decrease from September 2018 and a 0.6 per cent decrease compared to
August 2019.
*Editor’s Note: Areas covered by the Real Estate Board of Greater Vancouver include: Burnaby, Coquitlam, Maple
Ridge, New Westminster, North Vancouver, Pitt Meadows, Port Coquitlam, Port Moody, Richmond, South Delta,
Squamish, Sunshine Coast, Vancouver, West Vancouver, and Whistler.
-30-
The real estate industry is a key economic driver in British Columbia. In 2018, 24,619 homes changed ownership in
the Board’s area, generating $1.7 billion in economic spin-off activity and an estimated 11,720 jobs. The total dollar
value of residential sales transacted through the MLS® system in Greater Vancouver totalled $26 billion in 2018.
The Real Estate Board of Greater Vancouver is an association representing more than 14,000 REALTORS® and
their companies. The Board provides a variety of member services, including the Multiple Listing Service®. For
more information on real estate, statistics, and buying or selling a home, contact a local REALTOR® or visit
www.rebgv.org.
For more information contact:
Mark Moldowan
Senior Writer / Communication Strategist
Real Estate Board of Greater Vancouver
604.730.3153
mmoldowan@rebgv.org
Property Type Area
Benchmark
Price
Price
Index
1 Month
Change %
3 Month
Change %
6 Month
Change %
1 Year
Change %
3 Year
Change %
5 Year
Change %
10 Year
Change %
Residential / Composite Lower Mainland $938,500 258.3 -0.4% -0.9% -1.9% -6.4% 9.4% 60.1% 85.0%
Greater Vancouver $990,600 257.7 -0.3% -0.8% -2.2% -7.3% 4.8% 53.3% 81.2%
Bowen Island $975,500 211.5 2.2% -0.1% -1.2% 0.1% 22.5% 65.6% 61.6%
Burnaby East $920,800 255.4 0.6% -1.5% -2.0% -8.4% 4.9% 52.4% 81.3%
Burnaby North $849,800 256.6 -1.5% -2.6% -2.3% -8.5% 8.3% 56.5% 82.1%
Burnaby South $941,000 265.8 0.2% -1.7% -4.1% -8.0% 8.1% 56.4% 87.6%
Coquitlam $887,300 263.2 -0.6% -0.3% -1.9% -7.6% 12.3% 64.9% 95.7%
Ladner $775,800 218.4 -0.8% -3.1% -3.6% -10.8% -8.4% 40.5% 60.5%
Maple Ridge $744,900 237.2 -0.8% -1.8% -1.0% -5.8% 19.4% 73.1% 81.2%
New Westminster $640,100 281.6 0.5% -1.8% -1.2% -7.4% 21.3% 70.8% 95.1%
North Vancouver $1,013,200 227.7 -1.3% -2.2% -2.9% -7.4% -0.6% 46.5% 67.9%
Pitt Meadows $731,200 265.8 -1.1% -2.7% -2.5% -6.5% 24.6% 79.1% 95.7%
Port Coquitlam $724,200 247.9 -0.6% -2.6% -2.8% -6.2% 15.0% 65.9% 79.8%
Port Moody $899,800 248.7 -0.5% -0.4% -0.6% -6.1% 15.6% 65.8% 87.6%
Richmond $905,500 269.2 0.1% -0.6% -2.7% -9.5% 3.9% 53.8% 84.6%
Squamish $776,900 247.2 -0.7% 1.4% 2.8% 2.7% 22.0% 83.4% 97.1%
Sunshine Coast $600,300 210.3 1.7% -0.8% -1.6% -0.5% 24.6% 69.2% 61.0%
Tsawwassen $902,900 226.3 -2.0% -3.1% -3.3% -11.3% -8.9% 45.2% 67.4%
Vancouver East $1,033,400 303.4 0.0% -0.6% -3.2% -8.1% 0.1% 52.9% 97.5%
Vancouver West $1,225,200 255.3 -0.1% 0.7% -2.3% -7.5% -2.7% 40.7% 72.0%
West Vancouver $2,073,500 228.3 -1.0% -1.5% -2.6% -10.4% -23.9% 25.2% 71.4%
Whistler $916,100 213.5 -0.4% 2.5% 4.8% 4.5% 30.5% 82.8% 72.7%
Single Family Detached Lower Mainland $1,209,100 256.4 -0.2% -1.2% -2.0% -6.6% -3.9% 50.4% 88.1%
Greater Vancouver $1,406,200 258.7 0.0% -1.2% -2.4% -8.6% -10.6% 41.3% 84.5%
Bowen Island $975,500 211.5 2.2% -0.1% -1.2% 0.1% 22.5% 65.6% 61.6%
Burnaby East $1,160,500 259.5 -0.5% -1.7% 0.5% -7.0% -5.5% 48.5% 86.0%
Burnaby North $1,345,000 260.1 -2.2% -3.9% -4.7% -10.2% -14.0% 37.8% 83.7%
Burnaby South $1,458,500 279.2 -0.6% -2.5% -5.6% -8.2% -13.7% 41.7% 100.0%
Coquitlam $1,157,100 256.8 0.0% -0.8% -0.4% -10.0% -4.4% 51.6% 91.4%
Ladner $936,700 225.8 -0.2% -2.4% -1.9% -6.9% -12.0% 44.8% 70.4%
Maple Ridge $808,000 230.2 -1.2% -2.0% -0.7% -6.5% 12.6% 68.9% 81.5%
New Westminster $1,025,800 255.9 -0.7% -2.4% -1.2% -8.2% -4.4% 47.9% 82.0%
North Vancouver $1,463,200 230.4 -0.8% -4.0% -3.4% -7.5% -12.6% 41.4% 72.2%
Pitt Meadows $875,100 246.6 -1.8% -3.2% -4.1% -5.7% 10.3% 69.0% 84.7%
Port Coquitlam $908,700 242.3 0.0% -1.6% -1.3% -7.7% 2.1% 53.9% 80.0%
Port Moody $1,407,900 260.0 -0.9% -1.4% 0.4% -6.4% 1.9% 56.4% 94.8%
Richmond $1,476,800 286.1 1.2% -0.5% -4.5% -11.2% -14.6% 42.6% 91.9%
Squamish $975,200 257.0 -2.1% 2.2% 3.3% 5.2% 18.0% 82.4% 96.6%
Sunshine Coast $594,900 208.4 1.8% -0.7% -1.6% -0.9% 24.0% 68.3% 59.7%
Tsawwassen $1,135,000 244.4 -2.4% -3.1% -2.2% -10.4% -10.6% 50.6% 83.1%
Vancouver East $1,358,700 302.2 0.9% 0.6% -2.2% -9.2% -12.0% 42.9% 107.3%
Vancouver West $2,894,400 296.8 0.5% -0.6% -4.4% -10.8% -20.0% 25.9% 89.9%
West Vancouver $2,520,100 237.9 0.0% -1.7% -2.5% -9.3% -26.5% 24.3% 79.1%
Whistler $1,644,800 228.8 0.3% 4.4% 7.6% 9.5% 18.9% 72.4% 73.3%
HOW TO READ THE TABLE:
• Benchmark Price: Estimated sale price of a benchmark property. Benchmarks represent a typical property within each market.
• Price Index: Index numbers estimate the percentage change in price on typical and constant quality properties over time. All figures are based on past sales.
• x Month/Year Change %: Percentage change of index over a period of x month(s)/year(s) *
In January 2005, the indexes are set to 100.
Townhome properties are similar to Attached properties, a category that was used in the previous MLSLink HPI, but do not included duplexes.
The above info is deemed reliable, but is not guaranteed. All dollar amounts in CDN.
September 2019*
* MLS®, Multiple Listing Service®, and all related graphics are trademarks of The Canadian Real Estate Association 1 of 15
Property Type Area
Benchmark
Price
Price
Index
1 Month
Change %
3 Month
Change %
6 Month
Change %
1 Year
Change %
3 Year
Change %
5 Year
Change %
10 Year
Change %
September 2019*
Townhouse Lower Mainland $663,000 238.9 -0.4% -1.0% -0.1% -6.1% 16.8% 62.0% 75.8%
Greater Vancouver $767,500 246.3 -0.6% -0.9% -0.6% -7.2% 13.3% 56.6% 77.7%
Burnaby East $645,900 238.6 0.2% 0.3% -3.8% -10.1% 24.1% 51.9% 70.9%
Burnaby North $729,500 272.3 1.1% 0.6% 0.5% -5.1% 20.8% 63.0% 89.8%
Burnaby South $757,100 260.8 -1.3% -0.7% -2.9% -8.0% 15.4% 56.5% 81.1%
Coquitlam $651,300 239.0 -0.1% -0.9% 2.0% -5.1% 18.2% 60.8% 80.7%
Ladner $607,900 216.2 -1.7% -4.8% -6.7% -18.1% -1.8% 32.6% 49.5%
Maple Ridge $522,800 242.7 0.0% -1.3% -2.1% -6.4% 24.1% 76.3% 80.0%
New Westminster $706,200 259.0 -1.0% -2.1% -3.0% -9.9% 19.6% 54.5% 82.9%
North Vancouver $937,100 227.7 -2.4% -1.0% -1.6% -8.3% 4.0% 51.8% 68.5%
Pitt Meadows $595,300 257.6 -0.7% -2.3% -2.4% -9.4% 25.4% 80.6% 95.4%
Port Coquitlam $623,100 235.9 -0.7% -3.0% 1.5% -5.6% 14.4% 62.4% 73.1%
Port Moody $634,700 214.5 -3.2% -3.0% -0.2% -6.1% 16.3% 51.0% 60.7%
Richmond $767,300 251.9 -1.0% -1.5% -2.3% -11.1% 7.6% 49.9% 78.4%
Squamish $720,500 236.9 2.1% 5.2% 6.8% -0.9% 23.6% 83.1% 97.7%
Tsawwassen $590,400 232.4 -1.2% -4.5% -6.6% -16.4% 4.3% 43.5% 60.7%
Vancouver East $843,400 270.2 0.6% -2.1% -2.1% -4.3% 8.7% 49.1% 82.9%
Vancouver West $1,098,900 256.9 -1.5% -2.4% -0.9% -6.1% 4.4% 48.4% 80.0%
Whistler $948,100 228.6 1.1% 7.6% 8.0% -0.3% 32.3% 91.1% 90.8%
Apartment Lower Mainland $638,800 268.6 -0.5% -0.7% -2.4% -6.4% 28.1% 73.0% 84.6%
Greater Vancouver $651,500 260.4 -0.4% -0.5% -2.4% -6.5% 21.9% 65.6% 79.2%
Burnaby East $713,900 273.9 1.9% -3.0% -1.2% -7.0% 18.7% 60.9% 82.5%
Burnaby North $591,400 252.5 -1.7% -2.7% -1.9% -8.2% 28.0% 71.3% 80.6%
Burnaby South $654,500 262.8 0.9% -1.8% -3.9% -7.8% 23.1% 67.7% 84.8%
Coquitlam $518,200 284.4 -1.1% 0.7% -0.9% -3.6% 40.0% 90.1% 109.1%
Ladner $422,000 200.0 -1.1% -2.4% -2.4% -10.3% 3.2% 36.3% 43.2%
Maple Ridge $348,500 248.8 -0.9% -1.9% -1.2% -4.3% 39.2% 78.0% 71.8%
New Westminster $511,000 289.5 0.9% -1.7% -1.1% -7.3% 30.9% 79.4% 98.6%
North Vancouver $546,500 222.9 -1.7% -1.1% -3.1% -7.6% 17.7% 52.7% 62.1%
Pitt Meadows $487,200 287.3 -0.6% -2.2% -1.1% -6.3% 39.1% 86.0% 98.4%
Port Coquitlam $433,600 259.3 -1.1% -2.9% -5.7% -5.2% 30.6% 82.7% 81.2%
Port Moody $627,000 261.3 0.8% 1.2% -1.3% -5.9% 30.6% 83.2% 98.6%
Richmond $627,100 268.5 0.1% -0.2% -1.6% -7.3% 32.4% 72.9% 83.7%
Squamish $491,600 242.3 -1.9% -4.0% -2.3% 3.1% 33.6% 102.6% 99.6%
Tsawwassen $450,600 190.0 -1.1% -2.1% -3.1% -10.1% 5.8% 40.9% 36.0%
Vancouver East $548,300 312.9 -0.7% -1.0% -4.3% -7.9% 17.2% 67.7% 88.3%
Vancouver West $754,800 244.9 -0.2% 1.4% -1.9% -6.1% 9.8% 52.4% 67.1%
West Vancouver $1,021,200 207.5 -3.8% -1.3% -3.1% -11.2% 5.7% 43.3% 54.9%
Whistler $492,400 192.9 -2.3% -2.9% 0.4% 5.4% 38.8% 89.3% 58.9%
HOW TO READ THE TABLE:
• Benchmark Price: Estimated sale price of a benchmark property. Benchmarks represent a typical property within each market.
• Price Index: Index numbers estimate the percentage change in price on typical and constant quality properties over time. All figures are based on past sales.
• x Month/Year Change %: Percentage change of index over a period of x month(s)/year(s)
In January 2005, the indexes are set to 100. *
Townhome properties are similar to attached properties, a category that was used in the previous MLSLink HPI, but do not included duplexes.
Lower Mainland includes areas serviced by both Real Estate Board of Greater Vancouver & Fraser Valley Real Estate Board.
The above info is deemed reliable, but is not guaranteed. All dollar amounts in CDN.
* MLS®, Multiple Listing Service®, and all related graphics are trademarks of The Canadian Real Estate Association 2 of 15
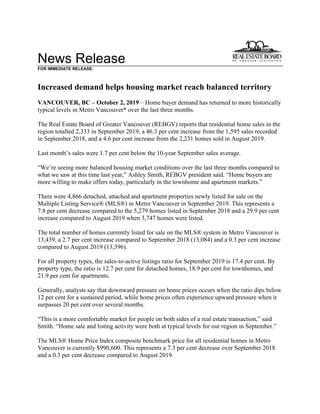
C:DATAMonthEndHpiexporthi_resgv-hpi2.tifGreaterVancouver
5YearTrend
60
110
160
210
260
310
Sep 2014
Nov 2014
Jan 2015
Mar 2015
May 2015
Jul 2015
Sep 2015
Nov 2015
Jan 2016
Mar 2016
May 2016
Jul 2016
Sep 2016
Nov 2016
Jan 2017
Mar 2017
May 2017
Jul 2017
Sep 2017
Nov 2017
Jan 2018
Mar 2018
May 2018
Jul 2018
Sep 2018
Nov 2018
Jan 2019
Mar 2019
May 2019
Jul 2019
Sep 2019
Price
Index
ResidentialDetachedTownhouseApartment
Jan2005HPI=100
9262019MLS®
SALESFacts
Burnaby
Coquitlam
Delta-South
Islands-Gulf
MapleRidge/PittMeadows
NewWestminster
NorthVancouver
PortCoquitlam
PortMoody/Belcarra
Richmond
Squamish
SunshineCoast
VancouverEast
VancouverWest
WestVancouver/HoweSound
Whistler/Pemberton
Detached63802679622591813722246109613516745
Attached5146100549242211771753739218422
Apartment1658718037798338241346714730312261,166
Detached$1,400,000$1,161,500$959,500n/a$830,000$1,154,834$1,598,000n/an/a$1,497,500$1,026,500$640,000$1,400,000$2,480,000$2,325,000n/a
Attached$775,000$798,900n/an/a$529,500n/a$941,500$677,500n/a$763,000n/an/a$992,500$1,338,000n/an/an/a
Apartment$590,000$524,800n/an/a$342,500$475,000$605,000$428,500$587,250$546,000n/an/a$561,500$789,000n/a$670,000
Detached6278322901464311267204973604012706
Attached6439120448321811561563749117409
Apartment160811903675883016127551243148281,116
Detached$1,457,500$1,200,000$1,045,000n/a$863,500n/a$1,497,500$920,000n/a$1,475,000$941,000$645,000$1,390,000$2,815,000$2,500,000n/a
Attached$749,000$749,000n/an/a$522,500n/a$950,000n/an/a$743,250n/an/a$1,118,000$1,280,000n/an/an/a
Apartment$595,000$496,450n/an/a$370,000$495,000$632,000$390,000n/a$557,500n/an/a$532,500$756,000n/a$509,500
Detached394924646144123962113772382512508
Attached36261402632114836352733221275
Apartment100551703064563517968395208721812
Detached$1,747,500$1,230,000$1,025,000n/a$810,000n/a$1,690,000$1,025,000n/a$1,539,989n/a$660,000$1,550,000$2,900,000$2,750,000n/a
Attached$784,000$887,950n/an/a$548,050n/a$1,020,000n/an/a$882,500n/an/a$950,000$1,332,000n/a$1,152,000n/a
Apartment$582,500$549,000n/an/a$383,500$509,000$597,000$450,000n/a$556,000n/an/a$592,000$790,000n/a$456,500
Detached47457325739710153581215108557155371712550308905,853
Attached4133181081413692611849844312651325365241393,338
Apartment1,189652134029465669726919799781619652,329861818,788
Detached$1,420,000$1,195,000$1,000,000$566,000$825,000$1,105,000$1,550,000$915,000$1,210,050$1,460,000$985,000$625,000$1,380,000$2,800,000$2,404,000$1,801,650
Attached$750,000$768,900$683,000n/a$525,000$710,000$985,000$653,500$737,000$782,750$656,750$449,000$990,000$1,260,000$1,687,500$955,000n/a
Apartment$578,000$516,500$489,500n/a$355,000$495,000$615,000$411,000$557,500$530,000$458,000$424,900$558,000$748,400$1,000,000$485,000
Detached47056429342778181525252926231534217435452521076,041
Attached4172718813599327118211856612470322378371943,491
Apartment1,21373814104717527703502141,364121461,1502,73414123610,441
Detached$1,604,000$1,315,000$1,115,000$457,500$876,900$1,245,000$1,683,000$1,003,750$1,422,500$1,690,000$999,500$660,000$1,599,000$3,091,500$2,800,000$1,925,000
Attached$790,000$812,500$743,700n/a$560,000$765,344$992,000$696,000$760,000$870,000$688,000$445,000$1,072,500$1,389,000$1,600,000$1,099,500n/a
Apartment$600,000$550,000$542,500n/a$393,100$510,400$659,950$445,000$599,000$580,000$447,000$399,450$615,900$820,000$1,205,000$406,000
Note:MedianSellingPricesarenotreportedforareaswithlessthan20salesorfortheGulfIslands
Number
of
Sales
September
2019
Number
of
Sales
Median
Selling
Price
Number
of
Sales
Median
Selling
Price
Number
of
Sales
Median
Selling
Price
August
2019
September
2018
Jan.-
Sep.2019
Jan.-
Sep.2018
Median
Selling
Price
Number
of
Sales
Median
Selling
Price
September
2019
Year-to-date
Year-to-date
9262019MLS®
LISTINGSFacts
Burnaby
Coquitlam
Delta-South
Islands-Gulf
MapleRidge/PittMeadows
NewWestminster
NorthVancouver
PortCoquitlam
PortMoody/Belcarra
Richmond
Squamish
SunshineCoast
VancouverEast
VancouverWest
WestVancouver/HoweSound
Whistler/Pemberton
Detached14115476102124417244281953556174182166231,712
Attached10672180693583342512930191071181632893
Apartment28715540048134184623922926829368244302,261
Detached45%52%34%70%45%50%34%41%46%37%63%82%63%34%21%70%
Attached48%64%56%n/a78%26%29%65%44%60%57%26%35%33%13%56%n/a
Apartment57%56%45%n/a77%59%45%61%62%59%23%88%50%44%27%87%
Detached108144647130309236291522974150126107241,302
Attached105612205615493419123181945661436682
Apartment298137520511151194625238151516144414331,763
Detached57%54%50%29%69%47%70%86%41%44%69%66%49%48%37%50%
Attached61%64%55%n/a79%53%65%53%58%46%83%32%82%74%7%47%n/a
Apartment54%59%37%n/a71%65%74%65%64%53%33%33%77%71%57%85%
Detached1721919431654624059442453666223211162201,977
Attached107803408914694821117266881361930884
Apartment25918033169174226575028314529668256332,418
Detached23%26%26%200%28%30%17%39%20%25%31%56%32%18%15%60%
Attached34%33%41%n/a29%21%30%29%38%31%12%83%31%24%11%70%n/a
Apartment39%31%52%0%43%37%25%61%34%34%57%60%32%30%13%64%
Detached1,3171,495747761,6323721,3574543011,9273088391,7011,7241,24921215,711
Attached99668922556831776263782161,2792161406761,0371272817,751
Apartment2,5601,39231205541,3351,6455663202,4341851432,0265,68534230819,807
Detached36%38%34%51%44%41%43%47%36%29%50%44%42%32%25%42%
Attached41%46%48%20%60%39%42%49%45%35%58%36%48%35%19%49%n/a
Apartment46%47%43%n/a53%49%42%48%62%41%44%43%48%41%25%59%
Detached1,5611,574795941,5543851,5865792912,2483728502,1272,1051,39520917,725
Attached852597165166321645273692011,1522171047029991313077,135
Apartment2,1751,37224017051,2311,3785273672,471206722,1245,47834232419,013
Detached30%36%37%45%50%47%33%44%32%28%41%50%35%26%18%51%
Attached49%45%53%6%57%57%51%49%59%49%57%67%46%38%28%63%n/a
Apartment56%54%59%0%67%61%56%66%58%55%59%64%54%50%41%73%
*Year-to-datelistingsrepresentacumulativetotaloflistingsratherthantotalactivelistings.
%Salesto
Listings
Number
of
Listings
%Salesto
Listings
August
2019
September
2018
Jan.-
Sep.2019
Jan.-
Sep.2018
%Salesto
Listings
Number
of
Listings
%Salesto
Listings
Number
of
Listings
September
2019
Number
of
Listings
%Salesto
Listings
Number
of
Listings
September
2019
Year-to-date*
Year-to-date*
Listing & Sales Activity Summary
Listings Sales
1 2 3 Col. 2 & 3 5 6 7 Col. 6 & 7 9 10 Col. 9 & 10
Sep Aug Sep Percentage Sep Aug Sep Percentage Jul 2018 - Jul 2019 - Percentage
2018 2019 2019 Variance 2018 2019 2019 Variance Sep 2018 Sep 2019 Variance
BURNABY % % %
DETACHED 172 108 141 30.6 39 62 63 1.6 124 202 62.9
ATTACHED 107 105 106 1.0 36 64 51 -20.3 102 172 68.6
APARTMENTS 259 298 287 -3.7 100 160 165 3.1 329 489 48.6
COQUITLAM
DETACHED 191 144 154 6.9 49 78 80 2.6 157 244 55.4
ATTACHED 80 61 72 18.0 26 39 46 17.9 97 141 45.4
APARTMENTS 180 137 155 13.1 55 81 87 7.4 208 262 26.0
DELTA
DETACHED 94 64 76 18.8 24 32 26 -18.8 87 99 13.8
ATTACHED 34 22 18 -18.2 14 12 10 -16.7 28 38 35.7
APARTMENTS 33 52 40 -23.1 17 19 18 -5.3 40 60 50.0
MAPLE RIDGE/PITT MEADOWS
DETACHED 165 130 212 63.1 46 90 96 6.7 199 286 43.7
ATTACHED 89 56 69 23.2 26 44 54 22.7 104 156 50.0
APARTMENTS 69 51 48 -5.9 30 36 37 2.8 98 115 17.3
NORTH VANCOUVER
DETACHED 240 92 172 87.0 41 64 59 -7.8 123 199 61.8
ATTACHED 69 49 83 69.4 21 32 24 -25.0 75 88 17.3
APARTMENTS 226 119 184 54.6 56 88 83 -5.7 201 267 32.8
NEW WESTMINSTER
DETACHED 46 30 44 46.7 14 14 22 57.1 49 53 8.2
ATTACHED 14 15 35 133.3 3 8 9 12.5 18 26 44.4
APARTMENTS 174 115 134 16.5 64 75 79 5.3 213 249 16.9
PORT MOODY/BELCARRA
DETACHED 44 29 28 -3.4 9 12 13 8.3 26 36 38.5
ATTACHED 21 19 25 31.6 8 11 11 0.0 28 38 35.7
APARTMENTS 50 25 39 56.0 17 16 24 50.0 60 69 15.0
PORT COQUITLAM
DETACHED 59 36 44 22.2 23 31 18 -41.9 63 80 27.0
ATTACHED 48 34 34 0.0 14 18 22 22.2 53 65 22.6
APARTMENTS 57 46 62 34.8 35 30 38 26.7 112 97 -13.4
RICHMOND
DETACHED 245 152 195 28.3 62 67 72 7.5 194 224 15.5
ATTACHED 117 123 129 4.9 36 56 77 37.5 150 200 33.3
APARTMENTS 283 238 229 -3.8 96 127 134 5.5 399 408 2.3
SUNSHINE COAST
DETACHED 66 74 56 -24.3 37 49 46 -6.1 145 158 9.0
ATTACHED 6 19 19 0.0 5 6 5 -16.7 18 18 0.0
APARTMENTS 5 15 8 -46.7 3 5 7 40.0 6 18 200.0
SQUAMISH
DETACHED 36 29 35 20.7 11 20 22 10.0 54 55 1.9
ATTACHED 26 18 30 66.7 3 15 17 13.3 29 44 51.7
APARTMENTS 14 15 26 73.3 8 5 6 20.0 38 22 -42.1
VANCOUVER EAST
DETACHED 223 150 174 16.0 72 73 109 49.3 197 286 45.2
ATTACHED 88 45 107 137.8 27 37 37 0.0 78 116 48.7
APARTMENTS 296 161 293 82.0 95 124 147 18.5 337 399 18.4
VANCOUVER WEST
DETACHED 211 126 182 44.4 38 60 61 1.7 154 200 29.9
ATTACHED 136 66 118 78.8 33 49 39 -20.4 119 146 22.7
APARTMENTS 682 444 682 53.6 208 314 303 -3.5 777 969 24.7
WHISTLER/PEMBERTON
DETACHED 20 24 23 -4.2 12 12 16 33.3 35 36 2.9
ATTACHED 30 36 32 -11.1 21 17 18 5.9 55 50 -9.1
APARTMENTS 33 33 30 -9.1 21 28 26 -7.1 59 68 15.3
WEST VANCOUVER/HOWE SOUND
DETACHED 162 107 166 55.1 25 40 35 -12.5 84 118 40.5
ATTACHED 19 14 16 14.3 2 1 2 100.0 12 6 -50.0
APARTMENTS 56 14 44 214.3 7 8 12 50.0 39 33 -15.4
GRAND TOTALS
DETACHED 1974 1295 1702 31.4 502 704 738 4.8 1691 2276 34.6
ATTACHED 884 682 893 30.9 275 409 422 3.2 966 1304 35.0
APARTMENTS 2417 1763 2261 28.2 812 1116 1166 4.5 2916 3525 20.9
ResidentialAverageSalePrices-January1977toSeptember2019
0
200
400
600
800
1000
1200
1400
1600
1800
2000
1977
1978
1979
1980
1981
1982
1983
1984
1985
1986
1987
1988
1989
1990
1991
1992
1993
1994
1995
1996
1997
1998
1999
2000
2001
2002
2003
2004
2005
2006
2007
2008
2009
2010
2011
2012
2013
2014
2015
2016
2017
2018
2019
DETACHEDCONDOMINIUMATTACHEDAPARTMENTS
INTHOUSANDS($)
NOTE:From1977-1984condominiumaverageswerenotseparatedintoattached&apartment.
$843,630
$673,392
$1,505,919

More Related Content

What's hot

2021 June - REBGV Statistics Package
2021 June - REBGV Statistics Package2021 June - REBGV Statistics Package
2021 June - REBGV Statistics PackageVicky Aulakh
 
Rebgv stats-pkg-june-2019
Rebgv stats-pkg-june-2019Rebgv stats-pkg-june-2019
Rebgv stats-pkg-june-2019Vicky Aulakh
 
REBGV Statistic Package December 2020
REBGV Statistic Package December 2020REBGV Statistic Package December 2020
REBGV Statistic Package December 2020Vicky Aulakh
 
REBGV Statistics Package June 2020
REBGV Statistics Package June 2020REBGV Statistics Package June 2020
REBGV Statistics Package June 2020Vicky Aulakh
 
REBGV Statistics Package May 2020
REBGV Statistics Package May 2020REBGV Statistics Package May 2020
REBGV Statistics Package May 2020Vicky Aulakh
 
Metro Vancouver Statistics September 2021
Metro Vancouver Statistics September 2021 Metro Vancouver Statistics September 2021
Metro Vancouver Statistics September 2021 VickyAulakh1
 
Metro Vancouver Statistics Report October 2021
Metro Vancouver Statistics Report October 2021Metro Vancouver Statistics Report October 2021
Metro Vancouver Statistics Report October 2021VickyAulakh1
 
Rebgv stats-pkg-august-2019
Rebgv stats-pkg-august-2019Rebgv stats-pkg-august-2019
Rebgv stats-pkg-august-2019Vicky Aulakh
 
REBGV Statistics Package August 2020
REBGV Statistics Package August 2020REBGV Statistics Package August 2020
REBGV Statistics Package August 2020Vicky Aulakh
 
Real Estate Board of Greater Vancouver Statistics Package March 2021
Real Estate Board of Greater Vancouver Statistics Package March 2021Real Estate Board of Greater Vancouver Statistics Package March 2021
Real Estate Board of Greater Vancouver Statistics Package March 2021Vicky Aulakh
 
Rebgv Stats Package September 2020
Rebgv Stats Package September 2020Rebgv Stats Package September 2020
Rebgv Stats Package September 2020Vicky Aulakh
 
Rebgv stats-pkg-october-2018 .pdf
Rebgv stats-pkg-october-2018 .pdf Rebgv stats-pkg-october-2018 .pdf
Rebgv stats-pkg-october-2018 .pdf Kathryn Huang
 
Real Estate Board of Greater Vancouver Statistics Package August 2021
Real Estate Board of Greater Vancouver Statistics Package August 2021Real Estate Board of Greater Vancouver Statistics Package August 2021
Real Estate Board of Greater Vancouver Statistics Package August 2021Vicky Aulakh
 
VREB October 2020 Statistics Package
VREB October 2020 Statistics PackageVREB October 2020 Statistics Package
VREB October 2020 Statistics PackageVicky Aulakh
 
REBGV Stats Package February 2021
REBGV Stats Package February 2021REBGV Stats Package February 2021
REBGV Stats Package February 2021Vicky Aulakh
 
Rebgv stats-pkg-may-2019
Rebgv stats-pkg-may-2019Rebgv stats-pkg-may-2019
Rebgv stats-pkg-may-2019Kathryn Huang
 
Real Estate Board of Greater Vancouver Statistics Package July 2021
Real Estate Board of Greater Vancouver Statistics Package July 2021Real Estate Board of Greater Vancouver Statistics Package July 2021
Real Estate Board of Greater Vancouver Statistics Package July 2021Vicky Aulakh
 
Rebgv stats-pkg-february-2019
Rebgv stats-pkg-february-2019Rebgv stats-pkg-february-2019
Rebgv stats-pkg-february-2019Kathryn Huang
 
Rebgv stats-pkg-february-2020
Rebgv stats-pkg-february-2020Rebgv stats-pkg-february-2020
Rebgv stats-pkg-february-2020Vicky Aulakh
 
Real Estate Board of Greater Vancouver Statistics Package - November 2021
Real Estate Board of Greater Vancouver Statistics Package - November 2021Real Estate Board of Greater Vancouver Statistics Package - November 2021
Real Estate Board of Greater Vancouver Statistics Package - November 2021VickyAulakh1
 

What's hot (20)

2021 June - REBGV Statistics Package
2021 June - REBGV Statistics Package2021 June - REBGV Statistics Package
2021 June - REBGV Statistics Package
 
Rebgv stats-pkg-june-2019
Rebgv stats-pkg-june-2019Rebgv stats-pkg-june-2019
Rebgv stats-pkg-june-2019
 
REBGV Statistic Package December 2020
REBGV Statistic Package December 2020REBGV Statistic Package December 2020
REBGV Statistic Package December 2020
 
REBGV Statistics Package June 2020
REBGV Statistics Package June 2020REBGV Statistics Package June 2020
REBGV Statistics Package June 2020
 
REBGV Statistics Package May 2020
REBGV Statistics Package May 2020REBGV Statistics Package May 2020
REBGV Statistics Package May 2020
 
Metro Vancouver Statistics September 2021
Metro Vancouver Statistics September 2021 Metro Vancouver Statistics September 2021
Metro Vancouver Statistics September 2021
 
Metro Vancouver Statistics Report October 2021
Metro Vancouver Statistics Report October 2021Metro Vancouver Statistics Report October 2021
Metro Vancouver Statistics Report October 2021
 
Rebgv stats-pkg-august-2019
Rebgv stats-pkg-august-2019Rebgv stats-pkg-august-2019
Rebgv stats-pkg-august-2019
 
REBGV Statistics Package August 2020
REBGV Statistics Package August 2020REBGV Statistics Package August 2020
REBGV Statistics Package August 2020
 
Real Estate Board of Greater Vancouver Statistics Package March 2021
Real Estate Board of Greater Vancouver Statistics Package March 2021Real Estate Board of Greater Vancouver Statistics Package March 2021
Real Estate Board of Greater Vancouver Statistics Package March 2021
 
Rebgv Stats Package September 2020
Rebgv Stats Package September 2020Rebgv Stats Package September 2020
Rebgv Stats Package September 2020
 
Rebgv stats-pkg-october-2018 .pdf
Rebgv stats-pkg-october-2018 .pdf Rebgv stats-pkg-october-2018 .pdf
Rebgv stats-pkg-october-2018 .pdf
 
Real Estate Board of Greater Vancouver Statistics Package August 2021
Real Estate Board of Greater Vancouver Statistics Package August 2021Real Estate Board of Greater Vancouver Statistics Package August 2021
Real Estate Board of Greater Vancouver Statistics Package August 2021
 
VREB October 2020 Statistics Package
VREB October 2020 Statistics PackageVREB October 2020 Statistics Package
VREB October 2020 Statistics Package
 
REBGV Stats Package February 2021
REBGV Stats Package February 2021REBGV Stats Package February 2021
REBGV Stats Package February 2021
 
Rebgv stats-pkg-may-2019
Rebgv stats-pkg-may-2019Rebgv stats-pkg-may-2019
Rebgv stats-pkg-may-2019
 
Real Estate Board of Greater Vancouver Statistics Package July 2021
Real Estate Board of Greater Vancouver Statistics Package July 2021Real Estate Board of Greater Vancouver Statistics Package July 2021
Real Estate Board of Greater Vancouver Statistics Package July 2021
 
Rebgv stats-pkg-february-2019
Rebgv stats-pkg-february-2019Rebgv stats-pkg-february-2019
Rebgv stats-pkg-february-2019
 
Rebgv stats-pkg-february-2020
Rebgv stats-pkg-february-2020Rebgv stats-pkg-february-2020
Rebgv stats-pkg-february-2020
 
Real Estate Board of Greater Vancouver Statistics Package - November 2021
Real Estate Board of Greater Vancouver Statistics Package - November 2021Real Estate Board of Greater Vancouver Statistics Package - November 2021
Real Estate Board of Greater Vancouver Statistics Package - November 2021
 

Similar to Rebgv stats-pkg-september-2019

Rebgv stats-pkg-october-2019
Rebgv stats-pkg-october-2019Rebgv stats-pkg-october-2019
Rebgv stats-pkg-october-2019Vicky Aulakh
 
Rebgv stats-pkg-august-2018
Rebgv stats-pkg-august-2018Rebgv stats-pkg-august-2018
Rebgv stats-pkg-august-2018Kathryn Huang
 
May-2019 Stats Package for Greater Vancouver
May-2019 Stats Package for Greater VancouverMay-2019 Stats Package for Greater Vancouver
May-2019 Stats Package for Greater VancouverBC PRIME Realty
 
August 2017 REBGV Stats Mike Stewart Realtor
August 2017 REBGV Stats Mike Stewart RealtorAugust 2017 REBGV Stats Mike Stewart Realtor
August 2017 REBGV Stats Mike Stewart RealtorMike Stewart
 
201807 rebgv-stats-package-for-media
201807 rebgv-stats-package-for-media201807 rebgv-stats-package-for-media
201807 rebgv-stats-package-for-mediaKathryn Huang
 
Rebgv stats-pkg-june-2018
Rebgv stats-pkg-june-2018Rebgv stats-pkg-june-2018
Rebgv stats-pkg-june-2018Kathryn Huang
 
Rebgv stats-pkg-january-2018 2
Rebgv stats-pkg-january-2018 2Rebgv stats-pkg-january-2018 2
Rebgv stats-pkg-january-2018 2Kathryn Huang
 
REBGV Statistics package July 2020
REBGV Statistics package July 2020REBGV Statistics package July 2020
REBGV Statistics package July 2020Vicky Aulakh
 
REBGV Statistics Package October 2020
REBGV Statistics Package October 2020REBGV Statistics Package October 2020
REBGV Statistics Package October 2020Vicky Aulakh
 
Rebgv stats-pkg-september-2018
Rebgv stats-pkg-september-2018Rebgv stats-pkg-september-2018
Rebgv stats-pkg-september-2018Kathryn Huang
 
Rebgv stats-pkg-april-2018
Rebgv stats-pkg-april-2018Rebgv stats-pkg-april-2018
Rebgv stats-pkg-april-2018Kathryn Huang
 
Rebgv stats-pkg-may-2018
Rebgv stats-pkg-may-2018Rebgv stats-pkg-may-2018
Rebgv stats-pkg-may-2018Kathryn Huang
 
July 2017 Real Estate Board of Greater Vancouver Stats Package Mike Stewart r...
July 2017 Real Estate Board of Greater Vancouver Stats Package Mike Stewart r...July 2017 Real Estate Board of Greater Vancouver Stats Package Mike Stewart r...
July 2017 Real Estate Board of Greater Vancouver Stats Package Mike Stewart r...Mike Stewart
 
REBGV STATS PACKAGE JULY 2017
REBGV STATS PACKAGE JULY 2017REBGV STATS PACKAGE JULY 2017
REBGV STATS PACKAGE JULY 2017Marcella Riccardi
 
Rebgv stats-pkg-march-2019
Rebgv stats-pkg-march-2019Rebgv stats-pkg-march-2019
Rebgv stats-pkg-march-2019Kathryn Huang
 
Rebgv stats-pkg-march-2019
Rebgv stats-pkg-march-2019Rebgv stats-pkg-march-2019
Rebgv stats-pkg-march-2019Sherryl Jacobs
 
November 2017 rebgv stats mike stewart real estate agent
November 2017 rebgv stats mike stewart real estate agentNovember 2017 rebgv stats mike stewart real estate agent
November 2017 rebgv stats mike stewart real estate agentMike Stewart
 
REBGV September 2016 Stats Package Mike Stewart Vancouver Realtor
REBGV September 2016 Stats Package Mike Stewart Vancouver RealtorREBGV September 2016 Stats Package Mike Stewart Vancouver Realtor
REBGV September 2016 Stats Package Mike Stewart Vancouver RealtorMike Stewart
 

Similar to Rebgv stats-pkg-september-2019 (20)

Rebgv stats-pkg-october-2019
Rebgv stats-pkg-october-2019Rebgv stats-pkg-october-2019
Rebgv stats-pkg-october-2019
 
Rebgv stats-pkg-august-2018
Rebgv stats-pkg-august-2018Rebgv stats-pkg-august-2018
Rebgv stats-pkg-august-2018
 
May-2019 Stats Package for Greater Vancouver
May-2019 Stats Package for Greater VancouverMay-2019 Stats Package for Greater Vancouver
May-2019 Stats Package for Greater Vancouver
 
August 2017 REBGV Stats Mike Stewart Realtor
August 2017 REBGV Stats Mike Stewart RealtorAugust 2017 REBGV Stats Mike Stewart Realtor
August 2017 REBGV Stats Mike Stewart Realtor
 
201807 rebgv-stats-package-for-media
201807 rebgv-stats-package-for-media201807 rebgv-stats-package-for-media
201807 rebgv-stats-package-for-media
 
Rebgv stats-pkg-june-2018
Rebgv stats-pkg-june-2018Rebgv stats-pkg-june-2018
Rebgv stats-pkg-june-2018
 
Rebgv stats-pkg-january-2018 2
Rebgv stats-pkg-january-2018 2Rebgv stats-pkg-january-2018 2
Rebgv stats-pkg-january-2018 2
 
REBGV Statistics package July 2020
REBGV Statistics package July 2020REBGV Statistics package July 2020
REBGV Statistics package July 2020
 
REBGV Statistics Package October 2020
REBGV Statistics Package October 2020REBGV Statistics Package October 2020
REBGV Statistics Package October 2020
 
Rebgv stats-pkg-october-2020
Rebgv stats-pkg-october-2020Rebgv stats-pkg-october-2020
Rebgv stats-pkg-october-2020
 
Rebgv stats-pkg-september-2018
Rebgv stats-pkg-september-2018Rebgv stats-pkg-september-2018
Rebgv stats-pkg-september-2018
 
Rebgv stats-pkg-april-2018
Rebgv stats-pkg-april-2018Rebgv stats-pkg-april-2018
Rebgv stats-pkg-april-2018
 
Rebgv stats-pkg-may-2018
Rebgv stats-pkg-may-2018Rebgv stats-pkg-may-2018
Rebgv stats-pkg-may-2018
 
July 2017 Real Estate Board of Greater Vancouver Stats Package Mike Stewart r...
July 2017 Real Estate Board of Greater Vancouver Stats Package Mike Stewart r...July 2017 Real Estate Board of Greater Vancouver Stats Package Mike Stewart r...
July 2017 Real Estate Board of Greater Vancouver Stats Package Mike Stewart r...
 
REBGV STATS PACKAGE JULY 2017
REBGV STATS PACKAGE JULY 2017REBGV STATS PACKAGE JULY 2017
REBGV STATS PACKAGE JULY 2017
 
Rebgv stats-pkg-march-2019
Rebgv stats-pkg-march-2019Rebgv stats-pkg-march-2019
Rebgv stats-pkg-march-2019
 
Rebgv stats-pkg-march-2019
Rebgv stats-pkg-march-2019Rebgv stats-pkg-march-2019
Rebgv stats-pkg-march-2019
 
November 2017 rebgv stats mike stewart real estate agent
November 2017 rebgv stats mike stewart real estate agentNovember 2017 rebgv stats mike stewart real estate agent
November 2017 rebgv stats mike stewart real estate agent
 
REBGV September 2016 Stats Package Mike Stewart Vancouver Realtor
REBGV September 2016 Stats Package Mike Stewart Vancouver RealtorREBGV September 2016 Stats Package Mike Stewart Vancouver Realtor
REBGV September 2016 Stats Package Mike Stewart Vancouver Realtor
 
Rebgv stats-pkg-november-2020
Rebgv stats-pkg-november-2020Rebgv stats-pkg-november-2020
Rebgv stats-pkg-november-2020
 

More from Vicky Aulakh

Okanagan Statistics May2023.pdf
Okanagan Statistics May2023.pdfOkanagan Statistics May2023.pdf
Okanagan Statistics May2023.pdfVicky Aulakh
 
FVREB May 2023 Statistics Package.pdf
FVREB May 2023 Statistics Package.pdfFVREB May 2023 Statistics Package.pdf
FVREB May 2023 Statistics Package.pdfVicky Aulakh
 
Metro Vancouver Stats.pdf
Metro Vancouver Stats.pdfMetro Vancouver Stats.pdf
Metro Vancouver Stats.pdfVicky Aulakh
 
FVREB July 2022
FVREB July 2022FVREB July 2022
FVREB July 2022Vicky Aulakh
 
REBGV-Stats-Pkg-July-2022
REBGV-Stats-Pkg-July-2022REBGV-Stats-Pkg-July-2022
REBGV-Stats-Pkg-July-2022Vicky Aulakh
 
VREB July 2022
VREB July 2022VREB July 2022
VREB July 2022Vicky Aulakh
 
BCRE June 2022
BCRE June 2022BCRE June 2022
BCRE June 2022Vicky Aulakh
 
Okanagan Stats June 2022
Okanagan Stats June 2022Okanagan Stats June 2022
Okanagan Stats June 2022Vicky Aulakh
 
Okanagan Stats May 2022
Okanagan Stats May 2022Okanagan Stats May 2022
Okanagan Stats May 2022Vicky Aulakh
 
VREB June 2022 Stats
VREB June 2022 StatsVREB June 2022 Stats
VREB June 2022 StatsVicky Aulakh
 
FVREB June 2022 Stats
FVREB June 2022 StatsFVREB June 2022 Stats
FVREB June 2022 StatsVicky Aulakh
 
FVREB May 2022
FVREB May 2022FVREB May 2022
FVREB May 2022Vicky Aulakh
 
REBGV Statistics Package May 2022
REBGV Statistics Package May 2022REBGV Statistics Package May 2022
REBGV Statistics Package May 2022Vicky Aulakh
 
VREB May 2022 Statistics Package.pdf
VREB May 2022 Statistics Package.pdfVREB May 2022 Statistics Package.pdf
VREB May 2022 Statistics Package.pdfVicky Aulakh
 
The Okanagan Real Estate April 2022 Statistics
The Okanagan Real Estate April 2022 StatisticsThe Okanagan Real Estate April 2022 Statistics
The Okanagan Real Estate April 2022 StatisticsVicky Aulakh
 
FVREB April 2022 Stats Package .pdf
FVREB April 2022 Stats Package .pdfFVREB April 2022 Stats Package .pdf
FVREB April 2022 Stats Package .pdfVicky Aulakh
 
VREB April 2022 Stats Package .pdf
VREB April 2022 Stats Package .pdfVREB April 2022 Stats Package .pdf
VREB April 2022 Stats Package .pdfVicky Aulakh
 
REBGV-Stats-Pkg-April-2022.pdf
REBGV-Stats-Pkg-April-2022.pdfREBGV-Stats-Pkg-April-2022.pdf
REBGV-Stats-Pkg-April-2022.pdfVicky Aulakh
 
March 2022 Okanagan Statistics
March 2022 Okanagan StatisticsMarch 2022 Okanagan Statistics
March 2022 Okanagan StatisticsVicky Aulakh
 

More from Vicky Aulakh (20)

Okanagan Statistics May2023.pdf
Okanagan Statistics May2023.pdfOkanagan Statistics May2023.pdf
Okanagan Statistics May2023.pdf
 
FVREB May 2023 Statistics Package.pdf
FVREB May 2023 Statistics Package.pdfFVREB May 2023 Statistics Package.pdf
FVREB May 2023 Statistics Package.pdf
 
Metro Vancouver Stats.pdf
Metro Vancouver Stats.pdfMetro Vancouver Stats.pdf
Metro Vancouver Stats.pdf
 
FVREB July 2022
FVREB July 2022FVREB July 2022
FVREB July 2022
 
REBGV-Stats-Pkg-July-2022
REBGV-Stats-Pkg-July-2022REBGV-Stats-Pkg-July-2022
REBGV-Stats-Pkg-July-2022
 
VREB July 2022
VREB July 2022VREB July 2022
VREB July 2022
 
BCRE June 2022
BCRE June 2022BCRE June 2022
BCRE June 2022
 
Okanagan Stats June 2022
Okanagan Stats June 2022Okanagan Stats June 2022
Okanagan Stats June 2022
 
Okanagan Stats May 2022
Okanagan Stats May 2022Okanagan Stats May 2022
Okanagan Stats May 2022
 
VREB June 2022 Stats
VREB June 2022 StatsVREB June 2022 Stats
VREB June 2022 Stats
 
FVREB June 2022 Stats
FVREB June 2022 StatsFVREB June 2022 Stats
FVREB June 2022 Stats
 
FVREB May 2022
FVREB May 2022FVREB May 2022
FVREB May 2022
 
REBGV Statistics Package May 2022
REBGV Statistics Package May 2022REBGV Statistics Package May 2022
REBGV Statistics Package May 2022
 
VREB May 2022 Statistics Package.pdf
VREB May 2022 Statistics Package.pdfVREB May 2022 Statistics Package.pdf
VREB May 2022 Statistics Package.pdf
 
The Okanagan Real Estate April 2022 Statistics
The Okanagan Real Estate April 2022 StatisticsThe Okanagan Real Estate April 2022 Statistics
The Okanagan Real Estate April 2022 Statistics
 
FVREB April 2022 Stats Package .pdf
FVREB April 2022 Stats Package .pdfFVREB April 2022 Stats Package .pdf
FVREB April 2022 Stats Package .pdf
 
VREB April 2022 Stats Package .pdf
VREB April 2022 Stats Package .pdfVREB April 2022 Stats Package .pdf
VREB April 2022 Stats Package .pdf
 
REBGV-Stats-Pkg-April-2022.pdf
REBGV-Stats-Pkg-April-2022.pdfREBGV-Stats-Pkg-April-2022.pdf
REBGV-Stats-Pkg-April-2022.pdf
 
BCREA.pdf
BCREA.pdfBCREA.pdf
BCREA.pdf
 
March 2022 Okanagan Statistics
March 2022 Okanagan StatisticsMarch 2022 Okanagan Statistics
March 2022 Okanagan Statistics
 

Recently uploaded

Low Rate Call Girls in Lajpat Nagar Delhi Call 9990771857
Low Rate Call Girls in Lajpat Nagar Delhi Call 9990771857Low Rate Call Girls in Lajpat Nagar Delhi Call 9990771857
Low Rate Call Girls in Lajpat Nagar Delhi Call 9990771857delhimodel235
 
9990771857 Call Girls in Noida Sector 34 Noida (Call Girls) Delhi
9990771857 Call Girls in Noida Sector 34 Noida (Call Girls) Delhi9990771857 Call Girls in Noida Sector 34 Noida (Call Girls) Delhi
9990771857 Call Girls in Noida Sector 34 Noida (Call Girls) Delhidelhimodel235
 
Call Girls in Khan Market 9654467111 ESCORTS SERVICE
Call Girls in Khan Market 9654467111 ESCORTS SERVICECall Girls in Khan Market 9654467111 ESCORTS SERVICE
Call Girls in Khan Market 9654467111 ESCORTS SERVICESapana Sha
 
Call Girls in Nehru Place Delhi 💯Call Us 🔝8264348440🔝
Call Girls in Nehru Place Delhi 💯Call Us 🔝8264348440🔝Call Girls in Nehru Place Delhi 💯Call Us 🔝8264348440🔝
Call Girls in Nehru Place Delhi 💯Call Us 🔝8264348440🔝soniya singh
 
Call Girls in Model Town Delhi 💯Call Us 🔝8264348440🔝
Call Girls in Model Town Delhi 💯Call Us 🔝8264348440🔝Call Girls in Model Town Delhi 💯Call Us 🔝8264348440🔝
Call Girls in Model Town Delhi 💯Call Us 🔝8264348440🔝soniya singh
 
Nanke Area Estate commercial ( Dir. Kat Kuo)
Nanke Area Estate commercial ( Dir. Kat Kuo)Nanke Area Estate commercial ( Dir. Kat Kuo)
Nanke Area Estate commercial ( Dir. Kat Kuo)jessica288382
 
9990771857 Call Girls in Noida Sector 06 Noida (Call Girls) Delhi
9990771857 Call Girls in Noida Sector 06 Noida (Call Girls) Delhi9990771857 Call Girls in Noida Sector 06 Noida (Call Girls) Delhi
9990771857 Call Girls in Noida Sector 06 Noida (Call Girls) Delhidelhimodel235
 
The Omaxe State Dwarka Delhi-broucher.pdf.pdf
The Omaxe State Dwarka Delhi-broucher.pdf.pdfThe Omaxe State Dwarka Delhi-broucher.pdf.pdf
The Omaxe State Dwarka Delhi-broucher.pdf.pdfkratirudram
 
Ajmera Prive at Juhu, Mumbai E-Brochure.pdf
Ajmera Prive at Juhu, Mumbai  E-Brochure.pdfAjmera Prive at Juhu, Mumbai  E-Brochure.pdf
Ajmera Prive at Juhu, Mumbai E-Brochure.pdfManishSaxena95
 
Dynamic Netsoft A leader In Property management Software
Dynamic Netsoft A leader In Property management SoftwareDynamic Netsoft A leader In Property management Software
Dynamic Netsoft A leader In Property management SoftwareDynamic Netsoft
 
Ryan Mahoney - How Property Technology Is Altering the Real Estate Market
Ryan Mahoney - How Property Technology Is Altering the Real Estate MarketRyan Mahoney - How Property Technology Is Altering the Real Estate Market
Ryan Mahoney - How Property Technology Is Altering the Real Estate MarketRyan Mahoney
 
Eco-Efficient Living: Redefining Sustainability through Leech's Green Design ...
Eco-Efficient Living: Redefining Sustainability through Leech's Green Design ...Eco-Efficient Living: Redefining Sustainability through Leech's Green Design ...
Eco-Efficient Living: Redefining Sustainability through Leech's Green Design ...Newman George Leech
 
Call Girls in Kashmiri Gate Delhi 💯Call Us 🔝8264348440🔝
Call Girls in Kashmiri Gate Delhi 💯Call Us 🔝8264348440🔝Call Girls in Kashmiri Gate Delhi 💯Call Us 🔝8264348440🔝
Call Girls in Kashmiri Gate Delhi 💯Call Us 🔝8264348440🔝soniya singh
 
Call Girls in Sarai Kale Khan Delhi 💯Call Us 🔝8264348440🔝
Call Girls in Sarai Kale Khan Delhi 💯Call Us 🔝8264348440🔝Call Girls in Sarai Kale Khan Delhi 💯Call Us 🔝8264348440🔝
Call Girls in Sarai Kale Khan Delhi 💯Call Us 🔝8264348440🔝soniya singh
 
SSPL The Strand Abodes Kharadi Pune Brochure.pdf
SSPL The Strand Abodes Kharadi Pune Brochure.pdfSSPL The Strand Abodes Kharadi Pune Brochure.pdf
SSPL The Strand Abodes Kharadi Pune Brochure.pdfabbu831446
 
Low Rate Call Girls in Akshardham Delhi Call 9990771857
Low Rate Call Girls in Akshardham   Delhi Call 9990771857Low Rate Call Girls in Akshardham   Delhi Call 9990771857
Low Rate Call Girls in Akshardham Delhi Call 9990771857delhimodel235
 
Low Rate Call Girls in Triveni Complex Delhi Call 9990771857
Low Rate Call Girls in Triveni Complex Delhi Call 9990771857Low Rate Call Girls in Triveni Complex Delhi Call 9990771857
Low Rate Call Girls in Triveni Complex Delhi Call 9990771857delhimodel235
 
Call Girls in Pitampura Delhi 💯Call Us 🔝8264348440🔝
Call Girls in Pitampura Delhi 💯Call Us 🔝8264348440🔝Call Girls in Pitampura Delhi 💯Call Us 🔝8264348440🔝
Call Girls in Pitampura Delhi 💯Call Us 🔝8264348440🔝soniya singh
 
Call Girls In Mundka Industrial Metro@꧂8447779280 ↬Enjoy ꧂Escort Service in ...
Call Girls In Mundka Industrial Metro@꧂8447779280 ↬Enjoy ꧂Escort Service in  ...Call Girls In Mundka Industrial Metro@꧂8447779280 ↬Enjoy ꧂Escort Service in  ...
Call Girls In Mundka Industrial Metro@꧂8447779280 ↬Enjoy ꧂Escort Service in ...asmaqueen5
 

Recently uploaded (20)

Low Rate Call Girls in Lajpat Nagar Delhi Call 9990771857
Low Rate Call Girls in Lajpat Nagar Delhi Call 9990771857Low Rate Call Girls in Lajpat Nagar Delhi Call 9990771857
Low Rate Call Girls in Lajpat Nagar Delhi Call 9990771857
 
9990771857 Call Girls in Noida Sector 34 Noida (Call Girls) Delhi
9990771857 Call Girls in Noida Sector 34 Noida (Call Girls) Delhi9990771857 Call Girls in Noida Sector 34 Noida (Call Girls) Delhi
9990771857 Call Girls in Noida Sector 34 Noida (Call Girls) Delhi
 
Call Girls in Khan Market 9654467111 ESCORTS SERVICE
Call Girls in Khan Market 9654467111 ESCORTS SERVICECall Girls in Khan Market 9654467111 ESCORTS SERVICE
Call Girls in Khan Market 9654467111 ESCORTS SERVICE
 
Call Girls in Nehru Place Delhi 💯Call Us 🔝8264348440🔝
Call Girls in Nehru Place Delhi 💯Call Us 🔝8264348440🔝Call Girls in Nehru Place Delhi 💯Call Us 🔝8264348440🔝
Call Girls in Nehru Place Delhi 💯Call Us 🔝8264348440🔝
 
Call Girls in Model Town Delhi 💯Call Us 🔝8264348440🔝
Call Girls in Model Town Delhi 💯Call Us 🔝8264348440🔝Call Girls in Model Town Delhi 💯Call Us 🔝8264348440🔝
Call Girls in Model Town Delhi 💯Call Us 🔝8264348440🔝
 
Nanke Area Estate commercial ( Dir. Kat Kuo)
Nanke Area Estate commercial ( Dir. Kat Kuo)Nanke Area Estate commercial ( Dir. Kat Kuo)
Nanke Area Estate commercial ( Dir. Kat Kuo)
 
9990771857 Call Girls in Noida Sector 06 Noida (Call Girls) Delhi
9990771857 Call Girls in Noida Sector 06 Noida (Call Girls) Delhi9990771857 Call Girls in Noida Sector 06 Noida (Call Girls) Delhi
9990771857 Call Girls in Noida Sector 06 Noida (Call Girls) Delhi
 
The Omaxe State Dwarka Delhi-broucher.pdf.pdf
The Omaxe State Dwarka Delhi-broucher.pdf.pdfThe Omaxe State Dwarka Delhi-broucher.pdf.pdf
The Omaxe State Dwarka Delhi-broucher.pdf.pdf
 
Ajmera Prive at Juhu, Mumbai E-Brochure.pdf
Ajmera Prive at Juhu, Mumbai  E-Brochure.pdfAjmera Prive at Juhu, Mumbai  E-Brochure.pdf
Ajmera Prive at Juhu, Mumbai E-Brochure.pdf
 
Hot call girls in Moti Bagh🔝 9953056974 🔝 escort Service
Hot call girls in Moti Bagh🔝 9953056974 🔝 escort ServiceHot call girls in Moti Bagh🔝 9953056974 🔝 escort Service
Hot call girls in Moti Bagh🔝 9953056974 🔝 escort Service
 
Dynamic Netsoft A leader In Property management Software
Dynamic Netsoft A leader In Property management SoftwareDynamic Netsoft A leader In Property management Software
Dynamic Netsoft A leader In Property management Software
 
Ryan Mahoney - How Property Technology Is Altering the Real Estate Market
Ryan Mahoney - How Property Technology Is Altering the Real Estate MarketRyan Mahoney - How Property Technology Is Altering the Real Estate Market
Ryan Mahoney - How Property Technology Is Altering the Real Estate Market
 
Eco-Efficient Living: Redefining Sustainability through Leech's Green Design ...
Eco-Efficient Living: Redefining Sustainability through Leech's Green Design ...Eco-Efficient Living: Redefining Sustainability through Leech's Green Design ...
Eco-Efficient Living: Redefining Sustainability through Leech's Green Design ...
 
Call Girls in Kashmiri Gate Delhi 💯Call Us 🔝8264348440🔝
Call Girls in Kashmiri Gate Delhi 💯Call Us 🔝8264348440🔝Call Girls in Kashmiri Gate Delhi 💯Call Us 🔝8264348440🔝
Call Girls in Kashmiri Gate Delhi 💯Call Us 🔝8264348440🔝
 
Call Girls in Sarai Kale Khan Delhi 💯Call Us 🔝8264348440🔝
Call Girls in Sarai Kale Khan Delhi 💯Call Us 🔝8264348440🔝Call Girls in Sarai Kale Khan Delhi 💯Call Us 🔝8264348440🔝
Call Girls in Sarai Kale Khan Delhi 💯Call Us 🔝8264348440🔝
 
SSPL The Strand Abodes Kharadi Pune Brochure.pdf
SSPL The Strand Abodes Kharadi Pune Brochure.pdfSSPL The Strand Abodes Kharadi Pune Brochure.pdf
SSPL The Strand Abodes Kharadi Pune Brochure.pdf
 
Low Rate Call Girls in Akshardham Delhi Call 9990771857
Low Rate Call Girls in Akshardham   Delhi Call 9990771857Low Rate Call Girls in Akshardham   Delhi Call 9990771857
Low Rate Call Girls in Akshardham Delhi Call 9990771857
 
Low Rate Call Girls in Triveni Complex Delhi Call 9990771857
Low Rate Call Girls in Triveni Complex Delhi Call 9990771857Low Rate Call Girls in Triveni Complex Delhi Call 9990771857
Low Rate Call Girls in Triveni Complex Delhi Call 9990771857
 
Call Girls in Pitampura Delhi 💯Call Us 🔝8264348440🔝
Call Girls in Pitampura Delhi 💯Call Us 🔝8264348440🔝Call Girls in Pitampura Delhi 💯Call Us 🔝8264348440🔝
Call Girls in Pitampura Delhi 💯Call Us 🔝8264348440🔝
 
Call Girls In Mundka Industrial Metro@꧂8447779280 ↬Enjoy ꧂Escort Service in ...
Call Girls In Mundka Industrial Metro@꧂8447779280 ↬Enjoy ꧂Escort Service in  ...Call Girls In Mundka Industrial Metro@꧂8447779280 ↬Enjoy ꧂Escort Service in  ...
Call Girls In Mundka Industrial Metro@꧂8447779280 ↬Enjoy ꧂Escort Service in ...
 

Rebgv stats-pkg-september-2019