SlideShare a Scribd company logo
1 of 9
Download to read offline
News Release
FOR IMMEDIATE RELEASE:
Home sales activity remains up, listings down across Metro
Vancouver’s housing market
VANCOUVER, BC – December 2, 2021 – As we near the end of 2021, home buyer demand
remains well in excess of long-term averages and the supply of homes for sale continues to
decline across Metro Vancouver’s* housing market.
The Real Estate Board of Greater Vancouver (REBGV) reports that residential home sales in the
region totalled 3,428 in November 2021, an 11.9 per cent increase from the 3,064 sales recorded
in November 2020, and a 1.9 per cent decrease from the 3,494 homes sold in October 2021.
Last month’s sales were 33.6 per cent above the 10-year November sales average.
“We expect home sale totals to end the year at or near an all-time record in our region,” Keith
Stewart, REBGV economist said. “We’ve had elevated home sale activity throughout 2021
despite persistently low levels of homes available for sale. With a new year around the corner,
it’s critical that this supply crunch remains the focus for addressing the housing affordability
challenges in our region.”
There were 3,964 detached, attached and apartment properties newly listed for sale on the
Multiple Listing Service® (MLS®) in Metro Vancouver in November 2021. This represents a
2.6 per cent decrease compared to the 4,068 homes listed in November 2020 and a 2.1 per cent
decrease compared to October 2021 when 4,049 homes were listed.
The total number of homes currently listed for sale on the MLS® system in Metro Vancouver is
7,144, a 35.7 per cent decrease compared to November 2020 (11,118) and a 11.1 per cent
decrease compared to October 2021 (8,034).
For all property types, the sales-to-active listings ratio for November 2021 is 48 per cent. By
property type, the ratio is 33.8 per cent for detached homes, 74.3 per cent for townhomes, and
53.7 per cent for apartments.
Generally, analysts say downward pressure on home prices occurs when the ratio dips below 12
per cent for a sustained period, while home prices often experience upward pressure when it
surpasses 20 per cent over several months.
“The imbalance between supply and demand, coupled with some buyers wanting to use rate
holds on lower rate fixed-term mortgages, is keeping upward pressure on home prices in this
traditionally quieter time of year for the market,” Stewart said.
The MLS® Home Price Index composite benchmark price for all residential properties in Metro
Vancouver is currently $1,211,200. This represents a 16 per cent increase over November 2020
and a one per cent increase compared to October 2021.
Sales of detached homes in November 2021 reached 987, a seven per cent decrease from the
1,061 detached sales recorded in November 2020. The benchmark price for a detached home is
$1,870,000. This represents a 20.8 per cent increase from November 2020 and a 1.1 per cent
increase compared to October 2021.
Sales of apartment homes reached 1,828 in November 2021, a 33.3 per cent increase compared
to the 1,371 sales in November 2020. The benchmark price of an apartment home is $752,800.
This represents an 11.4 per cent increase from November 2020 and a 0.9 per cent increase
compared to October 2021.
Attached home sales in November 2021 totalled 613, a three per cent decrease compared to the
632 sales in November 2020. The benchmark price of an attached home is $990,300. This
represents a 20.2 per cent increase from November 2020 and a 1.6 per cent increase compared to
October 2021.
-30-
*Editor’s Note: Areas covered by the Real Estate Board of Greater Vancouver include: Burnaby, Coquitlam, Maple
Ridge, New Westminster, North Vancouver, Pitt Meadows, Port Coquitlam, Port Moody, Richmond, South Delta,
Squamish, Sunshine Coast, Vancouver, West Vancouver, and Whistler.
The real estate industry is a key economic driver in British Columbia. In 2020, 30,944 homes changed ownership in
the Board’s area, generating $2.1 billion in economic spin-off activity and an estimated 14,728 jobs. The total dollar
value of residential sales transacted through the MLS® system in Greater Vancouver totalled $33.7 billion in 2020.
The Real Estate Board of Greater Vancouver is an association representing more than 14,000 REALTORS® and
their companies. The Board provides a variety of member services, including the Multiple Listing Service®. For
more information on real estate, statistics, and buying or selling a home, contact a local REALTOR® or visit
www.rebgv.org.
For more information please contact:
Craig Munn
Director, Communication
Real Estate Board of Greater Vancouver
604.730.3146
cmunn@rebgv.org
Property Type Area
Benchmark
Price
Price
Index
1 Month
Change %
3 Month
Change %
6 Month
Change %
1 Year
Change %
3 Year
Change %
5 Year
Change %
10 Year
Change %
Residential / Composite Lower Mainland $1,206,300 336.0 1.9% 4.6% 5.7% 21.3% 24.0% 44.6% 116.2%
Greater Vancouver $1,211,200 318.8 1.0% 2.9% 3.3% 16.0% 17.2% 32.5% 97.9%
Bowen Island $1,427,600 309.5 -1.5% -0.2% 2.4% 24.1% 45.3% 75.5% 144.7%
Burnaby East $1,107,600 315.8 0.7% 2.4% 3.4% 11.4% 12.2% 29.2% 98.2%
Burnaby North $1,132,200 305.0 0.8% 1.6% 3.2% 12.6% 11.4% 28.5% 94.3%
Burnaby South $1,062,100 301.5 0.5% 0.9% 1.6% 9.9% 6.2% 24.5% 82.5%
Coquitlam $1,138,800 338.5 1.4% 4.2% 4.7% 19.2% 22.1% 47.1% 129.2%
Ladner $1,077,700 305.4 0.3% 4.4% 4.9% 23.5% 25.4% 31.4% 96.9%
Maple Ridge $1,061,100 337.9 2.0% 5.9% 7.1% 30.3% 37.5% 70.4% 156.8%
New Westminster $743,900 330.0 1.3% 2.2% 3.9% 12.6% 9.8% 45.6% 107.9%
North Vancouver $1,263,100 290.2 1.4% 3.7% 3.2% 14.5% 19.3% 27.5% 99.5%
Pitt Meadows $967,700 353.6 2.6% 5.7% 6.6% 24.7% 27.7% 65.9% 149.9%
Port Coquitlam $966,100 330.7 1.7% 4.5% 4.6% 22.4% 27.0% 57.0% 130.3%
Port Moody $1,086,700 305.6 1.6% 2.4% 3.8% 16.6% 16.4% 44.1% 127.2%
Richmond $1,116,200 333.3 1.0% 3.2% 3.6% 16.3% 15.7% 29.6% 92.0%
Squamish $1,083,500 335.9 0.2% 7.0% 7.1% 27.1% 37.4% 66.9% 168.3%
Sunshine Coast $840,400 309.9 -1.4% 3.5% 4.5% 26.4% 39.7% 73.9% 147.5%
Tsawwassen $1,206,900 305.7 0.9% 4.2% 7.4% 21.8% 21.3% 26.7% 99.2%
Vancouver East $1,230,400 365.6 1.1% 2.5% 1.7% 11.7% 14.0% 27.0% 102.7%
Vancouver West $1,374,400 287.0 0.7% 0.6% 0.3% 9.7% 6.5% 11.2% 65.7%
West Vancouver $2,552,100 281.0 -1.0% 2.2% 0.5% 12.8% 12.6% 4.2% 68.0%
Whistler $1,386,400 310.0 0.6% 7.8% 8.4% 29.7% 44.1% 84.7% 171.0%
Single Family Detached Lower Mainland $1,708,400 364.0 2.3% 5.8% 6.5% 27.9% 35.2% 41.9% 125.7%
Greater Vancouver $1,870,000 344.6 1.1% 3.5% 3.9% 20.8% 24.6% 24.7% 98.2%
Bowen Island $1,427,600 309.5 -1.5% -0.2% 2.4% 24.1% 45.3% 75.5% 144.7%
Burnaby East $1,520,500 340.0 1.3% 3.3% 3.5% 18.3% 25.9% 29.8% 112.6%
Burnaby North $1,769,000 342.1 1.5% 0.4% 3.3% 16.1% 20.3% 16.3% 97.2%
Burnaby South $1,827,800 349.9 0.6% 2.2% 3.6% 16.2% 13.4% 11.4% 89.4%
Coquitlam $1,577,900 350.2 2.5% 4.6% 5.3% 24.0% 28.3% 35.4% 129.6%
Ladner $1,346,600 322.3 0.4% 4.6% 4.2% 27.5% 40.9% 34.4% 112.5%
Maple Ridge $1,204,000 343.0 2.3% 5.7% 7.4% 34.1% 45.0% 68.7% 165.7%
New Westminster $1,378,600 343.9 1.0% 3.8% 5.2% 21.0% 26.5% 34.8% 108.6%
North Vancouver $1,955,300 307.9 0.8% 4.8% 2.8% 17.0% 24.5% 19.2% 107.6%
Pitt Meadows $1,310,200 369.2 3.3% 9.2% 10.1% 32.3% 46.4% 65.0% 160.9%
Port Coquitlam $1,323,500 352.9 2.7% 5.9% 5.6% 27.4% 35.3% 51.4% 141.5%
Port Moody $1,912,000 353.1 1.8% 3.0% 5.0% 23.8% 27.6% 38.6% 138.9%
Richmond $1,981,400 379.9 1.6% 3.2% 2.6% 20.1% 17.5% 15.4% 83.9%
Squamish $1,443,000 353.7 0.5% 5.9% 3.5% 27.3% 45.3% 67.3% 170.2%
Sunshine Coast $863,700 302.6 -2.2% 1.9% 3.0% 25.5% 42.5% 76.8% 139.4%
Tsawwassen $1,476,700 322.4 1.1% 5.0% 8.6% 26.8% 30.1% 31.1% 111.0%
Vancouver East $1,744,700 384.3 1.6% 3.3% 2.0% 13.8% 20.0% 21.7% 108.2%
Vancouver West $3,413,800 345.3 -1.1% -1.4% 0.9% 9.3% 5.1% -3.0% 51.0%
West Vancouver $3,169,400 299.2 -1.0% 2.6% 0.9% 15.6% 15.7% 3.7% 74.4%
Whistler $2,633,300 332.4 0.3% 6.2% 4.8% 31.6% 54.5% 78.1% 160.5%
HOW TO READ THE TABLE:
• Benchmark Price: Estimated sale price of a benchmark property. Benchmarks represent a typical property within each market.
• Price Index: Index numbers estimate the percentage change in price on typical and constant quality properties over time. All figures are based on past sales.
• x Month/Year Change %: Percentage change of index over a period of x month(s)/year(s) *
In January 2005, the indexes are set to 100.
Townhome properties are similar to Attached properties, a category that was used in the previous MLSLink HPI, but do not included duplexes.
The above info is deemed reliable, but is not guaranteed. All dollar amounts in CDN.
November 2021
*
* MLS®, Multiple Listing Service®, and all related graphics are trademarks of The Canadian Real Estate Association 1 of 18
Property Type Area
Benchmark
Price
Price
Index
1 Month
Change %
3 Month
Change %
6 Month
Change %
1 Year
Change %
3 Year
Change %
5 Year
Change %
10 Year
Change %
November 2021
*
Townhouse Lower Mainland $891,800 321.4 2.1% 5.0% 8.1% 24.4% 25.8% 54.1% 118.3%
Greater Vancouver $990,300 317.7 1.6% 4.0% 5.8% 20.2% 20.8% 44.5% 106.8%
Burnaby East $704,400 316.0 1.6% 2.2% 1.6% 4.6% 6.9% 37.1% 101.0%
Burnaby North $841,500 314.1 0.0% 1.5% 3.0% 13.3% 13.3% 37.3% 95.7%
Burnaby South $772,600 323.1 1.2% 2.0% 3.4% 10.0% 10.8% 33.7% 96.1%
Coquitlam $890,100 326.5 1.4% 4.8% 6.7% 22.2% 26.7% 55.9% 127.4%
Ladner $797,100 295.0 -0.2% 4.3% 5.4% 20.6% 8.9% 33.1% 79.9%
Maple Ridge $720,300 334.4 1.1% 4.9% 6.2% 29.0% 30.9% 72.2% 154.1%
New Westminster $870,300 332.4 0.7% 2.9% 4.2% 17.3% 16.5% 48.5% 108.5%
North Vancouver $1,216,900 300.9 3.5% 6.7% 10.1% 20.9% 30.8% 41.3% 104.7%
Pitt Meadows $763,400 330.3 1.6% 0.1% 2.9% 22.8% 17.3% 59.8% 138.7%
Port Coquitlam $826,500 312.9 1.7% 3.6% 5.9% 26.4% 29.4% 54.1% 119.4%
Port Moody $779,300 265.0 2.3% 1.7% 3.6% 17.1% 12.5% 47.2% 90.8%
Richmond $970,100 318.8 0.9% 3.4% 6.4% 17.2% 15.2% 35.2% 91.5%
Squamish $950,800 321.0 5.2% 8.2% 8.2% 30.6% 33.2% 63.8% 173.2%
Sunshine Coast $658,400 315.4 6.6% 9.5% 8.8% 35.5% 40.6% 61.4% 165.7%
Tsawwassen $872,500 287.2 -0.8% 2.6% 3.4% 13.4% -4.4% 22.5% 71.7%
Vancouver East $1,070,700 340.5 1.6% 4.8% 7.9% 18.8% 21.7% 35.3% 107.4%
Vancouver West $1,296,900 303.2 -0.3% 0.8% 1.7% 12.7% 10.8% 23.3% 86.1%
Whistler $1,382,100 338.4 5.7% 8.9% 8.9% 32.1% 39.6% 85.5% 200.5%
Apartment Lower Mainland $755,300 319.0 1.5% 3.5% 3.9% 14.2% 14.1% 50.1% 110.3%
Greater Vancouver $752,800 302.3 0.9% 2.4% 2.1% 11.4% 11.2% 40.3% 98.5%
Burnaby East $742,400 295.5 0.3% 1.6% 4.2% 9.0% 4.3% 33.9% 79.7%
Burnaby North $738,300 289.2 0.7% 2.3% 3.3% 11.1% 7.3% 40.7% 98.5%
Burnaby South $686,000 281.1 0.4% 0.2% 0.5% 7.2% 2.3% 33.9% 79.6%
Coquitlam $607,000 333.1 0.6% 3.5% 3.2% 14.2% 16.2% 63.8% 133.8%
Ladner $593,700 278.1 0.4% 3.9% 6.0% 17.2% 11.6% 26.6% 76.8%
Maple Ridge $461,900 330.3 2.4% 8.0% 7.5% 22.7% 26.6% 79.9% 130.2%
New Westminster $576,600 326.7 1.5% 1.7% 3.6% 10.0% 5.8% 50.4% 108.9%
North Vancouver $663,600 270.0 1.4% 2.2% 1.5% 10.1% 11.9% 37.2% 91.1%
Pitt Meadows $579,800 356.0 2.5% 6.5% 5.8% 19.7% 20.5% 73.8% 145.9%
Port Coquitlam $542,800 324.6 0.9% 3.7% 2.9% 16.3% 20.2% 68.8% 130.2%
Port Moody $741,200 308.9 1.1% 2.5% 3.7% 12.9% 14.6% 56.4% 151.3%
Richmond $736,500 315.3 0.7% 3.2% 3.0% 13.2% 15.1% 52.5% 111.0%
Squamish $606,800 329.1 -4.2% 7.3% 11.0% 22.8% 31.5% 72.7% 177.7%
Sunshine Coast $552,900 334.6 -3.7% 8.1% 9.3% 22.2% 24.1% 58.4% 174.5%
Tsawwassen $654,300 282.2 0.9% 2.7% 6.5% 15.1% 8.7% 23.4% 81.9%
Vancouver East $639,600 359.5 1.0% 1.6% 0.5% 9.2% 8.6% 35.2% 99.8%
Vancouver West $835,500 271.1 1.5% 1.3% -0.1% 9.3% 6.9% 20.5% 76.2%
West Vancouver $1,116,700 226.9 -0.7% 1.3% -1.3% 2.3% -0.8% 18.5% 55.2%
Whistler $642,200 276.0 -3.0% 8.6% 11.5% 27.5% 41.6% 87.9% 164.1%
HOW TO READ THE TABLE:
• Benchmark Price: Estimated sale price of a benchmark property. Benchmarks represent a typical property within each market.
• Price Index: Index numbers estimate the percentage change in price on typical and constant quality properties over time. All figures are based on past sales.
• x Month/Year Change %: Percentage change of index over a period of x month(s)/year(s)
In January 2005, the indexes are set to 100. *
Townhome properties are similar to attached properties, a category that was used in the previous MLSLink HPI, but do not included duplexes.
Lower Mainland includes areas serviced by both Real Estate Board of Greater Vancouver & Fraser Valley Real Estate Board.
The above info is deemed reliable, but is not guaranteed. All dollar amounts in CDN.
* MLS®, Multiple Listing Service®, and all related graphics are trademarks of The Canadian Real Estate Association 2 of 18
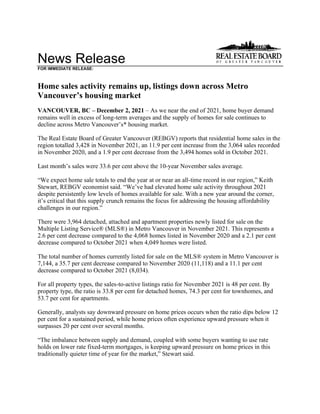
C:DATAMonthEndHpiexporthi_resgv-hpi2.tif
Greater
Vancouver
5
Year
Trend
60
110
160
210
260
310
360
Nov 2016
Jan 2017
Mar 2017
May 2017
Jul 2017
Sep 2017
Nov 2017
Jan 2018
Mar 2018
May 2018
Jul 2018
Sep 2018
Nov 2018
Jan 2019
Mar 2019
May 2019
Jul 2019
Sep 2019
Nov 2019
Jan 2020
Mar 2020
May 2020
Jul 2020
Sep 2020
Nov 2020
Jan 2021
Mar 2021
May 2021
Jul 2021
Sep 2021
Nov 2021
Price
Index
Residential
Detached
Townhouse
Apartment
Jan
2005
HPI
=
100
11
28
2021
MLS
®
SALES
Facts
B
u
r
n
a
b
y
C
o
q
u
it
la
m
D
e
lt
a
-
S
o
u
th
Is
la
n
d
s
-
G
u
lf
M
a
p
le
R
id
g
e
/P
it
t
M
e
a
d
o
w
s
N
e
w
W
e
s
tm
in
s
t
e
r
N
o
r
th
V
a
n
c
o
u
v
e
r
P
o
r
t
C
o
q
u
it
la
m
P
o
r
t
M
o
o
d
y
/B
e
lc
a
r
r
a
R
ic
h
m
o
n
d
S
q
u
a
m
is
h
S
u
n
s
h
in
e
C
o
a
s
t
V
a
n
c
o
u
v
e
r
E
a
s
t
V
a
n
c
o
u
v
e
r
W
e
s
t
W
e
s
t
V
a
n
c
o
u
v
e
r
/H
o
w
e
S
o
u
n
d
W
h
is
tl
e
r
/P
e
m
b
e
r
to
n
Detached
90
92
52
3
118
24
71
35
11
133
20
55
126
100
44
13
987
Attached
75
45
18
0
55
24
42
26
16
114
11
14
81
64
14
14
613
Apartment
273
149
22
0
54
129
133
64
32
233
19
10
172
482
20
36
1,828
Detached
$1,958,000
$1,717,500
$1,474,500
n/a
$1,325,500
$1,487,500
$2,152,000
$1,470,000
n/a
$2,052,500
$1,541,000
$1,085,000
$1,880,000
$3,665,000
$2,714,000
n/a
Attached
$920,000
$1,090,000
n/a
n/a
$779,900
$854,000
$1,308,000
$901,000
n/a
$1,059,950
n/a
n/a
$1,315,000
$1,697,500
n/a
n/a
n/a
Apartment
$660,000
$638,888
$570,250
n/a
$529,400
$558,000
$719,900
$539,950
$723,500
$628,000
n/a
n/a
$641,500
$796,500
$1,262,500
$444,000
Detached
97
100
51
12
122
29
94
37
21
116
24
63
137
108
60
19
1,090
Attached
73
39
27
0
38
17
30
31
19
117
20
10
76
68
9
29
603
Apartment
291
163
24
1
58
118
136
50
32
243
25
10
178
417
19
36
1,801
Detached
$1,772,000
$1,631,500
$1,452,000
n/a
$1,280,000
$1,400,000
$2,187,500
$1,380,500
$1,700,000
$1,810,000
$1,539,950
$877,000
$1,850,500
$3,205,000
$2,625,000
n/a
Attached
$920,000
$1,005,000
$849,900
n/a
$727,550
n/a
$1,355,028
$850,000
n/a
$960,088
$960,000
n/a
$1,315,900
$1,489,950
n/a
$1,235,000
n/a
Apartment
$660,000
$608,000
$561,250
n/a
$480,000
$560,500
$702,500
$543,900
$685,000
$619,900
$635,000
n/a
$662,000
$830,000
n/a
$627,500
Detached
93
92
54
11
114
29
94
35
21
88
29
83
137
95
62
24
1,061
Attached
64
59
31
0
65
27
39
26
19
88
28
17
66
60
6
37
632
Apartment
193
108
17
0
40
81
128
40
26
157
25
6
161
315
20
54
1,371
Detached
$1,535,000
$1,370,000
$1,190,000
n/a
$958,000
$1,148,000
$1,792,000
$1,100,000
$1,406,092
$1,577,500
$1,289,000
$797,450
$1,560,000
$2,985,000
$2,860,000
$1,950,000
Attached
$831,200
$858,900
$665,000
n/a
$569,000
$735,000
$1,049,000
$687,000
n/a
$865,000
$733,000
n/a
$1,139,286
$1,302,500
n/a
$1,165,000
n/a
Apartment
$585,500
$530,750
n/a
n/a
$419,500
$520,000
$690,000
$425,500
$582,500
$535,500
$516,000
n/a
$580,000
$755,000
$1,075,000
$504,750
Detached
1,117
1,235
710
91
1,658
326
1,128
528
257
1,476
276
777
1,703
1,131
647
234
13,294
Attached
1,016
608
261
6
762
216
611
305
266
1,309
229
121
787
832
97
281
7,707
Apartment
3,139
1,591
356
6
686
1,287
1,569
584
411
2,599
232
128
2,098
4,981
223
420
20,310
Detached
$1,780,000
$1,550,000
$1,351,000
$845,000
$1,192,000
$1,357,000
$1,970,000
$1,275,000
$1,710,000
$1,790,000
$1,415,000
$888,500
$1,780,000
$3,355,000
$2,990,000
$2,375,000
Attached
$910,000
$969,950
$839,900
n/a
$690,000
$837,250
$1,245,000
$825,500
$921,950
$950,000
$895,000
$529,000
$1,225,000
$1,460,000
$1,999,900
$1,170,000
n/a
Apartment
$640,000
$590,000
$570,000
n/a
$456,300
$550,000
$699,500
$500,000
$659,900
$605,000
$594,381
$497,000
$630,000
$780,400
$1,060,000
$577,500
Detached
750
888
548
68
1,231
249
896
346
197
853
232
710
1,184
845
502
194
9,693
Attached
563
552
187
4
690
186
418
268
209
815
199
112
508
537
49
277
5,574
Apartment
1,699
981
207
0
428
850
1,091
373
277
1,503
157
74
1,435
3,103
140
266
12,584
Detached
$1,524,500
$1,300,000
$1,134,250
$590,000
$920,000
$1,200,000
$1,705,500
$997,000
$1,367,400
$1,555,000
$1,147,000
$698,500
$1,550,000
$3,050,000
$2,550,000
$1,892,500
Attached
$811,750
$835,000
$708,800
n/a
$556,250
$729,900
$1,055,000
$694,000
$800,000
$848,375
$710,000
$480,000
$1,140,000
$1,300,000
$1,560,000
$1,168,000
n/a
Apartment
$586,000
$519,000
$510,000
n/a
$395,000
$515,000
$649,000
$450,000
$600,500
$545,000
$475,000
$400,000
$608,000
$755,000
$1,045,000
$464,950
Note:
Median
Selling
Prices
are
not
reported
for
areas
with
less
than
20
sales
or
for
the
Gulf
Islands
Median
Selling
Price
Number
of
Sales
Median
Selling
Price
October
2021
November
2020
Jan.
-
Nov.
2021
Jan.
-
Nov.
2020
Median
Selling
Price
Number
of
Sales
Median
Selling
Price
Number
of
Sales
November
2021
Number
of
Sales
Median
Selling
Price
Number
of
Sales
November
2021
Year-to-date
Year-to-date
11
28
2021
MLS
®
LISTINGS
Facts
B
u
r
n
a
b
y
C
o
q
u
it
la
m
D
e
lt
a
-
S
o
u
th
Is
la
n
d
s
-
G
u
lf
M
a
p
le
R
id
g
e
/P
it
t
M
e
a
d
o
w
s
N
e
w
W
e
s
tm
in
s
t
e
r
N
o
r
th
V
a
n
c
o
u
v
e
r
P
o
r
t
C
o
q
u
it
la
m
P
o
r
t
M
o
o
d
y
/B
e
lc
a
r
r
a
R
ic
h
m
o
n
d
S
q
u
a
m
is
h
S
u
n
s
h
in
e
C
o
a
s
t
V
a
n
c
o
u
v
e
r
E
a
s
t
V
a
n
c
o
u
v
e
r
W
e
s
t
W
e
s
t
V
a
n
c
o
u
v
e
r
/H
o
w
e
S
o
u
n
d
W
h
is
tl
e
r
/P
e
m
b
e
r
to
n
Detached
107
106
50
10
127
28
91
34
14
142
26
55
152
139
76
15
1,172
Attached
58
49
20
1
67
17
40
27
24
101
19
5
109
96
9
16
658
Apartment
311
168
17
2
61
132
150
51
33
267
14
7
241
626
27
27
2,134
Detached
84%
87%
104%
30%
93%
86%
78%
103%
79%
94%
77%
100%
83%
72%
58%
87%
Attached
129%
92%
90%
0%
82%
141%
105%
96%
67%
113%
58%
280%
74%
67%
156%
88%
n/a
Apartment
88%
89%
129%
0%
89%
98%
89%
125%
97%
87%
136%
143%
71%
77%
74%
133%
Detached
104
82
59
8
119
18
94
42
18
141
28
58
158
158
126
13
1,226
Attached
70
29
24
0
40
28
54
23
12
117
18
10
87
124
14
15
665
Apartment
270
165
22
0
41
124
142
66
38
278
28
6
233
689
22
34
2,158
Detached
93%
122%
86%
150%
103%
161%
100%
88%
117%
82%
86%
109%
87%
68%
48%
146%
Attached
104%
134%
113%
n/a
95%
61%
56%
135%
158%
100%
111%
100%
87%
55%
64%
193%
n/a
Apartment
108%
99%
109%
n/a
141%
95%
96%
76%
84%
87%
89%
167%
76%
61%
86%
106%
Detached
106
120
58
7
127
21
103
29
28
131
20
62
164
141
73
19
1,209
Attached
90
74
27
0
59
23
66
21
14
109
20
16
95
102
12
36
764
Apartment
286
173
29
0
49
120
164
69
40
279
33
4
218
557
24
50
2,095
Detached
88%
77%
93%
157%
90%
138%
91%
121%
75%
67%
145%
134%
84%
67%
85%
126%
Attached
71%
80%
115%
n/a
110%
117%
59%
124%
136%
81%
140%
106%
69%
59%
50%
103%
n/a
Apartment
67%
62%
59%
n/a
82%
68%
78%
58%
65%
56%
76%
150%
74%
57%
83%
108%
Detached
1,850
1,740
935
115
2,087
475
1,673
733
369
2,371
394
977
2,712
2,495
1,627
263
20,816
Attached
1,297
757
334
7
843
282
805
369
334
1,562
280
124
1,222
1,433
165
309
10,123
Apartment
4,242
2,046
385
7
817
1,765
2,214
802
514
3,653
251
157
3,175
8,558
354
441
29,381
Detached
60%
71%
76%
79%
79%
69%
67%
72%
70%
62%
70%
80%
63%
45%
40%
89%
Attached
78%
80%
78%
86%
90%
77%
76%
83%
80%
84%
82%
98%
64%
58%
59%
91%
n/a
Apartment
74%
78%
92%
86%
84%
73%
71%
73%
80%
71%
92%
82%
66%
58%
63%
95%
Detached
1,380
1,425
880
98
1,757
416
1,546
461
374
1,729
391
933
2,058
1,759
1,260
305
16,772
Attached
1,017
850
296
9
882
303
754
394
296
1,300
267
160
1,028
1,175
150
370
9,251
Apartment
3,465
1,881
412
7
754
1,564
2,201
684
510
2,898
273
109
2,847
7,411
414
443
25,873
Detached
54%
62%
62%
69%
70%
60%
58%
75%
53%
49%
59%
76%
58%
48%
40%
64%
Attached
55%
65%
63%
44%
78%
61%
55%
68%
71%
63%
75%
70%
49%
46%
33%
75%
n/a
Apartment
49%
52%
50%
0%
57%
54%
50%
55%
54%
52%
58%
68%
50%
42%
34%
60%
*
Year-to-date
listings
represent
a
cumulative
total
of
listings
rather
than
total
active
listings.
Number
of
Listings
November
2021
Number
of
Listings
%
Sales
to
Listings
Number
of
Listings
%
Sales
to
Listings
Number
of
Listings
%
Sales
to
Listings
October
2021
November
2020
Jan.
-
Nov.
2021
Jan.
-
Nov.
2020
%
Sales
to
Listings
Number
of
Listings
%
Sales
to
Listings
November
2021
Year-to-date*
Year-to-date*
Listing & Sales Activity Summary
Listings Sales
1 2 3 Col. 2 & 3 5 6 7 Col. 6 & 7 9 10 Col. 9 & 10
Nov Oct Nov Percentage Nov Oct Nov Percentage Sep 2020 - Sep 2021 - Percentage
2020 2021 2021 Variance 2020 2021 2021 Variance Nov 2020 Nov 2021 Variance
BURNABY % % %
DETACHED 106 104 107 2.9 93 97 90 -7.2 292 262 -10.3
ATTACHED 90 70 58 -17.1 64 73 75 2.7 227 233 2.6
APARTMENTS 286 270 311 15.2 193 291 273 -6.2 628 812 29.3
COQUITLAM
DETACHED 120 82 106 29.3 92 100 92 -8.0 348 266 -23.6
ATTACHED 74 29 49 69.0 59 39 45 15.4 218 121 -44.5
APARTMENTS 173 165 168 1.8 108 163 149 -8.6 346 445 28.6
DELTA
DETACHED 58 59 50 -15.3 54 51 52 2.0 218 152 -30.3
ATTACHED 27 24 20 -16.7 31 27 18 -33.3 74 68 -8.1
APARTMENTS 29 22 17 -22.7 17 24 22 -8.3 71 68 -4.2
MAPLE RIDGE/PITT MEADOWS
DETACHED 127 119 127 6.7 114 122 118 -3.3 448 349 -22.1
ATTACHED 59 40 67 67.5 65 38 55 44.7 239 144 -39.7
APARTMENTS 49 41 61 48.8 40 58 54 -6.9 145 172 18.6
NORTH VANCOUVER
DETACHED 103 94 91 -3.2 94 94 71 -24.5 355 245 -31.0
ATTACHED 66 54 40 -25.9 39 30 42 40.0 149 107 -28.2
APARTMENTS 164 142 150 5.6 128 136 133 -2.2 410 384 -6.3
NEW WESTMINSTER
DETACHED 21 18 28 55.6 29 29 24 -17.2 94 67 -28.7
ATTACHED 23 28 17 -39.3 27 17 24 41.2 84 52 -38.1
APARTMENTS 120 124 132 6.5 81 118 129 9.3 298 351 17.8
PORT MOODY/BELCARRA
DETACHED 28 18 14 -22.2 21 21 11 -47.6 68 56 -17.6
ATTACHED 14 12 24 100.0 19 19 16 -15.8 82 49 -40.2
APARTMENTS 40 38 33 -13.2 26 32 32 0.0 96 95 -1.0
PORT COQUITLAM
DETACHED 29 42 34 -19.0 35 37 35 -5.4 117 110 -6.0
ATTACHED 21 23 27 17.4 26 31 26 -16.1 93 78 -16.1
APARTMENTS 69 66 51 -22.7 40 50 64 28.0 124 151 21.8
RICHMOND
DETACHED 131 141 142 0.7 88 116 133 14.7 307 355 15.6
ATTACHED 109 117 101 -13.7 88 117 114 -2.6 279 327 17.2
APARTMENTS 279 278 267 -4.0 157 243 233 -4.1 537 706 31.5
SUNSHINE COAST
DETACHED 62 58 55 -5.2 83 63 55 -12.7 279 188 -32.6
ATTACHED 16 10 5 -50.0 17 10 14 40.0 57 30 -47.4
APARTMENTS 4 6 7 16.7 6 10 10 0.0 33 29 -12.1
SQUAMISH
DETACHED 20 28 26 -7.1 29 24 20 -16.7 94 64 -31.9
ATTACHED 20 18 19 5.6 28 20 11 -45.0 89 51 -42.7
APARTMENTS 33 28 14 -50.0 25 25 19 -24.0 62 55 -11.3
VANCOUVER EAST
DETACHED 164 158 152 -3.8 137 137 126 -8.0 459 401 -12.6
ATTACHED 95 87 109 25.3 66 76 81 6.6 206 232 12.6
APARTMENTS 218 233 241 3.4 161 178 172 -3.4 532 503 -5.5
VANCOUVER WEST
DETACHED 141 158 139 -12.0 95 108 100 -7.4 310 290 -6.5
ATTACHED 102 124 96 -22.6 60 68 64 -5.9 185 198 7.0
APARTMENTS 557 689 626 -9.1 315 417 482 15.6 1057 1315 24.4
WHISTLER/PEMBERTON
DETACHED 19 13 15 15.4 24 19 13 -31.6 94 56 -40.4
ATTACHED 36 15 16 6.7 37 29 14 -51.7 137 70 -48.9
APARTMENTS 50 34 27 -20.6 54 36 36 0.0 134 102 -23.9
WEST VANCOUVER/HOWE SOUND
DETACHED 73 126 76 -39.7 62 60 44 -26.7 200 145 -27.5
ATTACHED 12 14 9 -35.7 6 9 14 55.6 24 33 37.5
APARTMENTS 24 22 27 22.7 20 19 20 5.3 64 59 -7.8
GRAND TOTALS
DETACHED 1202 1218 1162 -4.6 1050 1078 984 -8.7 3683 3006 -18.4
ATTACHED 764 665 657 -1.2 632 603 613 1.7 2143 1793 -16.3
APARTMENTS 2095 2158 2132 -1.2 1371 1800 1828 1.6 4537 5247 15.6
Residential
Average
Sale
Prices
-
January
1977
to
November
2021
0
500
1000
1500
2000
2500
1
9
7
7
1
9
7
8
1
9
7
9
1
9
8
0
1
9
8
1
1
9
8
2
1
9
8
3
1
9
8
4
1
9
8
5
1
9
8
6
1
9
8
7
1
9
8
8
1
9
8
9
1
9
9
0
1
9
9
1
1
9
9
2
1
9
9
3
1
9
9
4
1
9
9
5
1
9
9
6
1
9
9
7
1
9
9
8
1
9
9
9
2
0
0
0
2
0
0
1
2
0
0
2
2
0
0
3
2
0
0
4
2
0
0
5
2
0
0
6
2
0
0
7
2
0
0
8
2
0
0
9
2
0
1
0
2
0
1
1
2
0
1
2
2
0
1
3
2
0
1
4
2
0
1
5
2
0
1
6
2
0
1
7
2
0
1
8
2
0
1
9
2
0
2
0
2
0
2
1
DETACHED
CONDOMINIUM
ATTACHED
APARTMENTS
IN
THOUSANDS
($)
NOTE:
From
1977
-
1984
condominium
averages
were
not
separated
into
attached
&
apartment.
$1,184,324
$744,942
$2,182,570

More Related Content

What's hot

Rebgv stats-pkg-november-2019-f
Rebgv stats-pkg-november-2019-fRebgv stats-pkg-november-2019-f
Rebgv stats-pkg-november-2019-fVicky Aulakh
 
REBGV Statistics Package October 2020
REBGV Statistics Package October 2020REBGV Statistics Package October 2020
REBGV Statistics Package October 2020Vicky Aulakh
 
Real Estate Board of Greater Vancouver Statistics Package August 2021
Real Estate Board of Greater Vancouver Statistics Package August 2021Real Estate Board of Greater Vancouver Statistics Package August 2021
Real Estate Board of Greater Vancouver Statistics Package August 2021Vicky Aulakh
 
Real Estate Board of Greater Vancouver Statistics Package January 2021
Real Estate Board of Greater Vancouver Statistics Package January 2021 Real Estate Board of Greater Vancouver Statistics Package January 2021
Real Estate Board of Greater Vancouver Statistics Package January 2021 Vicky Aulakh
 
Real Estate Board of Greater Vancouver Statistics Package July 2021
Real Estate Board of Greater Vancouver Statistics Package July 2021Real Estate Board of Greater Vancouver Statistics Package July 2021
Real Estate Board of Greater Vancouver Statistics Package July 2021Vicky Aulakh
 
REBGV January 2020 Statistics Package
REBGV January 2020 Statistics Package REBGV January 2020 Statistics Package
REBGV January 2020 Statistics Package Vicky Aulakh
 
Rebgv stats-pkg-august-2019
Rebgv stats-pkg-august-2019Rebgv stats-pkg-august-2019
Rebgv stats-pkg-august-2019Vicky Aulakh
 
REBGV Statistics Package May 2020
REBGV Statistics Package May 2020REBGV Statistics Package May 2020
REBGV Statistics Package May 2020Vicky Aulakh
 
Central Okanagan Statistics Package October 2021
Central Okanagan Statistics Package October 2021 Central Okanagan Statistics Package October 2021
Central Okanagan Statistics Package October 2021 VickyAulakh1
 
2021 June - REBGV Statistics Package
2021 June - REBGV Statistics Package2021 June - REBGV Statistics Package
2021 June - REBGV Statistics PackageVicky Aulakh
 
Rebgv stats-pkg-october-2018 .pdf
Rebgv stats-pkg-october-2018 .pdf Rebgv stats-pkg-october-2018 .pdf
Rebgv stats-pkg-october-2018 .pdf Kathryn Huang
 
REBGV Statistics Package June 2020
REBGV Statistics Package June 2020REBGV Statistics Package June 2020
REBGV Statistics Package June 2020Vicky Aulakh
 
Rebgv stats-pkg-april-2020
Rebgv stats-pkg-april-2020Rebgv stats-pkg-april-2020
Rebgv stats-pkg-april-2020Vicky Aulakh
 
Rebgv stats-pkg-april-2019
Rebgv stats-pkg-april-2019Rebgv stats-pkg-april-2019
Rebgv stats-pkg-april-2019Kathryn Huang
 
Rebgv stats-pkg-february-2020
Rebgv stats-pkg-february-2020Rebgv stats-pkg-february-2020
Rebgv stats-pkg-february-2020Vicky Aulakh
 
REBGV Stats Package February 2021
REBGV Stats Package February 2021REBGV Stats Package February 2021
REBGV Stats Package February 2021Vicky Aulakh
 
Rebgv stats-pkg-september-2018
Rebgv stats-pkg-september-2018Rebgv stats-pkg-september-2018
Rebgv stats-pkg-september-2018Kathryn Huang
 
Rebgv stats-pkg-february-2019
Rebgv stats-pkg-february-2019Rebgv stats-pkg-february-2019
Rebgv stats-pkg-february-2019Kathryn Huang
 
Rebgv stats-pkg-july-2019
Rebgv stats-pkg-july-2019Rebgv stats-pkg-july-2019
Rebgv stats-pkg-july-2019Vicky Aulakh
 
May 2021 Real Estate Board of Greater Vancouver Statistics Package
May 2021 Real Estate Board of Greater Vancouver Statistics PackageMay 2021 Real Estate Board of Greater Vancouver Statistics Package
May 2021 Real Estate Board of Greater Vancouver Statistics PackageVicky Aulakh
 

What's hot (20)

Rebgv stats-pkg-november-2019-f
Rebgv stats-pkg-november-2019-fRebgv stats-pkg-november-2019-f
Rebgv stats-pkg-november-2019-f
 
REBGV Statistics Package October 2020
REBGV Statistics Package October 2020REBGV Statistics Package October 2020
REBGV Statistics Package October 2020
 
Real Estate Board of Greater Vancouver Statistics Package August 2021
Real Estate Board of Greater Vancouver Statistics Package August 2021Real Estate Board of Greater Vancouver Statistics Package August 2021
Real Estate Board of Greater Vancouver Statistics Package August 2021
 
Real Estate Board of Greater Vancouver Statistics Package January 2021
Real Estate Board of Greater Vancouver Statistics Package January 2021 Real Estate Board of Greater Vancouver Statistics Package January 2021
Real Estate Board of Greater Vancouver Statistics Package January 2021
 
Real Estate Board of Greater Vancouver Statistics Package July 2021
Real Estate Board of Greater Vancouver Statistics Package July 2021Real Estate Board of Greater Vancouver Statistics Package July 2021
Real Estate Board of Greater Vancouver Statistics Package July 2021
 
REBGV January 2020 Statistics Package
REBGV January 2020 Statistics Package REBGV January 2020 Statistics Package
REBGV January 2020 Statistics Package
 
Rebgv stats-pkg-august-2019
Rebgv stats-pkg-august-2019Rebgv stats-pkg-august-2019
Rebgv stats-pkg-august-2019
 
REBGV Statistics Package May 2020
REBGV Statistics Package May 2020REBGV Statistics Package May 2020
REBGV Statistics Package May 2020
 
Central Okanagan Statistics Package October 2021
Central Okanagan Statistics Package October 2021 Central Okanagan Statistics Package October 2021
Central Okanagan Statistics Package October 2021
 
2021 June - REBGV Statistics Package
2021 June - REBGV Statistics Package2021 June - REBGV Statistics Package
2021 June - REBGV Statistics Package
 
Rebgv stats-pkg-october-2018 .pdf
Rebgv stats-pkg-october-2018 .pdf Rebgv stats-pkg-october-2018 .pdf
Rebgv stats-pkg-october-2018 .pdf
 
REBGV Statistics Package June 2020
REBGV Statistics Package June 2020REBGV Statistics Package June 2020
REBGV Statistics Package June 2020
 
Rebgv stats-pkg-april-2020
Rebgv stats-pkg-april-2020Rebgv stats-pkg-april-2020
Rebgv stats-pkg-april-2020
 
Rebgv stats-pkg-april-2019
Rebgv stats-pkg-april-2019Rebgv stats-pkg-april-2019
Rebgv stats-pkg-april-2019
 
Rebgv stats-pkg-february-2020
Rebgv stats-pkg-february-2020Rebgv stats-pkg-february-2020
Rebgv stats-pkg-february-2020
 
REBGV Stats Package February 2021
REBGV Stats Package February 2021REBGV Stats Package February 2021
REBGV Stats Package February 2021
 
Rebgv stats-pkg-september-2018
Rebgv stats-pkg-september-2018Rebgv stats-pkg-september-2018
Rebgv stats-pkg-september-2018
 
Rebgv stats-pkg-february-2019
Rebgv stats-pkg-february-2019Rebgv stats-pkg-february-2019
Rebgv stats-pkg-february-2019
 
Rebgv stats-pkg-july-2019
Rebgv stats-pkg-july-2019Rebgv stats-pkg-july-2019
Rebgv stats-pkg-july-2019
 
May 2021 Real Estate Board of Greater Vancouver Statistics Package
May 2021 Real Estate Board of Greater Vancouver Statistics PackageMay 2021 Real Estate Board of Greater Vancouver Statistics Package
May 2021 Real Estate Board of Greater Vancouver Statistics Package
 

Similar to Real Estate Board of Greater Vancouver Statistics Package - November 2021

Real Estate Board of Greater Vancouver Statistics Package October 2021
Real Estate Board of Greater Vancouver Statistics Package October 2021Real Estate Board of Greater Vancouver Statistics Package October 2021
Real Estate Board of Greater Vancouver Statistics Package October 2021VickyAulakh1
 
Real Estate Board of Greater Vancouver - Statistics Package for July 2021
Real Estate Board of Greater Vancouver - Statistics Package for July 2021Real Estate Board of Greater Vancouver - Statistics Package for July 2021
Real Estate Board of Greater Vancouver - Statistics Package for July 2021Alexander Mackenzie, PMP
 
Real Estate Board of Greater Vancouver Statistics Package November 2020
Real Estate Board of Greater Vancouver Statistics Package November 2020Real Estate Board of Greater Vancouver Statistics Package November 2020
Real Estate Board of Greater Vancouver Statistics Package November 2020Vicky Aulakh
 
REBGV-Stats-Pkg-July-2022
REBGV-Stats-Pkg-July-2022REBGV-Stats-Pkg-July-2022
REBGV-Stats-Pkg-July-2022Vicky Aulakh
 
REBGV Statistic Package December 2020
REBGV Statistic Package December 2020REBGV Statistic Package December 2020
REBGV Statistic Package December 2020Vicky Aulakh
 
Real Estate Board of Greater Vancouver Statistics Package February 2022
Real Estate Board of Greater Vancouver Statistics Package February 2022Real Estate Board of Greater Vancouver Statistics Package February 2022
Real Estate Board of Greater Vancouver Statistics Package February 2022Vicky Aulakh
 
Real Estate Board of Greater Vancouver Statistics Package March 2021
Real Estate Board of Greater Vancouver Statistics Package March 2021Real Estate Board of Greater Vancouver Statistics Package March 2021
Real Estate Board of Greater Vancouver Statistics Package March 2021Vicky Aulakh
 
REBGV-Stats-Pkg-April-2022.pdf
REBGV-Stats-Pkg-April-2022.pdfREBGV-Stats-Pkg-April-2022.pdf
REBGV-Stats-Pkg-April-2022.pdfVicky Aulakh
 
REBGV Statistics Package November 2022
REBGV Statistics Package November 2022REBGV Statistics Package November 2022
REBGV Statistics Package November 2022VickyAulakh1
 
October 2016 REBGV Statistics Package Vancouver BC Mike Stewart Realtor
October 2016 REBGV Statistics Package Vancouver BC Mike Stewart RealtorOctober 2016 REBGV Statistics Package Vancouver BC Mike Stewart Realtor
October 2016 REBGV Statistics Package Vancouver BC Mike Stewart RealtorMike Stewart
 
Rebgv stats-pkg-february-2018
Rebgv stats-pkg-february-2018Rebgv stats-pkg-february-2018
Rebgv stats-pkg-february-2018Kathryn Huang
 
Rebgv stats-pkg-november-2018
Rebgv stats-pkg-november-2018Rebgv stats-pkg-november-2018
Rebgv stats-pkg-november-2018Kathryn Huang
 
Supply response emerges in Metro Vancouver’s active housing market
Supply response emerges in Metro Vancouver’s active housing marketSupply response emerges in Metro Vancouver’s active housing market
Supply response emerges in Metro Vancouver’s active housing marketAlexanderMackenzie13
 
REBGV Statistics Package April 2021
REBGV Statistics Package April 2021REBGV Statistics Package April 2021
REBGV Statistics Package April 2021Vicky Aulakh
 
Rebgv stats-pkg-may-2021
Rebgv stats-pkg-may-2021Rebgv stats-pkg-may-2021
Rebgv stats-pkg-may-2021BC PRIME Realty
 

Similar to Real Estate Board of Greater Vancouver Statistics Package - November 2021 (19)

Real Estate Board of Greater Vancouver Statistics Package October 2021
Real Estate Board of Greater Vancouver Statistics Package October 2021Real Estate Board of Greater Vancouver Statistics Package October 2021
Real Estate Board of Greater Vancouver Statistics Package October 2021
 
Real Estate Board of Greater Vancouver - Statistics Package for July 2021
Real Estate Board of Greater Vancouver - Statistics Package for July 2021Real Estate Board of Greater Vancouver - Statistics Package for July 2021
Real Estate Board of Greater Vancouver - Statistics Package for July 2021
 
Rebgv stats-pkg-august-2021
Rebgv stats-pkg-august-2021Rebgv stats-pkg-august-2021
Rebgv stats-pkg-august-2021
 
Rebgv stats-pkg-november-2020
Rebgv stats-pkg-november-2020Rebgv stats-pkg-november-2020
Rebgv stats-pkg-november-2020
 
Real Estate Board of Greater Vancouver Statistics Package November 2020
Real Estate Board of Greater Vancouver Statistics Package November 2020Real Estate Board of Greater Vancouver Statistics Package November 2020
Real Estate Board of Greater Vancouver Statistics Package November 2020
 
REBGV-Stats-Pkg-July-2022
REBGV-Stats-Pkg-July-2022REBGV-Stats-Pkg-July-2022
REBGV-Stats-Pkg-July-2022
 
2021 June REBGV Stats Package
2021 June REBGV Stats Package2021 June REBGV Stats Package
2021 June REBGV Stats Package
 
REBGV Statistic Package December 2020
REBGV Statistic Package December 2020REBGV Statistic Package December 2020
REBGV Statistic Package December 2020
 
Real Estate Board of Greater Vancouver Statistics Package February 2022
Real Estate Board of Greater Vancouver Statistics Package February 2022Real Estate Board of Greater Vancouver Statistics Package February 2022
Real Estate Board of Greater Vancouver Statistics Package February 2022
 
Real Estate Board of Greater Vancouver Statistics Package March 2021
Real Estate Board of Greater Vancouver Statistics Package March 2021Real Estate Board of Greater Vancouver Statistics Package March 2021
Real Estate Board of Greater Vancouver Statistics Package March 2021
 
REBGV-Stats-Pkg-April-2022.pdf
REBGV-Stats-Pkg-April-2022.pdfREBGV-Stats-Pkg-April-2022.pdf
REBGV-Stats-Pkg-April-2022.pdf
 
Rebgv stats-pkg-october-2020
Rebgv stats-pkg-october-2020Rebgv stats-pkg-october-2020
Rebgv stats-pkg-october-2020
 
REBGV Statistics Package November 2022
REBGV Statistics Package November 2022REBGV Statistics Package November 2022
REBGV Statistics Package November 2022
 
October 2016 REBGV Statistics Package Vancouver BC Mike Stewart Realtor
October 2016 REBGV Statistics Package Vancouver BC Mike Stewart RealtorOctober 2016 REBGV Statistics Package Vancouver BC Mike Stewart Realtor
October 2016 REBGV Statistics Package Vancouver BC Mike Stewart Realtor
 
Rebgv stats-pkg-february-2018
Rebgv stats-pkg-february-2018Rebgv stats-pkg-february-2018
Rebgv stats-pkg-february-2018
 
Rebgv stats-pkg-november-2018
Rebgv stats-pkg-november-2018Rebgv stats-pkg-november-2018
Rebgv stats-pkg-november-2018
 
Supply response emerges in Metro Vancouver’s active housing market
Supply response emerges in Metro Vancouver’s active housing marketSupply response emerges in Metro Vancouver’s active housing market
Supply response emerges in Metro Vancouver’s active housing market
 
REBGV Statistics Package April 2021
REBGV Statistics Package April 2021REBGV Statistics Package April 2021
REBGV Statistics Package April 2021
 
Rebgv stats-pkg-may-2021
Rebgv stats-pkg-may-2021Rebgv stats-pkg-may-2021
Rebgv stats-pkg-may-2021
 

More from VickyAulakh1

Bridge & Elliot Ladner Floor Plans May 2024.pdf
Bridge & Elliot Ladner Floor Plans May 2024.pdfBridge & Elliot Ladner Floor Plans May 2024.pdf
Bridge & Elliot Ladner Floor Plans May 2024.pdfVickyAulakh1
 
Parksville 96 Surrey Floor Plans May 2024
Parksville 96 Surrey Floor Plans May 2024Parksville 96 Surrey Floor Plans May 2024
Parksville 96 Surrey Floor Plans May 2024VickyAulakh1
 
Greater Vancouver Realtors Statistics Package April 2024
Greater Vancouver Realtors Statistics Package April 2024Greater Vancouver Realtors Statistics Package April 2024
Greater Vancouver Realtors Statistics Package April 2024VickyAulakh1
 
NIDO by Wanson Group Floor Plan Set 2024
NIDO by Wanson Group Floor Plan Set 2024NIDO by Wanson Group Floor Plan Set 2024
NIDO by Wanson Group Floor Plan Set 2024VickyAulakh1
 
Portico by Wanson Group Floor Plans 2024
Portico by Wanson Group Floor Plans 2024Portico by Wanson Group Floor Plans 2024
Portico by Wanson Group Floor Plans 2024VickyAulakh1
 
Portico By Wanson Group Floor Plans 2024
Portico By Wanson Group Floor Plans 2024Portico By Wanson Group Floor Plans 2024
Portico By Wanson Group Floor Plans 2024VickyAulakh1
 
The Trails North Vancouver Floor Plans Feb 25, 2024
The Trails North Vancouver Floor Plans Feb 25, 2024The Trails North Vancouver Floor Plans Feb 25, 2024
The Trails North Vancouver Floor Plans Feb 25, 2024VickyAulakh1
 
AMAYA LIVING Surrey FLOOR PLANS by Panorama West Group
AMAYA LIVING Surrey FLOOR PLANS by Panorama West GroupAMAYA LIVING Surrey FLOOR PLANS by Panorama West Group
AMAYA LIVING Surrey FLOOR PLANS by Panorama West GroupVickyAulakh1
 
Willow Walk Oakridge Townhome & Garden Flat Floor Plans
Willow Walk Oakridge Townhome & Garden Flat Floor PlansWillow Walk Oakridge Townhome & Garden Flat Floor Plans
Willow Walk Oakridge Townhome & Garden Flat Floor PlansVickyAulakh1
 
JUNO Surrey By Streetside Developments Floor Plans
JUNO Surrey By Streetside Developments Floor PlansJUNO Surrey By Streetside Developments Floor Plans
JUNO Surrey By Streetside Developments Floor PlansVickyAulakh1
 
SKA+Building+2+Floorplan+-+Web+-+Current.pdf
SKA+Building+2+Floorplan+-+Web+-+Current.pdfSKA+Building+2+Floorplan+-+Web+-+Current.pdf
SKA+Building+2+Floorplan+-+Web+-+Current.pdfVickyAulakh1
 
Nolita-Floorplans.pdf
Nolita-Floorplans.pdfNolita-Floorplans.pdf
Nolita-Floorplans.pdfVickyAulakh1
 
Adore 49 Floor Plans.pdf
Adore 49 Floor Plans.pdfAdore 49 Floor Plans.pdf
Adore 49 Floor Plans.pdfVickyAulakh1
 
Citizen Burnaby Floor Plans
Citizen Burnaby Floor PlansCitizen Burnaby Floor Plans
Citizen Burnaby Floor PlansVickyAulakh1
 
VREB May 2023 Statistics Package.pdf
VREB May 2023 Statistics Package.pdfVREB May 2023 Statistics Package.pdf
VREB May 2023 Statistics Package.pdfVickyAulakh1
 
April 2023 Okanagan Statistics Graphs.pdf
April 2023 Okanagan Statistics Graphs.pdfApril 2023 Okanagan Statistics Graphs.pdf
April 2023 Okanagan Statistics Graphs.pdfVickyAulakh1
 
FVREB April 2023 Statistics Package.pdf
FVREB April 2023 Statistics Package.pdfFVREB April 2023 Statistics Package.pdf
FVREB April 2023 Statistics Package.pdfVickyAulakh1
 
VREB April 2023 Stats.pdf
VREB April 2023 Stats.pdfVREB April 2023 Stats.pdf
VREB April 2023 Stats.pdfVickyAulakh1
 
Okanagan Statistics Reports March 2023
Okanagan Statistics Reports March 2023Okanagan Statistics Reports March 2023
Okanagan Statistics Reports March 2023VickyAulakh1
 
FVREB March 2023 Statistics Package.pdf
FVREB March 2023 Statistics Package.pdfFVREB March 2023 Statistics Package.pdf
FVREB March 2023 Statistics Package.pdfVickyAulakh1
 

More from VickyAulakh1 (20)

Bridge & Elliot Ladner Floor Plans May 2024.pdf
Bridge & Elliot Ladner Floor Plans May 2024.pdfBridge & Elliot Ladner Floor Plans May 2024.pdf
Bridge & Elliot Ladner Floor Plans May 2024.pdf
 
Parksville 96 Surrey Floor Plans May 2024
Parksville 96 Surrey Floor Plans May 2024Parksville 96 Surrey Floor Plans May 2024
Parksville 96 Surrey Floor Plans May 2024
 
Greater Vancouver Realtors Statistics Package April 2024
Greater Vancouver Realtors Statistics Package April 2024Greater Vancouver Realtors Statistics Package April 2024
Greater Vancouver Realtors Statistics Package April 2024
 
NIDO by Wanson Group Floor Plan Set 2024
NIDO by Wanson Group Floor Plan Set 2024NIDO by Wanson Group Floor Plan Set 2024
NIDO by Wanson Group Floor Plan Set 2024
 
Portico by Wanson Group Floor Plans 2024
Portico by Wanson Group Floor Plans 2024Portico by Wanson Group Floor Plans 2024
Portico by Wanson Group Floor Plans 2024
 
Portico By Wanson Group Floor Plans 2024
Portico By Wanson Group Floor Plans 2024Portico By Wanson Group Floor Plans 2024
Portico By Wanson Group Floor Plans 2024
 
The Trails North Vancouver Floor Plans Feb 25, 2024
The Trails North Vancouver Floor Plans Feb 25, 2024The Trails North Vancouver Floor Plans Feb 25, 2024
The Trails North Vancouver Floor Plans Feb 25, 2024
 
AMAYA LIVING Surrey FLOOR PLANS by Panorama West Group
AMAYA LIVING Surrey FLOOR PLANS by Panorama West GroupAMAYA LIVING Surrey FLOOR PLANS by Panorama West Group
AMAYA LIVING Surrey FLOOR PLANS by Panorama West Group
 
Willow Walk Oakridge Townhome & Garden Flat Floor Plans
Willow Walk Oakridge Townhome & Garden Flat Floor PlansWillow Walk Oakridge Townhome & Garden Flat Floor Plans
Willow Walk Oakridge Townhome & Garden Flat Floor Plans
 
JUNO Surrey By Streetside Developments Floor Plans
JUNO Surrey By Streetside Developments Floor PlansJUNO Surrey By Streetside Developments Floor Plans
JUNO Surrey By Streetside Developments Floor Plans
 
SKA+Building+2+Floorplan+-+Web+-+Current.pdf
SKA+Building+2+Floorplan+-+Web+-+Current.pdfSKA+Building+2+Floorplan+-+Web+-+Current.pdf
SKA+Building+2+Floorplan+-+Web+-+Current.pdf
 
Nolita-Floorplans.pdf
Nolita-Floorplans.pdfNolita-Floorplans.pdf
Nolita-Floorplans.pdf
 
Adore 49 Floor Plans.pdf
Adore 49 Floor Plans.pdfAdore 49 Floor Plans.pdf
Adore 49 Floor Plans.pdf
 
Citizen Burnaby Floor Plans
Citizen Burnaby Floor PlansCitizen Burnaby Floor Plans
Citizen Burnaby Floor Plans
 
VREB May 2023 Statistics Package.pdf
VREB May 2023 Statistics Package.pdfVREB May 2023 Statistics Package.pdf
VREB May 2023 Statistics Package.pdf
 
April 2023 Okanagan Statistics Graphs.pdf
April 2023 Okanagan Statistics Graphs.pdfApril 2023 Okanagan Statistics Graphs.pdf
April 2023 Okanagan Statistics Graphs.pdf
 
FVREB April 2023 Statistics Package.pdf
FVREB April 2023 Statistics Package.pdfFVREB April 2023 Statistics Package.pdf
FVREB April 2023 Statistics Package.pdf
 
VREB April 2023 Stats.pdf
VREB April 2023 Stats.pdfVREB April 2023 Stats.pdf
VREB April 2023 Stats.pdf
 
Okanagan Statistics Reports March 2023
Okanagan Statistics Reports March 2023Okanagan Statistics Reports March 2023
Okanagan Statistics Reports March 2023
 
FVREB March 2023 Statistics Package.pdf
FVREB March 2023 Statistics Package.pdfFVREB March 2023 Statistics Package.pdf
FVREB March 2023 Statistics Package.pdf
 

Recently uploaded

Unique NIBM Flat In Pune E-Brochure.pdf
Unique NIBM Flat In Pune  E-Brochure.pdfUnique NIBM Flat In Pune  E-Brochure.pdf
Unique NIBM Flat In Pune E-Brochure.pdfManishSaxena95
 
Kohinoor Courtyard One Wakad Pune | Elegant Living Spaces
Kohinoor Courtyard One Wakad Pune | Elegant Living SpacesKohinoor Courtyard One Wakad Pune | Elegant Living Spaces
Kohinoor Courtyard One Wakad Pune | Elegant Living Spacesaidasheikh47
 
Acibadem Konaklari Uskudar - Listin Turkey
Acibadem Konaklari Uskudar - Listin TurkeyAcibadem Konaklari Uskudar - Listin Turkey
Acibadem Konaklari Uskudar - Listin TurkeyListing Turkey
 
Best Interior Design Services in Haldwani
Best Interior Design Services in HaldwaniBest Interior Design Services in Haldwani
Best Interior Design Services in HaldwaniGeomatrix
 
Real Estate Finance and Investments (2019).pdf
Real Estate Finance and Investments (2019).pdfReal Estate Finance and Investments (2019).pdf
Real Estate Finance and Investments (2019).pdfZahraYusuf9
 
Madhugiri Boucher Managed Farmland (knx)
Madhugiri Boucher Managed Farmland (knx)Madhugiri Boucher Managed Farmland (knx)
Madhugiri Boucher Managed Farmland (knx)knoxdigital1
 
SVN Live 5.13.24 Weekly Property Broadcast
SVN Live 5.13.24 Weekly Property BroadcastSVN Live 5.13.24 Weekly Property Broadcast
SVN Live 5.13.24 Weekly Property BroadcastSVN International Corp.
 
Are You Thinking About Buying a Home | KM Realty Group LLC
Are You Thinking About Buying a Home | KM Realty Group LLCAre You Thinking About Buying a Home | KM Realty Group LLC
Are You Thinking About Buying a Home | KM Realty Group LLCTammy Jackson
 
Retail Space for Lease - 1221 W. Main St., Sun Prairie, WI
Retail Space for Lease - 1221 W. Main St., Sun Prairie, WIRetail Space for Lease - 1221 W. Main St., Sun Prairie, WI
Retail Space for Lease - 1221 W. Main St., Sun Prairie, WILee & Associates of Madison, WI
 
MEQ Mainstreet Equity Corp Q2 2024 Investor Presentation
MEQ Mainstreet Equity Corp Q2 2024 Investor PresentationMEQ Mainstreet Equity Corp Q2 2024 Investor Presentation
MEQ Mainstreet Equity Corp Q2 2024 Investor PresentationMEQ - Mainstreet Equity Corp.
 
Kohinoor Greentastic At Kharadi, Pune - PDF.pdf
Kohinoor Greentastic At Kharadi, Pune - PDF.pdfKohinoor Greentastic At Kharadi, Pune - PDF.pdf
Kohinoor Greentastic At Kharadi, Pune - PDF.pdfmonikasharma630
 
Are You Thinking About Selling Your House Soon? | KM Realty Group LLC
Are You Thinking About Selling Your House Soon?  | KM Realty Group LLCAre You Thinking About Selling Your House Soon?  | KM Realty Group LLC
Are You Thinking About Selling Your House Soon? | KM Realty Group LLCTammy Jackson
 
construction material procurement in India
construction material procurement in Indiaconstruction material procurement in India
construction material procurement in Indiarohanindosup
 
Housing Price Regulation Thesis Defense by Slidesgo.pptx
Housing Price Regulation Thesis Defense by Slidesgo.pptxHousing Price Regulation Thesis Defense by Slidesgo.pptx
Housing Price Regulation Thesis Defense by Slidesgo.pptxcosmo-soil
 
The Wall Street Journal Weekend_Febrero 2024
The Wall Street Journal Weekend_Febrero 2024The Wall Street Journal Weekend_Febrero 2024
The Wall Street Journal Weekend_Febrero 2024diyoteam7
 
Lodha Baner Flat In Pune E-Brochure.pdf
Lodha Baner Flat In Pune  E-Brochure.pdfLodha Baner Flat In Pune  E-Brochure.pdf
Lodha Baner Flat In Pune E-Brochure.pdfManishSaxena95
 
Dynamic Grandeur Undri Pune | A Space For You To Find Your Space
Dynamic Grandeur Undri Pune | A Space For You To Find Your SpaceDynamic Grandeur Undri Pune | A Space For You To Find Your Space
Dynamic Grandeur Undri Pune | A Space For You To Find Your Spaceaidasheikh47
 
Rohan Harita Tathawade Pune Brochure.pdf
Rohan Harita Tathawade Pune Brochure.pdfRohan Harita Tathawade Pune Brochure.pdf
Rohan Harita Tathawade Pune Brochure.pdfabbu831446
 
Improvise, Adapt, Overcome - Sales Meeting, May '24
Improvise, Adapt, Overcome - Sales Meeting, May '24Improvise, Adapt, Overcome - Sales Meeting, May '24
Improvise, Adapt, Overcome - Sales Meeting, May '24Tom Blefko
 
M3M Sector 72 Noida E-Brochure.pdf NEW.
M3M Sector 72 Noida  E-Brochure.pdf NEW.M3M Sector 72 Noida  E-Brochure.pdf NEW.
M3M Sector 72 Noida E-Brochure.pdf NEW.sarak0han45400
 

Recently uploaded (20)

Unique NIBM Flat In Pune E-Brochure.pdf
Unique NIBM Flat In Pune  E-Brochure.pdfUnique NIBM Flat In Pune  E-Brochure.pdf
Unique NIBM Flat In Pune E-Brochure.pdf
 
Kohinoor Courtyard One Wakad Pune | Elegant Living Spaces
Kohinoor Courtyard One Wakad Pune | Elegant Living SpacesKohinoor Courtyard One Wakad Pune | Elegant Living Spaces
Kohinoor Courtyard One Wakad Pune | Elegant Living Spaces
 
Acibadem Konaklari Uskudar - Listin Turkey
Acibadem Konaklari Uskudar - Listin TurkeyAcibadem Konaklari Uskudar - Listin Turkey
Acibadem Konaklari Uskudar - Listin Turkey
 
Best Interior Design Services in Haldwani
Best Interior Design Services in HaldwaniBest Interior Design Services in Haldwani
Best Interior Design Services in Haldwani
 
Real Estate Finance and Investments (2019).pdf
Real Estate Finance and Investments (2019).pdfReal Estate Finance and Investments (2019).pdf
Real Estate Finance and Investments (2019).pdf
 
Madhugiri Boucher Managed Farmland (knx)
Madhugiri Boucher Managed Farmland (knx)Madhugiri Boucher Managed Farmland (knx)
Madhugiri Boucher Managed Farmland (knx)
 
SVN Live 5.13.24 Weekly Property Broadcast
SVN Live 5.13.24 Weekly Property BroadcastSVN Live 5.13.24 Weekly Property Broadcast
SVN Live 5.13.24 Weekly Property Broadcast
 
Are You Thinking About Buying a Home | KM Realty Group LLC
Are You Thinking About Buying a Home | KM Realty Group LLCAre You Thinking About Buying a Home | KM Realty Group LLC
Are You Thinking About Buying a Home | KM Realty Group LLC
 
Retail Space for Lease - 1221 W. Main St., Sun Prairie, WI
Retail Space for Lease - 1221 W. Main St., Sun Prairie, WIRetail Space for Lease - 1221 W. Main St., Sun Prairie, WI
Retail Space for Lease - 1221 W. Main St., Sun Prairie, WI
 
MEQ Mainstreet Equity Corp Q2 2024 Investor Presentation
MEQ Mainstreet Equity Corp Q2 2024 Investor PresentationMEQ Mainstreet Equity Corp Q2 2024 Investor Presentation
MEQ Mainstreet Equity Corp Q2 2024 Investor Presentation
 
Kohinoor Greentastic At Kharadi, Pune - PDF.pdf
Kohinoor Greentastic At Kharadi, Pune - PDF.pdfKohinoor Greentastic At Kharadi, Pune - PDF.pdf
Kohinoor Greentastic At Kharadi, Pune - PDF.pdf
 
Are You Thinking About Selling Your House Soon? | KM Realty Group LLC
Are You Thinking About Selling Your House Soon?  | KM Realty Group LLCAre You Thinking About Selling Your House Soon?  | KM Realty Group LLC
Are You Thinking About Selling Your House Soon? | KM Realty Group LLC
 
construction material procurement in India
construction material procurement in Indiaconstruction material procurement in India
construction material procurement in India
 
Housing Price Regulation Thesis Defense by Slidesgo.pptx
Housing Price Regulation Thesis Defense by Slidesgo.pptxHousing Price Regulation Thesis Defense by Slidesgo.pptx
Housing Price Regulation Thesis Defense by Slidesgo.pptx
 
The Wall Street Journal Weekend_Febrero 2024
The Wall Street Journal Weekend_Febrero 2024The Wall Street Journal Weekend_Febrero 2024
The Wall Street Journal Weekend_Febrero 2024
 
Lodha Baner Flat In Pune E-Brochure.pdf
Lodha Baner Flat In Pune  E-Brochure.pdfLodha Baner Flat In Pune  E-Brochure.pdf
Lodha Baner Flat In Pune E-Brochure.pdf
 
Dynamic Grandeur Undri Pune | A Space For You To Find Your Space
Dynamic Grandeur Undri Pune | A Space For You To Find Your SpaceDynamic Grandeur Undri Pune | A Space For You To Find Your Space
Dynamic Grandeur Undri Pune | A Space For You To Find Your Space
 
Rohan Harita Tathawade Pune Brochure.pdf
Rohan Harita Tathawade Pune Brochure.pdfRohan Harita Tathawade Pune Brochure.pdf
Rohan Harita Tathawade Pune Brochure.pdf
 
Improvise, Adapt, Overcome - Sales Meeting, May '24
Improvise, Adapt, Overcome - Sales Meeting, May '24Improvise, Adapt, Overcome - Sales Meeting, May '24
Improvise, Adapt, Overcome - Sales Meeting, May '24
 
M3M Sector 72 Noida E-Brochure.pdf NEW.
M3M Sector 72 Noida  E-Brochure.pdf NEW.M3M Sector 72 Noida  E-Brochure.pdf NEW.
M3M Sector 72 Noida E-Brochure.pdf NEW.
 

Real Estate Board of Greater Vancouver Statistics Package - November 2021