SlideShare a Scribd company logo
1 of 9
Download to read offline
News Release
FOR IMMEDIATE RELEASE:
March home sales and new listings set records in Metro Vancouver
VANCOUVER, BC – April 2, 2021 – Home buyer and seller activity reached unprecedented
levels across Metro Vancouver* in March.
The Real Estate Board of Greater Vancouver (REBGV) reports that residential home sales in the
region totalled 5,708 in March 2021, a 126.1 per cent increase from the 2,524 sales recorded in
March 2020, and a 53.2 per cent increase from the 3,727 homes sold in February 2021.
Last month’s sales were 72.2 per cent above the 10-year March sales average and is the highest
monthly sales total ever recorded in the region.
“In March, residents bought and listed homes across our region at levels not seen before,” Taylor
Biggar, REBGV Chair said. “This surge in activity is increasing upward pressure on prices.
We’re beginning to see double-digit price gains for single-family homes and townhomes over the
last 12 months.”
Demand was most pronounced in rural and suburban areas. Delta – South saw a 195.8 per cent
increase in sales over 2020 – the largest increase in Metro Vancouver. This was followed by
Whistler, which experienced a 194.7 per cent increase, and Squamish, which saw a 188.6 per
cent increase in sales.
There were 8,287 detached, attached and apartment homes newly listed for sale on the Multiple
Listing Service® (MLS®) in Metro Vancouver in March 2021. This represents an 86.8 per cent
increase compared to the 4,436 homes listed in March 2020 and a 64.2 per cent increase
compared to February 2021 when 5,048 homes were listed.
The total number of homes currently listed for sale on the MLS® system in Metro Vancouver is
9,145, a 4.8 per cent decrease compared to March 2020 (9,606) and a 9.4 per cent increase
compared to February 2021 (8,358).
This is 18.6 per cent below the 10-year March total listings average.
“While we did see a record number of listings enter the market last month, the demand in today’s
market isn’t allowing that new supply to accumulate. As a result, the overall inventory of homes
for sale decreased compared to last year,” said Biggar.
For all property types, the sales-to-active listings ratio for March 2021 is 62.4 per cent. By
property type, the ratio is 52.9 per cent for detached homes, 79.9 per cent for townhomes, and
65.4 per cent for apartments.
Generally, analysts say downward pressure on home prices occurs when the ratio dips below 12
per cent for a sustained period, while home prices often experience upward pressure when it
surpasses 20 per cent over several months.
“Today’s activity can be attributed, in part, to an economy that’s showing signs of recovery,
historically low interest rates, high demand for space, and increased household savings,” Biggar
said.
The MLS® Home Price Index composite benchmark price for all residential properties in Metro
Vancouver is $1,123,300. This represents a 9.4 per cent increase over March 2020 and a 3.6 per
cent increase compared to February 2021.
Sales of detached homes in March 2021 reached 1,965, a 130.6 per cent increase from the 852
detached sales recorded in March 2020. The benchmark price for a detached home is
$1,700,200. This represents a 17.9 per cent increase from March 2020 and a 4.9 per cent
increase compared to February 2021.
Sales of apartment homes reached 2,697 in March 2021, a 128.8 per cent increase compared to
the 1,179 sales in March 2020. The benchmark price of an apartment is $715,800. This
represents a 3.7 per cent increase from March 2020 and a 2.6 per cent increase compared to
February 2021.
Attached home sales in March 2021 totalled 1,046, a 112.2 per cent increase compared to the
493 sales in March 2020. The benchmark price of an attached home is $872,200. This represents
a 10.4 per cent increase from March 2020 and a 3.9 per cent increase compared to February
2021. -30-
*Editor’s Note: Areas covered by the Real Estate Board of Greater Vancouver include: Burnaby, Coquitlam, Maple
Ridge, New Westminster, North Vancouver, Pitt Meadows, Port Coquitlam, Port Moody, Richmond, South Delta,
Squamish, Sunshine Coast, Vancouver, West Vancouver, and Whistler.
The real estate industry is a key economic driver in British Columbia. In 2020, 30,944 homes changed ownership in
the Board’s area, generating $2.1 billion in economic spin-off activity and an estimated 14,728 jobs. The total dollar
value of residential sales transacted through the MLS® system in Greater Vancouver totalled $33.7 billion in 2020.
The Real Estate Board of Greater Vancouver is an association representing more than 14,000 REALTORS® and
their companies. The Board provides a variety of member services, including the Multiple Listing Service®. For
more information on real estate, statistics, and buying or selling a home, contact a local REALTOR® or visit
www.rebgv.org.
For more information please contact:
Craig Munn
Director, Communication
Real Estate Board of Greater Vancouver
604.730.3146
cmunn@rebgv.org
Property Type Area
Benchmark
Price
Price
Index
1 Month
Change %
3 Month
Change %
6 Month
Change %
1 Year
Change %
3 Year
Change %
5 Year
Change %
10 Year
Change %
Residential / Composite Lower Mainland $1,076,500 301.6 4.1% 8.5% 9.9% 11.8% 7.1% 45.6% 100.0%
Greater Vancouver $1,123,300 294.7 3.6% 7.2% 7.9% 9.4% 3.3% 35.0% 89.4%
Bowen Island $1,259,700 273.1 3.4% 4.7% 16.9% 36.2% 28.8% 92.7% 122.6%
Burnaby East $1,031,900 286.2 3.0% 3.2% 4.6% 6.1% 0.7% 32.9% 87.2%
Burnaby North $944,200 285.1 1.9% 3.9% 5.6% 6.3% 1.2% 36.3% 90.6%
Burnaby South $1,012,600 286.0 3.0% 4.8% 4.6% 4.8% -3.8% 35.9% 82.4%
Coquitlam $1,031,600 306.0 3.9% 7.8% 9.5% 11.6% 7.5% 46.8% 111.2%
Ladner $965,800 271.9 3.7% 11.0% 13.2% 16.4% 8.8% 13.9% 78.3%
Maple Ridge $924,800 294.5 6.6% 13.7% 17.2% 20.7% 16.6% 76.3% 122.1%
New Westminster $696,700 306.5 2.5% 4.8% 3.9% 5.3% 1.1% 49.2% 99.4%
North Vancouver $1,196,100 268.8 3.0% 6.5% 7.8% 11.4% 4.3% 32.9% 91.9%
Pitt Meadows $866,200 314.9 4.8% 11.9% 13.4% 15.7% 11.4% 76.2% 120.1%
Port Coquitlam $889,800 304.6 6.5% 11.7% 12.8% 16.2% 11.1% 57.5% 112.9%
Port Moody $1,017,000 281.1 4.3% 7.3% 10.4% 9.0% 6.2% 44.2% 107.6%
Richmond $1,022,700 305.3 3.0% 7.6% 8.1% 9.3% 2.5% 33.3% 79.0%
Squamish $862,700 274.5 4.1% 6.8% 5.3% 11.2% 8.2% 56.2% 133.8%
Sunshine Coast $771,500 270.3 3.8% 8.9% 17.5% 34.7% 26.5% 86.8% 115.4%
Tsawwassen $1,086,600 281.7 3.1% 9.2% 11.7% 18.6% 8.1% 8.2% 99.2%
Vancouver East $1,174,800 349.1 4.4% 5.6% 6.2% 7.3% 1.4% 30.7% 102.0%
Vancouver West $1,332,300 278.2 2.7% 6.5% 4.7% 3.2% -3.9% 17.5% 69.3%
West Vancouver $2,486,700 273.8 2.5% 8.2% 12.4% 18.0% -3.5% 8.3% 80.3%
Whistler $1,028,500 239.7 3.1% 7.7% 5.8% 12.6% 12.1% 64.9% 114.6%
Single Family Detached Lower Mainland $1,508,000 321.6 5.6% 11.8% 16.0% 21.3% 13.8% 39.4% 110.9%
Greater Vancouver $1,700,200 314.1 4.9% 9.4% 12.8% 17.9% 6.6% 24.1% 93.3%
Bowen Island $1,259,700 273.1 3.4% 4.7% 16.9% 36.1% 28.8% 92.7% 122.6%
Burnaby East $1,382,700 309.2 4.9% 5.4% 8.3% 12.8% 5.7% 26.5% 106.7%
Burnaby North $1,632,500 315.7 3.8% 6.3% 8.7% 12.3% 5.7% 20.0% 100.7%
Burnaby South $1,696,200 324.7 4.1% 7.4% 7.5% 13.6% 1.3% 21.6% 94.9%
Coquitlam $1,433,800 318.2 5.2% 11.0% 15.5% 20.2% 11.1% 36.2% 118.2%
Ladner $1,205,800 288.6 4.0% 12.7% 19.0% 23.2% 18.7% 12.3% 94.0%
Maple Ridge $1,043,900 297.4 7.3% 15.3% 20.3% 25.3% 22.5% 73.4% 130.7%
New Westminster $1,230,700 307.0 4.5% 7.3% 10.4% 14.0% 4.6% 26.3% 91.8%
North Vancouver $1,853,100 291.8 3.9% 8.8% 12.5% 19.4% 7.3% 25.3% 106.8%
Pitt Meadows $1,143,000 322.1 7.2% 17.5% 19.1% 27.4% 22.5% 72.7% 132.2%
Port Coquitlam $1,226,400 327.0 8.0% 16.2% 20.5% 27.7% 19.3% 48.5% 130.9%
Port Moody $1,739,300 321.2 5.0% 10.8% 17.1% 22.5% 17.1% 42.1% 122.3%
Richmond $1,747,800 338.6 5.8% 10.3% 11.7% 14.8% -1.3% 17.0% 66.6%
Squamish $1,094,800 288.5 5.8% 7.3% 7.3% 12.7% 9.3% 55.7% 134.6%
Sunshine Coast $765,000 268.0 3.8% 8.9% 17.5% 34.6% 26.2% 85.9% 113.2%
Tsawwassen $1,312,100 292.4 3.1% 9.3% 14.2% 21.3% 11.1% 3.8% 112.8%
Vancouver East $1,644,800 362.3 5.0% 6.4% 9.7% 13.5% 5.1% 18.7% 112.4%
Vancouver West $3,286,200 332.4 2.6% 3.9% 6.5% 10.4% -5.2% 4.4% 67.3%
West Vancouver $3,043,400 287.3 2.4% 8.9% 13.2% 19.2% -2.3% 7.1% 86.3%
Whistler $1,874,100 260.7 7.3% 10.1% 6.0% 12.2% 11.9% 53.2% 109.4%
HOW TO READ THE TABLE:
• Benchmark Price: Estimated sale price of a benchmark property. Benchmarks represent a typical property within each market.
• Price Index: Index numbers estimate the percentage change in price on typical and constant quality properties over time. All figures are based on past sales.
• x Month/Year Change %: Percentage change of index over a period of x month(s)/year(s) *
In January 2005, the indexes are set to 100.
Townhome properties are similar to Attached properties, a category that was used in the previous MLSLink HPI, but do not included duplexes.
The above info is deemed reliable, but is not guaranteed. All dollar amounts in CDN.
March 2021
*
* MLS®, Multiple Listing Service®, and all related graphics are trademarks of The Canadian Real Estate Association 1 of 18
Property Type Area
Benchmark
Price
Price
Index
1 Month
Change %
3 Month
Change %
6 Month
Change %
1 Year
Change %
3 Year
Change %
5 Year
Change %
10 Year
Change %
March 2021
*
Townhouse Lower Mainland $763,700 277.0 3.9% 7.7% 8.9% 12.0% 7.8% 55.6% 90.6%
Greater Vancouver $872,200 279.8 3.9% 7.2% 7.7% 10.4% 5.7% 44.5% 84.7%
Burnaby East $700,300 258.7 2.1% 1.4% 1.2% 6.4% 1.5% 51.2% 67.3%
Burnaby North $777,800 290.3 1.1% 3.6% 6.3% 6.8% 3.2% 41.0% 83.5%
Burnaby South $819,800 282.4 1.7% 2.9% 4.6% 6.6% -0.9% 44.3% 80.1%
Coquitlam $757,000 277.8 4.4% 6.9% 8.7% 11.2% 9.8% 47.8% 95.8%
Ladner $702,000 251.8 4.2% 10.9% 9.9% 8.9% -3.1% 16.2% 52.6%
Maple Ridge $634,400 294.5 6.7% 13.8% 14.7% 18.6% 10.3% 81.5% 115.4%
New Westminster $801,800 294.2 2.8% 7.6% 5.8% 9.1% 6.8% 38.4% 81.3%
North Vancouver $1,052,300 255.7 1.5% 4.2% 4.3% 9.1% 4.7% 37.2% 81.9%
Pitt Meadows $676,700 292.8 3.9% 9.1% 8.6% 10.9% 8.0% 72.7% 98.8%
Port Coquitlam $753,600 285.3 8.0% 14.1% 14.0% 17.1% 12.2% 52.6% 98.7%
Port Moody $684,700 231.4 3.7% 4.4% 5.4% 7.0% 3.8% 31.3% 64.0%
Richmond $864,800 284.0 1.8% 5.9% 7.4% 9.5% 4.5% 37.3% 75.1%
Squamish $826,600 271.8 4.7% 4.9% 9.0% 15.5% 12.9% 60.5% 133.3%
Tsawwassen $662,400 259.7 3.4% 9.8% 7.7% 7.7% -5.0% 21.6% 55.5%
Vancouver East $980,100 311.7 7.7% 9.2% 5.8% 8.0% 2.9% 43.4% 91.3%
Vancouver West $1,188,300 277.8 1.8% 4.1% 2.1% 4.9% -0.8% 27.0% 78.5%
Whistler $1,084,600 261.5 4.6% 5.3% 10.6% 14.8% 15.4% 69.8% 132.2%
Apartment Lower Mainland $690,200 295.7 2.7% 5.9% 5.1% 4.4% 1.4% 57.0% 95.2%
Greater Vancouver $715,800 286.2 2.6% 5.8% 4.7% 3.7% 0.6% 48.4% 88.9%
Burnaby East $747,100 286.6 1.1% 0.7% 2.1% -2.8% -7.4% 39.7% 77.8%
Burnaby North $637,300 272.1 1.2% 3.2% 3.9% 3.4% -0.7% 56.8% 91.9%
Burnaby South $682,700 274.1 2.7% 4.1% 3.5% 1.3% -6.1% 47.7% 78.3%
Coquitlam $560,700 307.7 2.6% 5.8% 5.4% 6.0% 4.6% 69.1% 111.3%
Ladner $548,700 256.2 2.4% 6.0% 2.6% 9.4% -1.4% 30.7% 66.9%
Maple Ridge $403,900 288.4 4.4% 9.4% 12.8% 12.3% 8.2% 87.5% 100.8%
New Westminster $543,800 308.1 2.1% 3.9% 2.4% 3.3% -0.5% 61.0% 102.8%
North Vancouver $615,200 250.9 2.5% 5.0% 4.9% 5.2% 1.7% 49.6% 80.1%
Pitt Meadows $548,600 323.5 3.1% 8.9% 11.6% 10.6% 2.9% 84.3% 120.7%
Port Coquitlam $501,500 299.9 4.2% 6.9% 6.7% 8.0% 4.8% 80.6% 107.0%
Port Moody $697,800 290.8 3.9% 6.3% 8.8% 3.9% 3.4% 63.1% 131.9%
Richmond $695,800 297.9 1.8% 6.6% 6.2% 6.2% 5.2% 60.9% 99.4%
Squamish $510,600 251.7 0.3% 6.4% -1.7% 4.9% 2.4% 59.3% 143.0%
Tsawwassen $588,800 253.6 2.7% 8.0% 4.1% 10.8% 1.2% 33.1% 67.1%
Vancouver East $619,900 348.4 3.4% 4.1% 3.8% 3.0% -1.6% 49.1% 94.2%
Vancouver West $816,700 265.0 2.8% 7.5% 4.4% 0.7% -3.3% 27.8% 72.6%
West Vancouver $1,143,300 232.3 2.6% 4.4% 7.8% 11.1% -7.0% 29.3% 65.0%
Whistler $535,300 209.7 -0.3% 9.8% 1.2% 10.4% 8.6% 71.5% 114.4%
HOW TO READ THE TABLE:
• Benchmark Price: Estimated sale price of a benchmark property. Benchmarks represent a typical property within each market.
• Price Index: Index numbers estimate the percentage change in price on typical and constant quality properties over time. All figures are based on past sales.
• x Month/Year Change %: Percentage change of index over a period of x month(s)/year(s)
In January 2005, the indexes are set to 100. *
Townhome properties are similar to attached properties, a category that was used in the previous MLSLink HPI, but do not included duplexes.
Lower Mainland includes areas serviced by both Real Estate Board of Greater Vancouver & Fraser Valley Real Estate Board.
The above info is deemed reliable, but is not guaranteed. All dollar amounts in CDN.
* MLS®, Multiple Listing Service®, and all related graphics are trademarks of The Canadian Real Estate Association 2 of 18
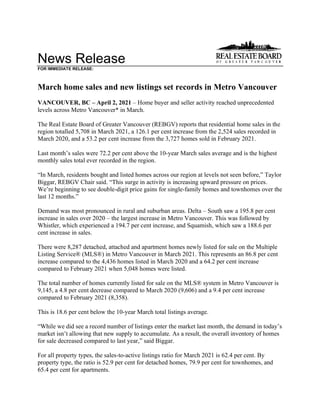
C:DATAMonthEndHpiexporthi_resgv-hpi2.tif
Greater
Vancouver
5
Year
Trend
60
110
160
210
260
310
360
Mar 2016
May 2016
Jul 2016
Sep 2016
Nov 2016
Jan 2017
Mar 2017
May 2017
Jul 2017
Sep 2017
Nov 2017
Jan 2018
Mar 2018
May 2018
Jul 2018
Sep 2018
Nov 2018
Jan 2019
Mar 2019
May 2019
Jul 2019
Sep 2019
Nov 2019
Jan 2020
Mar 2020
May 2020
Jul 2020
Sep 2020
Nov 2020
Jan 2021
Mar 2021
Price
Index
Residential
Detached
Townhouse
Apartment
Jan
2005
HPI
=
100
3
28
2021
MLS
®
SALES
Facts
B
u
r
n
a
b
y
C
o
q
u
it
la
m
D
e
lt
a
-
S
o
u
th
Is
la
n
d
s
-
G
u
lf
M
a
p
le
R
id
g
e
/P
it
t
M
e
a
d
o
w
s
N
e
w
W
e
s
tm
in
s
t
e
r
N
o
r
th
V
a
n
c
o
u
v
e
r
P
o
r
t
C
o
q
u
it
la
m
P
o
r
t
M
o
o
d
y
/B
e
lc
a
r
r
a
R
ic
h
m
o
n
d
S
q
u
a
m
is
h
S
u
n
s
h
in
e
C
o
a
s
t
V
a
n
c
o
u
v
e
r
E
a
s
t
V
a
n
c
o
u
v
e
r
W
e
s
t
W
e
s
t
V
a
n
c
o
u
v
e
r
/H
o
w
e
S
o
u
n
d
W
h
is
tl
e
r
/P
e
m
b
e
r
to
n
Detached
155
180
109
10
271
46
175
81
41
234
46
106
244
146
98
23
1,965
Attached
154
91
33
1
97
25
87
45
32
184
28
14
100
106
16
33
1,046
Apartment
416
187
68
0
101
173
203
77
58
343
27
13
316
628
31
56
2,697
Detached
$1,755,000
$1,557,500
$1,350,000
n/a
$1,189,000
$1,350,000
$1,915,000
$1,260,000
$1,565,000
$1,850,000
$1,490,500
$858,024
$1,768,000
$3,509,000
$2,939,000
$2,375,000
Attached
$855,000
$985,000
$890,000
n/a
$690,450
$767,900
$1,235,500
$758,800
$999,900
$915,000
$925,000
n/a
$1,210,000
$1,550,000
n/a
$1,049,000
n/a
Apartment
$660,000
$558,000
$628,500
n/a
$450,000
$572,450
$695,000
$509,900
$660,000
$588,250
$499,000
n/a
$630,000
$767,500
$998,500
$500,500
Detached
97
105
84
11
169
30
88
51
27
139
32
71
137
87
78
25
1,231
Attached
66
69
23
1
89
21
86
25
25
115
21
19
85
63
10
19
737
Apartment
271
138
28
0
73
111
141
44
39
197
25
11
183
440
14
44
1,759
Detached
$1,739,999
$1,545,000
$1,280,000
n/a
$1,080,000
$1,308,000
$1,953,000
$1,270,000
$1,720,000
$1,750,000
$1,352,500
$800,000
$1,700,000
$3,232,500
$3,064,000
$2,200,000
Attached
$910,500
$954,900
$825,000
n/a
$635,900
$750,000
$1,197,750
$801,000
$877,500
$907,000
$830,000
n/a
$1,184,000
$1,335,000
n/a
n/a
n/a
Apartment
$598,000
$566,500
$629,450
n/a
$427,000
$540,000
$715,000
$474,400
$640,000
$565,000
$525,000
n/a
$602,000
$735,000
n/a
$625,000
Detached
69
73
40
5
104
21
69
28
16
97
18
44
109
106
41
12
852
Attached
58
49
14
0
66
16
35
30
16
73
10
11
47
52
6
10
493
Apartment
170
79
17
0
29
81
99
38
22
165
7
3
136
308
9
16
1,179
Detached
$1,549,000
$1,250,000
$1,025,000
n/a
$887,810
$1,200,000
$1,632,000
$1,031,000
n/a
$1,608,000
n/a
$628,500
$1,497,000
$3,050,000
$2,465,000
n/a
Attached
$835,000
$815,000
n/a
n/a
$549,900
n/a
$1,049,000
$635,000
n/a
$853,000
n/a
n/a
$1,100,000
$1,232,500
n/a
n/a
n/a
Apartment
$607,500
$510,000
n/a
n/a
$399,000
$525,000
$695,000
$442,500
$627,950
$551,000
n/a
n/a
$590,000
$790,000
n/a
n/a
Detached
308
361
238
27
535
97
308
165
77
444
97
219
490
302
205
63
3,936
Attached
278
198
66
2
254
60
214
88
66
363
61
41
233
207
31
75
2,237
Apartment
883
431
114
0
223
350
436
158
125
682
68
34
598
1,353
56
140
5,651
Detached
$1,720,000
$1,538,000
$1,297,000
$800,000
$1,125,900
$1,306,000
$1,915,000
$1,259,394
$1,650,000
$1,752,500
$1,397,000
$818,952
$1,739,000
$3,402,500
$3,030,000
$2,200,000
Attached
$898,000
$957,694
$849,500
n/a
$649,900
$732,500
$1,199,900
$766,000
$909,000
$908,000
$845,000
$550,000
$1,200,000
$1,456,888
$1,800,000
$1,037,000
n/a
Apartment
$620,800
$563,000
$609,900
n/a
$427,000
$550,000
$700,000
$482,750
$640,000
$580,000
$545,778
$435,000
$623,450
$750,000
$1,067,500
$572,000
Detached
164
181
100
12
269
48
164
75
34
201
45
96
248
203
107
29
1,976
Attached
142
122
40
2
162
27
83
63
36
195
32
17
115
125
11
43
1,215
Apartment
428
237
55
0
99
182
260
101
57
402
34
14
332
779
22
52
3,054
Detached
$1,462,500
$1,280,000
$1,022,500
n/a
$879,998
$1,179,000
$1,642,750
$955,000
$1,332,500
$1,627,500
$1,086,344
$622,738
$1,480,000
$3,030,000
$2,360,000
$2,099,000
Attached
$815,000
$815,000
$692,900
n/a
$549,400
$740,500
$1,055,000
$657,000
$749,750
$830,000
$680,000
n/a
$1,085,619
$1,300,000
n/a
$1,100,000
n/a
Apartment
$599,450
$511,250
$545,000
n/a
$385,100
$520,000
$645,000
$440,000
$596,000
$557,500
$482,500
n/a
$595,000
$765,000
$837,500
$526,500
Note:
Median
Selling
Prices
are
not
reported
for
areas
with
less
than
20
sales
or
for
the
Gulf
Islands
Median
Selling
Price
Number
of
Sales
Median
Selling
Price
February
2021
March
2020
Jan.
-
Mar.
2021
Jan.
-
Mar.
2020
Median
Selling
Price
Number
of
Sales
Median
Selling
Price
Number
of
Sales
March
2021
Number
of
Sales
Median
Selling
Price
Number
of
Sales
March
2021
Year-to-date
Year-to-date
3
28
2021
MLS
®
LISTINGS
Facts
B
u
r
n
a
b
y
C
o
q
u
it
la
m
D
e
lt
a
-
S
o
u
th
Is
la
n
d
s
-
G
u
lf
M
a
p
le
R
id
g
e
/P
it
t
M
e
a
d
o
w
s
N
e
w
W
e
s
tm
in
s
t
e
r
N
o
r
th
V
a
n
c
o
u
v
e
r
P
o
r
t
C
o
q
u
it
la
m
P
o
r
t
M
o
o
d
y
/B
e
lc
a
r
r
a
R
ic
h
m
o
n
d
S
q
u
a
m
is
h
S
u
n
s
h
in
e
C
o
a
s
t
V
a
n
c
o
u
v
e
r
E
a
s
t
V
a
n
c
o
u
v
e
r
W
e
s
t
W
e
s
t
V
a
n
c
o
u
v
e
r
/H
o
w
e
S
o
u
n
d
W
h
is
tl
e
r
/P
e
m
b
e
r
to
n
Detached
328
295
160
14
365
91
278
135
62
390
55
141
451
362
224
26
3,377
Attached
181
102
45
0
131
30
125
43
47
220
41
7
158
206
20
40
1,396
Apartment
496
211
65
0
101
209
292
130
72
464
46
27
384
923
45
49
3,514
Detached
47%
61%
68%
71%
74%
51%
63%
60%
66%
60%
84%
75%
54%
40%
44%
88%
Attached
85%
89%
73%
n/a
74%
83%
70%
105%
68%
84%
68%
200%
63%
51%
80%
83%
n/a
Apartment
84%
89%
105%
n/a
100%
83%
70%
59%
81%
74%
59%
48%
82%
68%
69%
114%
Detached
141
160
108
4
223
48
127
78
39
184
51
91
227
146
113
20
1,760
Attached
121
71
33
2
77
15
111
34
26
137
24
18
81
91
15
32
888
Apartment
333
164
42
0
86
153
188
60
41
264
24
6
259
691
32
57
2,400
Detached
69%
66%
78%
275%
76%
63%
69%
65%
69%
76%
63%
78%
60%
60%
69%
125%
Attached
55%
97%
70%
50%
116%
140%
77%
74%
96%
84%
88%
106%
105%
69%
67%
59%
n/a
Apartment
81%
84%
67%
n/a
85%
73%
75%
73%
95%
75%
104%
183%
71%
64%
44%
77%
Detached
105
147
87
10
185
32
130
48
40
138
39
78
188
151
109
22
1,509
Attached
68
87
22
2
88
21
53
35
31
110
21
17
59
90
16
33
753
Apartment
310
148
30
0
84
143
165
58
31
274
25
11
215
599
41
40
2,174
Detached
66%
50%
46%
50%
56%
66%
53%
58%
40%
70%
46%
56%
58%
70%
38%
55%
Attached
85%
56%
64%
0%
75%
76%
66%
86%
52%
66%
48%
65%
80%
58%
38%
30%
n/a
Apartment
55%
53%
57%
n/a
35%
57%
60%
66%
71%
60%
28%
27%
63%
51%
22%
40%
Detached
572
569
336
23
713
164
492
263
121
726
144
298
853
652
474
65
6,465
Attached
380
238
105
4
287
73
303
106
88
495
83
35
345
403
49
99
3,093
Apartment
1,187
524
152
0
249
521
658
267
150
1,034
93
44
859
2,254
115
150
8,257
Detached
54%
63%
71%
117%
75%
59%
63%
63%
64%
61%
67%
73%
57%
46%
43%
97%
Attached
73%
83%
63%
50%
89%
82%
71%
83%
75%
73%
73%
117%
68%
51%
63%
76%
n/a
Apartment
74%
82%
75%
n/a
90%
67%
66%
59%
83%
66%
73%
77%
70%
60%
49%
93%
Detached
325
365
224
19
469
89
385
123
96
450
103
204
465
426
345
70
4,158
Attached
226
196
69
6
262
55
167
106
67
332
60
43
192
268
34
89
2,172
Apartment
800
449
115
2
211
339
528
162
101
759
67
29
596
1,591
102
129
5,980
Detached
50%
50%
45%
63%
57%
54%
43%
61%
35%
45%
44%
47%
53%
48%
31%
41%
Attached
63%
62%
58%
33%
62%
49%
50%
59%
54%
59%
53%
40%
60%
47%
32%
48%
n/a
Apartment
54%
53%
48%
0%
47%
54%
49%
62%
56%
53%
51%
48%
56%
49%
22%
40%
*
Year-to-date
listings
represent
a
cumulative
total
of
listings
rather
than
total
active
listings.
Number
of
Listings
March
2021
Number
of
Listings
%
Sales
to
Listings
Number
of
Listings
%
Sales
to
Listings
Number
of
Listings
%
Sales
to
Listings
February
2021
March
2020
Jan.
-
Mar.
2021
Jan.
-
Mar.
2020
%
Sales
to
Listings
Number
of
Listings
%
Sales
to
Listings
March
2021
Year-to-date*
Year-to-date*
Listing & Sales Activity Summary
Listings Sales
1 2 3 Col. 2 & 3 5 6 7 Col. 6 & 7 9 10 Col. 9 & 10
Mar Feb Mar Percentage Mar Feb Mar Percentage Jan 2020 - Jan 2021 - Percentage
2020 2021 2021 Variance 2020 2021 2021 Variance Mar 2020 Mar 2021 Variance
BURNABY % % %
DETACHED 105 141 328 132.6 69 97 155 59.8 164 308 87.8
ATTACHED 68 121 181 49.6 58 66 154 133.3 142 278 95.8
APARTMENTS 310 333 496 48.9 170 271 416 53.5 428 883 106.3
COQUITLAM
DETACHED 147 160 295 84.4 73 105 180 71.4 181 361 99.4
ATTACHED 87 71 102 43.7 49 69 91 31.9 122 198 62.3
APARTMENTS 148 164 211 28.7 79 138 187 35.5 237 431 81.9
DELTA
DETACHED 87 108 160 48.1 40 84 109 29.8 100 238 138.0
ATTACHED 22 33 45 36.4 14 23 33 43.5 40 66 65.0
APARTMENTS 30 42 65 54.8 17 28 68 142.9 55 114 107.3
MAPLE RIDGE/PITT MEADOWS
DETACHED 185 223 365 63.7 104 169 271 60.4 269 535 98.9
ATTACHED 88 77 131 70.1 66 89 97 9.0 162 254 56.8
APARTMENTS 84 86 101 17.4 29 73 101 38.4 99 223 125.3
NORTH VANCOUVER
DETACHED 130 127 278 118.9 69 88 175 98.9 164 308 87.8
ATTACHED 53 111 125 12.6 35 86 87 1.2 83 214 157.8
APARTMENTS 165 188 292 55.3 99 141 203 44.0 260 436 67.7
NEW WESTMINSTER
DETACHED 32 48 91 89.6 21 30 46 53.3 48 97 102.1
ATTACHED 21 15 30 100.0 16 21 25 19.0 27 60 122.2
APARTMENTS 143 153 209 36.6 81 111 173 55.9 182 350 92.3
PORT MOODY/BELCARRA
DETACHED 40 39 62 59.0 16 27 41 51.9 34 77 126.5
ATTACHED 31 26 47 80.8 16 25 32 28.0 36 66 83.3
APARTMENTS 31 41 72 75.6 22 39 58 48.7 57 125 119.3
PORT COQUITLAM
DETACHED 48 78 135 73.1 28 51 81 58.8 75 165 120.0
ATTACHED 35 34 43 26.5 30 25 45 80.0 63 88 39.7
APARTMENTS 58 60 130 116.7 38 44 77 75.0 101 158 56.4
RICHMOND
DETACHED 138 184 390 112.0 97 139 234 68.3 201 444 120.9
ATTACHED 110 137 220 60.6 73 115 184 60.0 195 363 86.2
APARTMENTS 274 264 464 75.8 165 197 343 74.1 402 682 69.7
SUNSHINE COAST
DETACHED 78 91 141 54.9 44 71 106 49.3 96 219 128.1
ATTACHED 17 18 7 -61.1 11 19 14 -26.3 17 41 141.2
APARTMENTS 11 6 27 350.0 3 11 13 18.2 14 34 142.9
SQUAMISH
DETACHED 39 51 55 7.8 18 32 46 43.8 45 97 115.6
ATTACHED 21 24 41 70.8 10 21 28 33.3 32 61 90.6
APARTMENTS 25 24 46 91.7 7 25 27 8.0 34 68 100.0
VANCOUVER EAST
DETACHED 188 227 451 98.7 109 137 244 78.1 248 490 97.6
ATTACHED 59 81 158 95.1 47 85 100 17.6 115 233 102.6
APARTMENTS 215 259 384 48.3 136 183 316 72.7 332 598 80.1
VANCOUVER WEST
DETACHED 151 146 362 147.9 106 87 146 67.8 203 302 48.8
ATTACHED 90 91 206 126.4 52 63 106 68.3 125 207 65.6
APARTMENTS 599 691 923 33.6 308 440 628 42.7 779 1353 73.7
WHISTLER/PEMBERTON
DETACHED 22 20 26 30.0 12 25 23 -8.0 29 63 117.2
ATTACHED 33 32 40 25.0 10 19 33 73.7 43 75 74.4
APARTMENTS 40 57 49 -14.0 16 44 56 27.3 52 140 169.2
WEST VANCOUVER/HOWE SOUND
DETACHED 109 113 224 98.2 41 78 98 25.6 107 205 91.6
ATTACHED 16 15 20 33.3 6 10 16 60.0 11 31 181.8
APARTMENTS 41 32 45 40.6 9 14 31 121.4 22 56 154.5
GRAND TOTALS
DETACHED 1499 1756 3363 91.5 847 1220 1955 60.2 1964 3909 99.0
ATTACHED 751 886 1396 57.6 493 736 1045 42.0 1213 2235 84.3
APARTMENTS 2174 2400 3514 46.4 1179 1759 2697 53.3 3054 5651 85.0
Residential
Average
Sale
Prices
-
January
1977
to
March
2021
0
500
1000
1500
2000
2500
1
9
7
7
1
9
7
8
1
9
7
9
1
9
8
0
1
9
8
1
1
9
8
2
1
9
8
3
1
9
8
4
1
9
8
5
1
9
8
6
1
9
8
7
1
9
8
8
1
9
8
9
1
9
9
0
1
9
9
1
1
9
9
2
1
9
9
3
1
9
9
4
1
9
9
5
1
9
9
6
1
9
9
7
1
9
9
8
1
9
9
9
2
0
0
0
2
0
0
1
2
0
0
2
2
0
0
3
2
0
0
4
2
0
0
5
2
0
0
6
2
0
0
7
2
0
0
8
2
0
0
9
2
0
1
0
2
0
1
1
2
0
1
2
2
0
1
3
2
0
1
4
2
0
1
5
2
0
1
6
2
0
1
7
2
0
1
8
2
0
1
9
2
0
2
0
2
0
2
1
DETACHED
CONDOMINIUM
ATTACHED
APARTMENTS
IN
THOUSANDS
($)
NOTE:
From
1977
-
1984
condominium
averages
were
not
separated
into
attached
&
apartment.
$1,040,882
$715,821
$1,958,189

More Related Content

What's hot

REBGV Statistics Package August 2020
REBGV Statistics Package August 2020REBGV Statistics Package August 2020
REBGV Statistics Package August 2020Vicky Aulakh
 
Rebgv stats-pkg-april-2019
Rebgv stats-pkg-april-2019Rebgv stats-pkg-april-2019
Rebgv stats-pkg-april-2019Kathryn Huang
 
Rebgv stats-pkg-july-2019
Rebgv stats-pkg-july-2019Rebgv stats-pkg-july-2019
Rebgv stats-pkg-july-2019Vicky Aulakh
 
Real Estate Board of Greater Vancouver Statistics Package November 2020
Real Estate Board of Greater Vancouver Statistics Package November 2020Real Estate Board of Greater Vancouver Statistics Package November 2020
Real Estate Board of Greater Vancouver Statistics Package November 2020Vicky Aulakh
 
May 2021 Real Estate Board of Greater Vancouver Statistics Package
May 2021 Real Estate Board of Greater Vancouver Statistics PackageMay 2021 Real Estate Board of Greater Vancouver Statistics Package
May 2021 Real Estate Board of Greater Vancouver Statistics PackageVicky Aulakh
 
Rebgv stats-pkg-june-2019
Rebgv stats-pkg-june-2019Rebgv stats-pkg-june-2019
Rebgv stats-pkg-june-2019Vicky Aulakh
 
Real Estate Board of Greater Vancouver Statistics Package July 2021
Real Estate Board of Greater Vancouver Statistics Package July 2021Real Estate Board of Greater Vancouver Statistics Package July 2021
Real Estate Board of Greater Vancouver Statistics Package July 2021Vicky Aulakh
 
Rebgv stats-pkg-march-2019
Rebgv stats-pkg-march-2019Rebgv stats-pkg-march-2019
Rebgv stats-pkg-march-2019Kathryn Huang
 
Rebgv stats-pkg-november-2019-f
Rebgv stats-pkg-november-2019-fRebgv stats-pkg-november-2019-f
Rebgv stats-pkg-november-2019-fVicky Aulakh
 
Rebgv stats-pkg-april-2020
Rebgv stats-pkg-april-2020Rebgv stats-pkg-april-2020
Rebgv stats-pkg-april-2020Vicky Aulakh
 
Rebgv stats-pkg-february-2020
Rebgv stats-pkg-february-2020Rebgv stats-pkg-february-2020
Rebgv stats-pkg-february-2020Vicky Aulakh
 
Rebgv Stats Package September 2020
Rebgv Stats Package September 2020Rebgv Stats Package September 2020
Rebgv Stats Package September 2020Vicky Aulakh
 
Rebgv stats-pkg-may-2019
Rebgv stats-pkg-may-2019Rebgv stats-pkg-may-2019
Rebgv stats-pkg-may-2019Kathryn Huang
 
REBGV Statistics Package October 2020
REBGV Statistics Package October 2020REBGV Statistics Package October 2020
REBGV Statistics Package October 2020Vicky Aulakh
 
REBGV January 2020 Statistics Package
REBGV January 2020 Statistics Package REBGV January 2020 Statistics Package
REBGV January 2020 Statistics Package Vicky Aulakh
 
Real Estate Board of Greater Vancouver Statistics Package August 2021
Real Estate Board of Greater Vancouver Statistics Package August 2021Real Estate Board of Greater Vancouver Statistics Package August 2021
Real Estate Board of Greater Vancouver Statistics Package August 2021Vicky Aulakh
 
Metro Vancouver Statistics Report October 2021
Metro Vancouver Statistics Report October 2021Metro Vancouver Statistics Report October 2021
Metro Vancouver Statistics Report October 2021VickyAulakh1
 
Real Estate Board of Greater Vancouver Statistics Package - November 2021
Real Estate Board of Greater Vancouver Statistics Package - November 2021Real Estate Board of Greater Vancouver Statistics Package - November 2021
Real Estate Board of Greater Vancouver Statistics Package - November 2021VickyAulakh1
 
REBGV Statistic Package December 2020
REBGV Statistic Package December 2020REBGV Statistic Package December 2020
REBGV Statistic Package December 2020Vicky Aulakh
 
Real Estate Board of Greater Vancouver Statistics Package February 2022
Real Estate Board of Greater Vancouver Statistics Package February 2022Real Estate Board of Greater Vancouver Statistics Package February 2022
Real Estate Board of Greater Vancouver Statistics Package February 2022Vicky Aulakh
 

What's hot (20)

REBGV Statistics Package August 2020
REBGV Statistics Package August 2020REBGV Statistics Package August 2020
REBGV Statistics Package August 2020
 
Rebgv stats-pkg-april-2019
Rebgv stats-pkg-april-2019Rebgv stats-pkg-april-2019
Rebgv stats-pkg-april-2019
 
Rebgv stats-pkg-july-2019
Rebgv stats-pkg-july-2019Rebgv stats-pkg-july-2019
Rebgv stats-pkg-july-2019
 
Real Estate Board of Greater Vancouver Statistics Package November 2020
Real Estate Board of Greater Vancouver Statistics Package November 2020Real Estate Board of Greater Vancouver Statistics Package November 2020
Real Estate Board of Greater Vancouver Statistics Package November 2020
 
May 2021 Real Estate Board of Greater Vancouver Statistics Package
May 2021 Real Estate Board of Greater Vancouver Statistics PackageMay 2021 Real Estate Board of Greater Vancouver Statistics Package
May 2021 Real Estate Board of Greater Vancouver Statistics Package
 
Rebgv stats-pkg-june-2019
Rebgv stats-pkg-june-2019Rebgv stats-pkg-june-2019
Rebgv stats-pkg-june-2019
 
Real Estate Board of Greater Vancouver Statistics Package July 2021
Real Estate Board of Greater Vancouver Statistics Package July 2021Real Estate Board of Greater Vancouver Statistics Package July 2021
Real Estate Board of Greater Vancouver Statistics Package July 2021
 
Rebgv stats-pkg-march-2019
Rebgv stats-pkg-march-2019Rebgv stats-pkg-march-2019
Rebgv stats-pkg-march-2019
 
Rebgv stats-pkg-november-2019-f
Rebgv stats-pkg-november-2019-fRebgv stats-pkg-november-2019-f
Rebgv stats-pkg-november-2019-f
 
Rebgv stats-pkg-april-2020
Rebgv stats-pkg-april-2020Rebgv stats-pkg-april-2020
Rebgv stats-pkg-april-2020
 
Rebgv stats-pkg-february-2020
Rebgv stats-pkg-february-2020Rebgv stats-pkg-february-2020
Rebgv stats-pkg-february-2020
 
Rebgv Stats Package September 2020
Rebgv Stats Package September 2020Rebgv Stats Package September 2020
Rebgv Stats Package September 2020
 
Rebgv stats-pkg-may-2019
Rebgv stats-pkg-may-2019Rebgv stats-pkg-may-2019
Rebgv stats-pkg-may-2019
 
REBGV Statistics Package October 2020
REBGV Statistics Package October 2020REBGV Statistics Package October 2020
REBGV Statistics Package October 2020
 
REBGV January 2020 Statistics Package
REBGV January 2020 Statistics Package REBGV January 2020 Statistics Package
REBGV January 2020 Statistics Package
 
Real Estate Board of Greater Vancouver Statistics Package August 2021
Real Estate Board of Greater Vancouver Statistics Package August 2021Real Estate Board of Greater Vancouver Statistics Package August 2021
Real Estate Board of Greater Vancouver Statistics Package August 2021
 
Metro Vancouver Statistics Report October 2021
Metro Vancouver Statistics Report October 2021Metro Vancouver Statistics Report October 2021
Metro Vancouver Statistics Report October 2021
 
Real Estate Board of Greater Vancouver Statistics Package - November 2021
Real Estate Board of Greater Vancouver Statistics Package - November 2021Real Estate Board of Greater Vancouver Statistics Package - November 2021
Real Estate Board of Greater Vancouver Statistics Package - November 2021
 
REBGV Statistic Package December 2020
REBGV Statistic Package December 2020REBGV Statistic Package December 2020
REBGV Statistic Package December 2020
 
Real Estate Board of Greater Vancouver Statistics Package February 2022
Real Estate Board of Greater Vancouver Statistics Package February 2022Real Estate Board of Greater Vancouver Statistics Package February 2022
Real Estate Board of Greater Vancouver Statistics Package February 2022
 

Similar to Real Estate Board of Greater Vancouver Statistics Package March 2021

Supply response emerges in Metro Vancouver’s active housing market
Supply response emerges in Metro Vancouver’s active housing marketSupply response emerges in Metro Vancouver’s active housing market
Supply response emerges in Metro Vancouver’s active housing marketAlexanderMackenzie13
 
March 2020 REBGV Statistics Package
March 2020 REBGV Statistics PackageMarch 2020 REBGV Statistics Package
March 2020 REBGV Statistics PackageMike Stewart
 
March 2020-rebgv-stats-pkg
March 2020-rebgv-stats-pkgMarch 2020-rebgv-stats-pkg
March 2020-rebgv-stats-pkgMatt Scalena
 
Real Estate Board of Greater Vancouver Statistics Package January 2021
Real Estate Board of Greater Vancouver Statistics Package January 2021 Real Estate Board of Greater Vancouver Statistics Package January 2021
Real Estate Board of Greater Vancouver Statistics Package January 2021 Vicky Aulakh
 
Rebgv stats-pkg-february-2018
Rebgv stats-pkg-february-2018Rebgv stats-pkg-february-2018
Rebgv stats-pkg-february-2018Kathryn Huang
 
Real Estate Board of Greater Vancouver - Statistics Package for July 2021
Real Estate Board of Greater Vancouver - Statistics Package for July 2021Real Estate Board of Greater Vancouver - Statistics Package for July 2021
Real Estate Board of Greater Vancouver - Statistics Package for July 2021Alexander Mackenzie, PMP
 
Real Estate Board of Greater Vancouver - Stats Package May 2021
Real Estate Board of Greater Vancouver - Stats Package May 2021Real Estate Board of Greater Vancouver - Stats Package May 2021
Real Estate Board of Greater Vancouver - Stats Package May 2021AlexanderMackenzie13
 
Rebgv stats-pkg-may-2021
Rebgv stats-pkg-may-2021Rebgv stats-pkg-may-2021
Rebgv stats-pkg-may-2021BC PRIME Realty
 
Rebgv stats-pkg-january-2019
Rebgv stats-pkg-january-2019Rebgv stats-pkg-january-2019
Rebgv stats-pkg-january-2019Kathryn Huang
 
January 2016 rebgv stats mike stewart realtor Corrected Feb 5 2016
January 2016 rebgv stats mike stewart realtor Corrected Feb 5 2016January 2016 rebgv stats mike stewart realtor Corrected Feb 5 2016
January 2016 rebgv stats mike stewart realtor Corrected Feb 5 2016Mike Stewart
 
Rebgv stats-pkg-september-2018
Rebgv stats-pkg-september-2018Rebgv stats-pkg-september-2018
Rebgv stats-pkg-september-2018Kathryn Huang
 
REBGV-Stats-Pkg-July-2022
REBGV-Stats-Pkg-July-2022REBGV-Stats-Pkg-July-2022
REBGV-Stats-Pkg-July-2022Vicky Aulakh
 
Real Estate Board of Greater Vancouver Statistics Package October 2021
Real Estate Board of Greater Vancouver Statistics Package October 2021Real Estate Board of Greater Vancouver Statistics Package October 2021
Real Estate Board of Greater Vancouver Statistics Package October 2021VickyAulakh1
 

Similar to Real Estate Board of Greater Vancouver Statistics Package March 2021 (16)

Supply response emerges in Metro Vancouver’s active housing market
Supply response emerges in Metro Vancouver’s active housing marketSupply response emerges in Metro Vancouver’s active housing market
Supply response emerges in Metro Vancouver’s active housing market
 
Rebgv stats-pkg-august-2021
Rebgv stats-pkg-august-2021Rebgv stats-pkg-august-2021
Rebgv stats-pkg-august-2021
 
March 2020 REBGV Statistics Package
March 2020 REBGV Statistics PackageMarch 2020 REBGV Statistics Package
March 2020 REBGV Statistics Package
 
March 2020-rebgv-stats-pkg
March 2020-rebgv-stats-pkgMarch 2020-rebgv-stats-pkg
March 2020-rebgv-stats-pkg
 
2021 June REBGV Stats Package
2021 June REBGV Stats Package2021 June REBGV Stats Package
2021 June REBGV Stats Package
 
Rebgv stats-pkg-november-2020
Rebgv stats-pkg-november-2020Rebgv stats-pkg-november-2020
Rebgv stats-pkg-november-2020
 
Real Estate Board of Greater Vancouver Statistics Package January 2021
Real Estate Board of Greater Vancouver Statistics Package January 2021 Real Estate Board of Greater Vancouver Statistics Package January 2021
Real Estate Board of Greater Vancouver Statistics Package January 2021
 
Rebgv stats-pkg-february-2018
Rebgv stats-pkg-february-2018Rebgv stats-pkg-february-2018
Rebgv stats-pkg-february-2018
 
Real Estate Board of Greater Vancouver - Statistics Package for July 2021
Real Estate Board of Greater Vancouver - Statistics Package for July 2021Real Estate Board of Greater Vancouver - Statistics Package for July 2021
Real Estate Board of Greater Vancouver - Statistics Package for July 2021
 
Real Estate Board of Greater Vancouver - Stats Package May 2021
Real Estate Board of Greater Vancouver - Stats Package May 2021Real Estate Board of Greater Vancouver - Stats Package May 2021
Real Estate Board of Greater Vancouver - Stats Package May 2021
 
Rebgv stats-pkg-may-2021
Rebgv stats-pkg-may-2021Rebgv stats-pkg-may-2021
Rebgv stats-pkg-may-2021
 
Rebgv stats-pkg-january-2019
Rebgv stats-pkg-january-2019Rebgv stats-pkg-january-2019
Rebgv stats-pkg-january-2019
 
January 2016 rebgv stats mike stewart realtor Corrected Feb 5 2016
January 2016 rebgv stats mike stewart realtor Corrected Feb 5 2016January 2016 rebgv stats mike stewart realtor Corrected Feb 5 2016
January 2016 rebgv stats mike stewart realtor Corrected Feb 5 2016
 
Rebgv stats-pkg-september-2018
Rebgv stats-pkg-september-2018Rebgv stats-pkg-september-2018
Rebgv stats-pkg-september-2018
 
REBGV-Stats-Pkg-July-2022
REBGV-Stats-Pkg-July-2022REBGV-Stats-Pkg-July-2022
REBGV-Stats-Pkg-July-2022
 
Real Estate Board of Greater Vancouver Statistics Package October 2021
Real Estate Board of Greater Vancouver Statistics Package October 2021Real Estate Board of Greater Vancouver Statistics Package October 2021
Real Estate Board of Greater Vancouver Statistics Package October 2021
 

More from Vicky Aulakh

Okanagan Statistics May2023.pdf
Okanagan Statistics May2023.pdfOkanagan Statistics May2023.pdf
Okanagan Statistics May2023.pdfVicky Aulakh
 
FVREB May 2023 Statistics Package.pdf
FVREB May 2023 Statistics Package.pdfFVREB May 2023 Statistics Package.pdf
FVREB May 2023 Statistics Package.pdfVicky Aulakh
 
Metro Vancouver Stats.pdf
Metro Vancouver Stats.pdfMetro Vancouver Stats.pdf
Metro Vancouver Stats.pdfVicky Aulakh
 
Okanagan Stats June 2022
Okanagan Stats June 2022Okanagan Stats June 2022
Okanagan Stats June 2022Vicky Aulakh
 
Okanagan Stats May 2022
Okanagan Stats May 2022Okanagan Stats May 2022
Okanagan Stats May 2022Vicky Aulakh
 
VREB June 2022 Stats
VREB June 2022 StatsVREB June 2022 Stats
VREB June 2022 StatsVicky Aulakh
 
FVREB June 2022 Stats
FVREB June 2022 StatsFVREB June 2022 Stats
FVREB June 2022 StatsVicky Aulakh
 
REBGV Statistics Package May 2022
REBGV Statistics Package May 2022REBGV Statistics Package May 2022
REBGV Statistics Package May 2022Vicky Aulakh
 
VREB May 2022 Statistics Package.pdf
VREB May 2022 Statistics Package.pdfVREB May 2022 Statistics Package.pdf
VREB May 2022 Statistics Package.pdfVicky Aulakh
 
The Okanagan Real Estate April 2022 Statistics
The Okanagan Real Estate April 2022 StatisticsThe Okanagan Real Estate April 2022 Statistics
The Okanagan Real Estate April 2022 StatisticsVicky Aulakh
 
FVREB April 2022 Stats Package .pdf
FVREB April 2022 Stats Package .pdfFVREB April 2022 Stats Package .pdf
FVREB April 2022 Stats Package .pdfVicky Aulakh
 
VREB April 2022 Stats Package .pdf
VREB April 2022 Stats Package .pdfVREB April 2022 Stats Package .pdf
VREB April 2022 Stats Package .pdfVicky Aulakh
 
REBGV-Stats-Pkg-April-2022.pdf
REBGV-Stats-Pkg-April-2022.pdfREBGV-Stats-Pkg-April-2022.pdf
REBGV-Stats-Pkg-April-2022.pdfVicky Aulakh
 
March 2022 Okanagan Statistics
March 2022 Okanagan StatisticsMarch 2022 Okanagan Statistics
March 2022 Okanagan StatisticsVicky Aulakh
 
FVREB Statistics Package March 2022
FVREB Statistics Package March 2022FVREB Statistics Package March 2022
FVREB Statistics Package March 2022Vicky Aulakh
 

More from Vicky Aulakh (20)

Okanagan Statistics May2023.pdf
Okanagan Statistics May2023.pdfOkanagan Statistics May2023.pdf
Okanagan Statistics May2023.pdf
 
FVREB May 2023 Statistics Package.pdf
FVREB May 2023 Statistics Package.pdfFVREB May 2023 Statistics Package.pdf
FVREB May 2023 Statistics Package.pdf
 
Metro Vancouver Stats.pdf
Metro Vancouver Stats.pdfMetro Vancouver Stats.pdf
Metro Vancouver Stats.pdf
 
FVREB July 2022
FVREB July 2022FVREB July 2022
FVREB July 2022
 
VREB July 2022
VREB July 2022VREB July 2022
VREB July 2022
 
BCRE June 2022
BCRE June 2022BCRE June 2022
BCRE June 2022
 
Okanagan Stats June 2022
Okanagan Stats June 2022Okanagan Stats June 2022
Okanagan Stats June 2022
 
Okanagan Stats May 2022
Okanagan Stats May 2022Okanagan Stats May 2022
Okanagan Stats May 2022
 
VREB June 2022 Stats
VREB June 2022 StatsVREB June 2022 Stats
VREB June 2022 Stats
 
FVREB June 2022 Stats
FVREB June 2022 StatsFVREB June 2022 Stats
FVREB June 2022 Stats
 
FVREB May 2022
FVREB May 2022FVREB May 2022
FVREB May 2022
 
REBGV Statistics Package May 2022
REBGV Statistics Package May 2022REBGV Statistics Package May 2022
REBGV Statistics Package May 2022
 
VREB May 2022 Statistics Package.pdf
VREB May 2022 Statistics Package.pdfVREB May 2022 Statistics Package.pdf
VREB May 2022 Statistics Package.pdf
 
The Okanagan Real Estate April 2022 Statistics
The Okanagan Real Estate April 2022 StatisticsThe Okanagan Real Estate April 2022 Statistics
The Okanagan Real Estate April 2022 Statistics
 
FVREB April 2022 Stats Package .pdf
FVREB April 2022 Stats Package .pdfFVREB April 2022 Stats Package .pdf
FVREB April 2022 Stats Package .pdf
 
VREB April 2022 Stats Package .pdf
VREB April 2022 Stats Package .pdfVREB April 2022 Stats Package .pdf
VREB April 2022 Stats Package .pdf
 
REBGV-Stats-Pkg-April-2022.pdf
REBGV-Stats-Pkg-April-2022.pdfREBGV-Stats-Pkg-April-2022.pdf
REBGV-Stats-Pkg-April-2022.pdf
 
BCREA.pdf
BCREA.pdfBCREA.pdf
BCREA.pdf
 
March 2022 Okanagan Statistics
March 2022 Okanagan StatisticsMarch 2022 Okanagan Statistics
March 2022 Okanagan Statistics
 
FVREB Statistics Package March 2022
FVREB Statistics Package March 2022FVREB Statistics Package March 2022
FVREB Statistics Package March 2022
 

Recently uploaded

9711199012 Call {Girls Delhi} Very Low rate Vaishali DownLoad PDF
9711199012 Call {Girls Delhi} Very Low rate Vaishali DownLoad PDF9711199012 Call {Girls Delhi} Very Low rate Vaishali DownLoad PDF
9711199012 Call {Girls Delhi} Very Low rate Vaishali DownLoad PDFMs Riya
 
8 Key Elements for Comfortable Farmland Living
8 Key Elements for Comfortable Farmland Living 8 Key Elements for Comfortable Farmland Living
8 Key Elements for Comfortable Farmland Living Farmland Bazaar
 
9990771857 Call Girls in Noida Sector 11 Noida (Call Girls) Delhi
9990771857 Call Girls in Noida Sector 11 Noida (Call Girls) Delhi9990771857 Call Girls in Noida Sector 11 Noida (Call Girls) Delhi
9990771857 Call Girls in Noida Sector 11 Noida (Call Girls) Delhidelhimodel235
 
Call Girls In Sahibabad Ghaziabad ❤️8860477959 Low Rate Escorts Service In 24...
Call Girls In Sahibabad Ghaziabad ❤️8860477959 Low Rate Escorts Service In 24...Call Girls In Sahibabad Ghaziabad ❤️8860477959 Low Rate Escorts Service In 24...
Call Girls In Sahibabad Ghaziabad ❤️8860477959 Low Rate Escorts Service In 24...lizamodels9
 
Call Girls in laxmi Nagar Delhi 💯Call Us 🔝 9582086666🔝 South Delhi Escorts Se...
Call Girls in laxmi Nagar Delhi 💯Call Us 🔝 9582086666🔝 South Delhi Escorts Se...Call Girls in laxmi Nagar Delhi 💯Call Us 🔝 9582086666🔝 South Delhi Escorts Se...
Call Girls in laxmi Nagar Delhi 💯Call Us 🔝 9582086666🔝 South Delhi Escorts Se...delhimodel235
 
SSPL The Strand Abodes Kharadi Pune Brochure.pdf
SSPL The Strand Abodes Kharadi Pune Brochure.pdfSSPL The Strand Abodes Kharadi Pune Brochure.pdf
SSPL The Strand Abodes Kharadi Pune Brochure.pdfabbu831446
 
Purva Palm Hills Devanahalli, Bangalore E- Brochure.pdf
Purva Palm Hills Devanahalli, Bangalore E- Brochure.pdfPurva Palm Hills Devanahalli, Bangalore E- Brochure.pdf
Purva Palm Hills Devanahalli, Bangalore E- Brochure.pdffaheemali990101
 
Building Dreams: Newman Leech's Visionary Approach to Real Estate Investment
Building Dreams: Newman Leech's Visionary Approach to Real Estate InvestmentBuilding Dreams: Newman Leech's Visionary Approach to Real Estate Investment
Building Dreams: Newman Leech's Visionary Approach to Real Estate InvestmentNewman George Leech
 
Eco-Efficient Living: Redefining Sustainability through Leech's Green Design ...
Eco-Efficient Living: Redefining Sustainability through Leech's Green Design ...Eco-Efficient Living: Redefining Sustainability through Leech's Green Design ...
Eco-Efficient Living: Redefining Sustainability through Leech's Green Design ...Newman George Leech
 
Model Call Girl in Shastri Nagar Delhi reach out to us at 🔝8264348440🔝
Model Call Girl in Shastri Nagar Delhi reach out to us at 🔝8264348440🔝Model Call Girl in Shastri Nagar Delhi reach out to us at 🔝8264348440🔝
Model Call Girl in Shastri Nagar Delhi reach out to us at 🔝8264348440🔝soniya singh
 
Call Girls In Vasundhara Ghaziabad ❤️8860477959 Low Rate Escorts Service In 2...
Call Girls In Vasundhara Ghaziabad ❤️8860477959 Low Rate Escorts Service In 2...Call Girls In Vasundhara Ghaziabad ❤️8860477959 Low Rate Escorts Service In 2...
Call Girls In Vasundhara Ghaziabad ❤️8860477959 Low Rate Escorts Service In 2...lizamodels9
 
9990771857 Call Girls in Noida Sector 06 Noida (Call Girls) Delhi
9990771857 Call Girls in Noida Sector 06 Noida (Call Girls) Delhi9990771857 Call Girls in Noida Sector 06 Noida (Call Girls) Delhi
9990771857 Call Girls in Noida Sector 06 Noida (Call Girls) Delhidelhimodel235
 
Call girls in Jeewan Park .Delhi↫8447779280↬ ꧂Escorts Service In Delhi Ncr
Call girls in Jeewan Park .Delhi↫8447779280↬ ꧂Escorts Service In Delhi NcrCall girls in Jeewan Park .Delhi↫8447779280↬ ꧂Escorts Service In Delhi Ncr
Call girls in Jeewan Park .Delhi↫8447779280↬ ꧂Escorts Service In Delhi Ncrasmaqueen5
 
Low Rate Call Girls in Triveni Complex Delhi Call 9990771857
Low Rate Call Girls in Triveni Complex Delhi Call 9990771857Low Rate Call Girls in Triveni Complex Delhi Call 9990771857
Low Rate Call Girls in Triveni Complex Delhi Call 9990771857delhimodel235
 
9990771857 Call Girls in Noida Sector 10 Noida (Call Girls) Delhi
9990771857 Call Girls in Noida Sector 10 Noida (Call Girls) Delhi9990771857 Call Girls in Noida Sector 10 Noida (Call Girls) Delhi
9990771857 Call Girls in Noida Sector 10 Noida (Call Girls) Delhidelhimodel235
 
Call Girls In Mundka Industrial Metro@꧂8447779280 ↬Enjoy ꧂Escort Service in ...
Call Girls In Mundka Industrial Metro@꧂8447779280 ↬Enjoy ꧂Escort Service in  ...Call Girls In Mundka Industrial Metro@꧂8447779280 ↬Enjoy ꧂Escort Service in  ...
Call Girls In Mundka Industrial Metro@꧂8447779280 ↬Enjoy ꧂Escort Service in ...asmaqueen5
 
Low Rate Call Girls In Madipur Slum Quarter +91)8447779280Low Rate 2 short 2...
Low Rate Call Girls In Madipur Slum Quarter  +91)8447779280Low Rate 2 short 2...Low Rate Call Girls In Madipur Slum Quarter  +91)8447779280Low Rate 2 short 2...
Low Rate Call Girls In Madipur Slum Quarter +91)8447779280Low Rate 2 short 2...asmaqueen5
 
83770-87607 ۞Call Girls In Near The Park Hotel (Cp) Delhi
83770-87607 ۞Call Girls In Near The Park Hotel (Cp) Delhi83770-87607 ۞Call Girls In Near The Park Hotel (Cp) Delhi
83770-87607 ۞Call Girls In Near The Park Hotel (Cp) Delhidollysharma2066
 

Recently uploaded (20)

9711199012 Call {Girls Delhi} Very Low rate Vaishali DownLoad PDF
9711199012 Call {Girls Delhi} Very Low rate Vaishali DownLoad PDF9711199012 Call {Girls Delhi} Very Low rate Vaishali DownLoad PDF
9711199012 Call {Girls Delhi} Very Low rate Vaishali DownLoad PDF
 
8 Key Elements for Comfortable Farmland Living
8 Key Elements for Comfortable Farmland Living 8 Key Elements for Comfortable Farmland Living
8 Key Elements for Comfortable Farmland Living
 
9990771857 Call Girls in Noida Sector 11 Noida (Call Girls) Delhi
9990771857 Call Girls in Noida Sector 11 Noida (Call Girls) Delhi9990771857 Call Girls in Noida Sector 11 Noida (Call Girls) Delhi
9990771857 Call Girls in Noida Sector 11 Noida (Call Girls) Delhi
 
Call Girls In Sahibabad Ghaziabad ❤️8860477959 Low Rate Escorts Service In 24...
Call Girls In Sahibabad Ghaziabad ❤️8860477959 Low Rate Escorts Service In 24...Call Girls In Sahibabad Ghaziabad ❤️8860477959 Low Rate Escorts Service In 24...
Call Girls In Sahibabad Ghaziabad ❤️8860477959 Low Rate Escorts Service In 24...
 
Call Girls in laxmi Nagar Delhi 💯Call Us 🔝 9582086666🔝 South Delhi Escorts Se...
Call Girls in laxmi Nagar Delhi 💯Call Us 🔝 9582086666🔝 South Delhi Escorts Se...Call Girls in laxmi Nagar Delhi 💯Call Us 🔝 9582086666🔝 South Delhi Escorts Se...
Call Girls in laxmi Nagar Delhi 💯Call Us 🔝 9582086666🔝 South Delhi Escorts Se...
 
SSPL The Strand Abodes Kharadi Pune Brochure.pdf
SSPL The Strand Abodes Kharadi Pune Brochure.pdfSSPL The Strand Abodes Kharadi Pune Brochure.pdf
SSPL The Strand Abodes Kharadi Pune Brochure.pdf
 
Purva Palm Hills Devanahalli, Bangalore E- Brochure.pdf
Purva Palm Hills Devanahalli, Bangalore E- Brochure.pdfPurva Palm Hills Devanahalli, Bangalore E- Brochure.pdf
Purva Palm Hills Devanahalli, Bangalore E- Brochure.pdf
 
Building Dreams: Newman Leech's Visionary Approach to Real Estate Investment
Building Dreams: Newman Leech's Visionary Approach to Real Estate InvestmentBuilding Dreams: Newman Leech's Visionary Approach to Real Estate Investment
Building Dreams: Newman Leech's Visionary Approach to Real Estate Investment
 
Eco-Efficient Living: Redefining Sustainability through Leech's Green Design ...
Eco-Efficient Living: Redefining Sustainability through Leech's Green Design ...Eco-Efficient Living: Redefining Sustainability through Leech's Green Design ...
Eco-Efficient Living: Redefining Sustainability through Leech's Green Design ...
 
Call Girls in Mahavir Nagar whatsaap call US +919953056974
Call Girls in Mahavir Nagar  whatsaap call US  +919953056974Call Girls in Mahavir Nagar  whatsaap call US  +919953056974
Call Girls in Mahavir Nagar whatsaap call US +919953056974
 
Low Rate Call Girls in Triveni Complex Delhi Call 9873940964
Low Rate Call Girls in Triveni Complex Delhi Call 9873940964Low Rate Call Girls in Triveni Complex Delhi Call 9873940964
Low Rate Call Girls in Triveni Complex Delhi Call 9873940964
 
Model Call Girl in Shastri Nagar Delhi reach out to us at 🔝8264348440🔝
Model Call Girl in Shastri Nagar Delhi reach out to us at 🔝8264348440🔝Model Call Girl in Shastri Nagar Delhi reach out to us at 🔝8264348440🔝
Model Call Girl in Shastri Nagar Delhi reach out to us at 🔝8264348440🔝
 
Call Girls In Vasundhara Ghaziabad ❤️8860477959 Low Rate Escorts Service In 2...
Call Girls In Vasundhara Ghaziabad ❤️8860477959 Low Rate Escorts Service In 2...Call Girls In Vasundhara Ghaziabad ❤️8860477959 Low Rate Escorts Service In 2...
Call Girls In Vasundhara Ghaziabad ❤️8860477959 Low Rate Escorts Service In 2...
 
9990771857 Call Girls in Noida Sector 06 Noida (Call Girls) Delhi
9990771857 Call Girls in Noida Sector 06 Noida (Call Girls) Delhi9990771857 Call Girls in Noida Sector 06 Noida (Call Girls) Delhi
9990771857 Call Girls in Noida Sector 06 Noida (Call Girls) Delhi
 
Call girls in Jeewan Park .Delhi↫8447779280↬ ꧂Escorts Service In Delhi Ncr
Call girls in Jeewan Park .Delhi↫8447779280↬ ꧂Escorts Service In Delhi NcrCall girls in Jeewan Park .Delhi↫8447779280↬ ꧂Escorts Service In Delhi Ncr
Call girls in Jeewan Park .Delhi↫8447779280↬ ꧂Escorts Service In Delhi Ncr
 
Low Rate Call Girls in Triveni Complex Delhi Call 9990771857
Low Rate Call Girls in Triveni Complex Delhi Call 9990771857Low Rate Call Girls in Triveni Complex Delhi Call 9990771857
Low Rate Call Girls in Triveni Complex Delhi Call 9990771857
 
9990771857 Call Girls in Noida Sector 10 Noida (Call Girls) Delhi
9990771857 Call Girls in Noida Sector 10 Noida (Call Girls) Delhi9990771857 Call Girls in Noida Sector 10 Noida (Call Girls) Delhi
9990771857 Call Girls in Noida Sector 10 Noida (Call Girls) Delhi
 
Call Girls In Mundka Industrial Metro@꧂8447779280 ↬Enjoy ꧂Escort Service in ...
Call Girls In Mundka Industrial Metro@꧂8447779280 ↬Enjoy ꧂Escort Service in  ...Call Girls In Mundka Industrial Metro@꧂8447779280 ↬Enjoy ꧂Escort Service in  ...
Call Girls In Mundka Industrial Metro@꧂8447779280 ↬Enjoy ꧂Escort Service in ...
 
Low Rate Call Girls In Madipur Slum Quarter +91)8447779280Low Rate 2 short 2...
Low Rate Call Girls In Madipur Slum Quarter  +91)8447779280Low Rate 2 short 2...Low Rate Call Girls In Madipur Slum Quarter  +91)8447779280Low Rate 2 short 2...
Low Rate Call Girls In Madipur Slum Quarter +91)8447779280Low Rate 2 short 2...
 
83770-87607 ۞Call Girls In Near The Park Hotel (Cp) Delhi
83770-87607 ۞Call Girls In Near The Park Hotel (Cp) Delhi83770-87607 ۞Call Girls In Near The Park Hotel (Cp) Delhi
83770-87607 ۞Call Girls In Near The Park Hotel (Cp) Delhi
 

Real Estate Board of Greater Vancouver Statistics Package March 2021