
Recommended
Recommended
More Related Content
What's hot
What's hot (17)
Similar to Home sales dip to lowest March level in over 30 years in Metro Vancouver
Similar to Home sales dip to lowest March level in over 30 years in Metro Vancouver (20)
More from Kathryn Huang
More from Kathryn Huang (11)
Recently uploaded
Recently uploaded (20)
Home sales dip to lowest March level in over 30 years in Metro Vancouver
- 1. News Release FOR IMMEDIATE RELEASE: Prospective home buyers remain on the sidelines in March VANCOUVER, BC – April 2, 2019 – Metro Vancouver* home sales dipped to the lowest levels seen in March in more than three decades. The Real Estate Board of Greater Vancouver (REBGV) reports that residential home sales in the region totalled 1,727 in March 2019, a 31.4 per cent decrease from the 2,517 sales recorded in March 2018, and a 16.4 per cent increase from the 1,484 homes sold in February 2019. Last month’s sales were 46.3 per cent below the 10-year March sales average and was the lowest total for the month since 1986. "Housing demand today isn’t aligning with our growing economy and low unemployment rates. The market trends we’re seeing are largely policy induced," Ashley Smith, REBGV president said. "For three years, governments at all levels have imposed new taxes and borrowing requirements on to the housing market.” “What policymakers are failing to recognize is that demand-side measures don’t eliminate demand, they sideline potential home buyers in the short term. That demand is ultimately satisfied down the line because shelter needs don’t go away. Using public policy to delay local demand in the housing market just feeds disruptive cycles that have been so well-documented in our region." There were 4,949 detached, attached and apartment properties newly listed for sale on the Multiple Listing Service® (MLS®) in Metro Vancouver in March 2019. This represents an 11.2 per cent increase compared to the 4,450 homes listed in March 2018 and a 27.2 per cent increase compared to February 2019 when 3,892 homes were listed. The total number of homes currently listed for sale on the MLS® system in Metro Vancouver is 12,774, a 52.4 per cent increase compared to March 2018 (8,380) and a 10.2 per cent increase compared to February 2019 (11,590). For all property types, the sales-to-active listings ratio for March 2019 is 13.5 per cent. By property type, the ratio is 9.4 per cent for detached homes, 15.9 per cent for townhomes, and 17.2 per cent for apartments. Generally, analysts say downward pressure on home prices occurs when the ratio dips below 12 per cent for a sustained period, while home prices often experience upward pressure when it surpasses 20 per cent over several months.
- 2. The MLS® Home Price Index composite benchmark price for all residential properties in Metro Vancouver is currently $1,011,200. This represents a 7.7 per cent decrease from March 2018, and a 0.5 per cent decrease compared to February 2019. Sales of detached homes in March 2019 reached 529, a 26.7 per cent decrease from the 722 sales in March 2018. The benchmark price for a detached home is $1,437,100. This represents a 10.5 per cent decrease from March 2018, and a 0.4 per cent decrease compared to February 2019. Sales of apartment homes reached 873 in March 2019, a 35.3 per cent decrease compared to the 1,349 sales in March 2018. The benchmark price of an apartment property is $656,900. This represents a 5.9 per cent decrease from March 2018, and a 0.5 per cent decrease compared to February 2019. Attached home sales in March 2019 totalled 325, a 27.1 per cent decrease compared to the 446 sales in March 2018. The benchmark price of an attached home is $783,600. This represents a six per cent decrease from March 2018, and a 0.7 per cent decrease compared to February 2019. -30- *Editor’s Note: Areas covered by the Real Estate Board of Greater Vancouver include: Burnaby, Coquitlam, Maple Ridge, New Westminster, North Vancouver, Pitt Meadows, Port Coquitlam, Port Moody, Richmond, South Delta, Squamish, Sunshine Coast, Vancouver, West Vancouver, and Whistler. The real estate industry is a key economic driver in British Columbia. In 2018, 24,619 homes changed ownership in the Board’s area, generating $1.7 billion in economic spin-off activity and an estimated 11,720 jobs. The total dollar value of residential sales transacted through the MLS® system in Greater Vancouver totalled $26 billion in 2018. The Real Estate Board of Greater Vancouver is an association representing more than 14,000 REALTORS® and their companies. The Board provides a variety of member services, including the Multiple Listing Service®. For more information on real estate, statistics, and buying or selling a home, contact a local REALTOR® or visit www.rebgv.org. For more information please contact: Craig Munn Manager, Communication Real Estate Board of Greater Vancouver 604.730.3146 cmunn@rebgv.org
- 3. Property Type Area Benchmark Price Price Index 1 Month Change % 3 Month Change % 6 Month Change % 1 Year Change % 3 Year Change % 5 Year Change % 10 Year Change % Residential / Composite Lower Mainland $955,100 262.2 0.0% -1.5% -4.8% -6.3% 27.5% 66.7% 103.1% Greater Vancouver $1,011,200 261.8 -0.5% -2.1% -5.6% -7.7% 21.2% 60.9% 102.5% Bowen Island $987,500 214.1 -0.3% -1.4% 1.3% 0.9% 51.1% 74.3% 76.2% Burnaby East $939,200 260.5 -1.1% -3.1% -6.6% -8.3% 20.9% 58.6% 102.3% Burnaby North $870,000 262.7 0.7% -2.3% -6.3% -6.7% 25.6% 64.7% 102.5% Burnaby South $981,400 277.2 -1.1% -1.1% -4.1% -6.8% 31.7% 68.4% 114.4% Coquitlam $904,200 268.2 -1.1% -1.8% -5.8% -5.8% 28.7% 74.6% 114.0% Ladner $830,500 233.1 1.1% -2.4% -5.8% -4.9% 10.4% 52.4% 78.2% Maple Ridge $752,700 239.7 0.8% -1.9% -4.8% -5.1% 43.5% 79.7% 90.5% New Westminster $649,500 285.4 0.0% -4.3% -6.2% -6.0% 38.1% 75.3% 112.7% North Vancouver $1,018,100 232.1 0.6% -1.7% -6.0% -9.2% 16.9% 55.9% 90.6% Pitt Meadows $749,900 272.6 0.1% -1.7% -4.1% -3.6% 52.5% 86.8% 110.0% Port Coquitlam $745,200 255.1 -1.5% -0.7% -3.5% -7.0% 31.9% 76.2% 97.0% Port Moody $905,200 250.2 1.0% -1.8% -5.5% -5.4% 28.3% 72.8% 102.6% Richmond $961,800 277.1 -0.7% -2.8% -6.7% -7.5% 19.7% 60.2% 109.6% Squamish $754,800 236.9 -0.3% 0.6% -3.5% -3.5% 42.7% 93.9% 85.8% Sunshine Coast $610,000 213.7 0.2% -1.7% 1.1% 0.0% 47.7% 79.1% 74.0% Tsawwassen $932,100 234.1 -2.5% -3.5% -8.3% -8.5% 8.1% 53.4% 82.6% Vancouver East $1,025,200 300.2 -0.6% -1.3% -6.4% -8.2% 19.4% 62.3% 120.9% Vancouver West $1,239,700 261.4 -1.6% -2.6% -5.3% -10.1% 10.4% 47.9% 100.9% West Vancouver $2,212,900 237.9 -0.7% -3.3% -7.7% -16.7% -6.2% 34.3% 100.4% Whistler $906,000 196.2 0.2% 1.0% -4.2% -4.5% 46.7% 94.6% 53.2% Single Family Detached Lower Mainland $1,230,600 261.2 0.0% -1.7% -4.9% -7.9% 14.2% 58.5% 107.1% Greater Vancouver $1,437,100 264.6 -0.4% -2.8% -6.7% -10.5% 6.4% 51.5% 108.2% Bowen Island $987,500 214.1 -0.3% -1.4% 1.3% 0.9% 51.1% 74.3% 76.2% Burnaby East $1,154,700 258.2 -1.5% -0.1% -7.5% -11.8% 5.6% 51.7% 107.4% Burnaby North $1,411,700 273.0 0.8% -2.6% -5.8% -8.6% 3.8% 50.2% 111.1% Burnaby South $1,545,200 295.8 0.2% -1.6% -2.8% -7.7% 10.8% 56.6% 136.5% Coquitlam $1,161,600 257.8 -1.8% -4.3% -9.6% -10.0% 10.4% 59.7% 107.4% Ladner $954,600 230.1 2.3% -1.0% -5.2% -5.3% 4.2% 51.5% 79.9% Maple Ridge $813,600 231.8 0.8% -1.3% -5.9% -4.5% 35.2% 78.4% 92.2% New Westminster $1,038,300 259.0 -2.0% -1.9% -7.1% -11.8% 6.5% 53.0% 106.5% North Vancouver $1,502,600 235.0 0.7% -2.6% -7.3% -12.8% 3.8% 54.1% 96.5% Pitt Meadows $912,700 257.2 1.9% 0.1% -1.6% -2.2% 37.9% 85.0% 108.6% Port Coquitlam $920,700 245.5 -0.8% -2.8% -6.5% -10.4% 11.5% 64.1% 98.6% Port Moody $1,402,500 259.0 -0.1% -5.6% -6.8% -5.5% 14.6% 60.0% 105.7% Richmond $1,546,500 299.6 0.0% -2.9% -7.0% -12.6% 3.5% 54.4% 123.6% Squamish $980,300 247.8 -2.3% 0.5% -0.5% -2.2% 44.6% 95.9% 100.3% Sunshine Coast $604,600 211.8 0.1% -1.5% 0.7% -0.2% 46.9% 78.6% 72.3% Tsawwassen $1,161,100 250.0 -2.6% -2.6% -8.3% -8.9% 4.5% 57.2% 99.8% Vancouver East $1,390,700 307.4 -1.6% -3.9% -7.5% -10.5% 7.9% 56.9% 134.5% Vancouver West $3,026,300 310.7 -0.1% -3.5% -7.0% -12.3% -1.5% 38.9% 128.1% West Vancouver $2,583,600 243.9 -1.3% -3.4% -7.0% -17.1% -9.1% 32.0% 107.2% Whistler $1,705,700 217.9 -2.0% 0.4% -2.2% -3.4% 42.3% 84.0% 74.3% HOW TO READ THE TABLE: • Benchmark Price: Estimated sale price of a benchmark property. Benchmarks represent a typical property within each market. • Price Index: Index numbers estimate the percentage change in price on typical and constant quality properties over time. All figures are based on past sales. • x Month/Year Change %: Percentage change of index over a period of x month(s)/year(s) * In January 2005, the indexes are set to 100. Townhome properties are similar to Attached properties, a category that was used in the previous MLSLink HPI, but do not included duplexes. The above info is deemed reliable, but is not guaranteed. All dollar amounts in CDN. March 2019* * MLS®, Multiple Listing Service®, and all related graphics are trademarks of The Canadian Real Estate Association 1 of 15
- 4. Property Type Area Benchmark Price Price Index 1 Month Change % 3 Month Change % 6 Month Change % 1 Year Change % 3 Year Change % 5 Year Change % 10 Year Change % March 2019* Townhouse Lower Mainland $665,100 239.9 -0.2% -3.0% -6.0% -5.5% 34.5% 65.1% 86.3% Greater Vancouver $783,600 249.4 -0.7% -3.2% -6.5% -6.0% 27.6% 62.5% 91.4% Burnaby East $671,400 248.0 -2.3% -3.6% -6.6% -2.7% 44.9% 59.2% 89.0% Burnaby North $726,000 271.0 1.5% 0.2% -5.5% -3.7% 31.6% 68.4% 103.6% Burnaby South $779,500 268.5 -3.5% -1.4% -5.3% -5.8% 37.2% 65.5% 101.3% Coquitlam $638,500 234.3 -2.7% -4.4% -6.9% -7.4% 24.7% 61.4% 85.2% Ladner $732,700 255.5 0.7% -3.7% -6.8% -6.0% 15.8% 51.0% 87.2% Maple Ridge $534,200 248.0 1.7% -3.3% -4.4% -7.1% 52.8% 76.4% 87.0% New Westminster $691,900 273.6 -0.7% -3.1% -5.2% -2.4% 28.1% 64.0% 103.9% North Vancouver $952,700 231.5 -0.4% -4.2% -6.8% -5.2% 24.2% 59.4% 90.1% Pitt Meadows $610,100 264.0 -0.9% -4.1% -7.2% -2.6% 55.8% 84.1% 101.5% Port Coquitlam $613,900 232.4 -1.2% -3.1% -7.0% -8.6% 24.3% 66.0% 78.9% Port Moody $636,200 215.0 -0.1% -3.8% -5.9% -3.6% 22.0% 57.2% 71.5% Richmond $791,500 260.1 -0.6% -3.5% -8.2% -4.7% 25.7% 54.6% 96.9% Squamish $655,100 223.4 -0.4% -1.7% -9.8% -5.9% 30.4% 76.7% 77.3% Tsawwassen $705,000 262.6 0.3% -5.8% -8.5% -6.6% 16.7% 50.1% 92.4% Vancouver East $821,300 269.6 -0.3% -3.4% -6.0% -9.6% 13.8% 60.7% 97.4% Vancouver West $1,184,500 261.6 -2.0% -4.2% -3.6% -6.8% 19.5% 62.7% 103.4% Whistler $872,800 218.3 -0.7% -1.0% -8.7% -5.1% 39.4% 84.7% 73.3% Apartment Lower Mainland $645,800 272.9 0.2% -0.7% -4.3% -5.2% 46.6% 78.5% 104.9% Greater Vancouver $656,900 263.6 -0.5% -1.1% -4.4% -5.9% 38.6% 70.9% 101.4% Burnaby East $722,500 277.2 0.5% -6.2% -5.9% -10.4% 35.1% 64.7% 101.3% Burnaby North $602,900 257.4 0.5% -2.6% -6.5% -6.0% 48.4% 77.5% 100.3% Burnaby South $681,400 273.6 -1.2% -0.6% -4.0% -6.3% 47.4% 78.9% 109.3% Coquitlam $522,800 286.9 -0.1% 0.7% -2.7% -2.5% 57.6% 97.2% 127.5% Ladner $432,600 205.0 -2.9% -6.3% -8.0% -5.8% 23.2% 46.7% 51.6% Maple Ridge $352,500 251.7 -0.3% -2.3% -3.2% -5.6% 63.7% 80.2% 79.5% New Westminster $516,800 292.8 0.3% -5.0% -6.3% -5.4% 53.0% 83.2% 113.9% North Vancouver $567,000 227.5 1.0% 0.0% -4.8% -7.0% 35.9% 57.3% 83.2% Pitt Meadows $492,500 290.4 -1.0% -2.1% -5.3% -7.6% 65.5% 87.6% 107.1% Port Coquitlam $459,900 275.0 -2.0% 1.9% 0.5% -3.9% 65.6% 92.8% 100.7% Port Moody $635,200 264.7 2.0% 1.3% -4.7% -5.9% 48.5% 92.9% 120.6% Richmond $653,400 272.8 -1.0% -2.3% -5.4% -3.3% 47.5% 75.2% 108.6% Squamish $469,400 226.1 2.3% 3.0% -2.8% -4.4% 51.2% 125.9% 69.0% Tsawwassen $465,000 196.1 -2.5% -5.5% -7.2% -5.2% 29.6% 52.3% 45.0% Vancouver East $547,700 302.2 0.5% 1.8% -4.8% -5.2% 40.4% 71.9% 111.9% Vancouver West $769,200 249.6 -1.9% -1.8% -4.3% -8.9% 20.4% 56.5% 94.2% West Vancouver $1,116,200 226.1 1.1% -2.2% -8.1% -12.7% 21.3% 57.0% 85.6% Whistler $511,200 167.6 2.9% 2.9% -1.9% -4.5% 65.6% 156.3% 26.7% HOW TO READ THE TABLE: • Benchmark Price: Estimated sale price of a benchmark property. Benchmarks represent a typical property within each market. • Price Index: Index numbers estimate the percentage change in price on typical and constant quality properties over time. All figures are based on past sales. • x Month/Year Change %: Percentage change of index over a period of x month(s)/year(s) In January 2005, the indexes are set to 100. * Townhome properties are similar to attached properties, a category that was used in the previous MLSLink HPI, but do not included duplexes. Lower Mainland includes areas serviced by both Real Estate Board of Greater Vancouver & Fraser Valley Real Estate Board. The above info is deemed reliable, but is not guaranteed. All dollar amounts in CDN. * MLS®, Multiple Listing Service®, and all related graphics are trademarks of The Canadian Real Estate Association 2 of 15
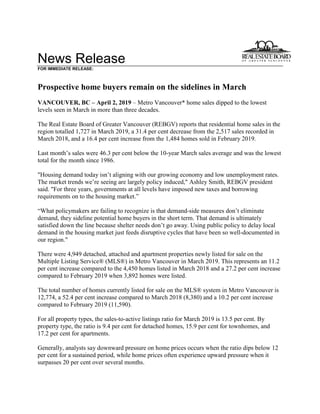
- 5. C:DATAMonthEndHpiexporthi_resgv-hpi2.tifGreaterVancouver 5YearTrend 60 110 160 210 260 310 Mar 2014 May 2014 Jul 2014 Sep 2014 Nov 2014 Jan 2015 Mar 2015 May 2015 Jul 2015 Sep 2015 Nov 2015 Jan 2016 Mar 2016 May 2016 Jul 2016 Sep 2016 Nov 2016 Jan 2017 Mar 2017 May 2017 Jul 2017 Sep 2017 Nov 2017 Jan 2018 Mar 2018 May 2018 Jul 2018 Sep 2018 Nov 2018 Jan 2019 Mar 2019 Price Index ResidentialDetachedTownhouseApartment Jan2005HPI=100
- 8. Listing & Sales Activity Summary Listings Sales 1 2 3 Col. 2 & 3 5 6 7 Col. 6 & 7 9 10 Col. 9 & 10 Mar Feb Mar Percentage Mar Feb Mar Percentage Jan 2018 - Jan 2019 - Percentage 2018 2019 2019 Variance 2018 2019 2019 Variance Mar 2018 Mar 2019 Variance BURNABY % % % DETACHED 154 115 163 41.7 50 30 36 20.0 158 92 -41.8 ATTACHED 88 69 119 72.5 58 29 43 48.3 153 96 -37.3 APARTMENTS 205 215 279 29.8 150 124 111 -10.5 406 315 -22.4 COQUITLAM DETACHED 159 122 169 38.5 78 38 48 26.3 194 113 -41.8 ATTACHED 48 64 83 29.7 35 31 33 6.5 84 82 -2.4 APARTMENTS 112 102 157 53.9 91 65 61 -6.2 258 168 -34.9 DELTA DETACHED 89 61 100 63.9 34 18 22 22.2 78 56 -28.2 ATTACHED 11 26 23 -11.5 9 8 12 50.0 24 27 12.5 APARTMENTS 39 18 33 83.3 20 14 6 -57.1 44 26 -40.9 MAPLE RIDGE/PITT MEADOWS DETACHED 178 133 173 30.1 113 57 60 5.3 272 156 -42.6 ATTACHED 60 61 85 39.3 47 33 47 42.4 128 113 -11.7 APARTMENTS 67 47 53 12.8 53 23 32 39.1 200 75 -62.5 NORTH VANCOUVER DETACHED 157 120 147 22.5 67 37 70 89.2 155 142 -8.4 ATTACHED 57 52 66 26.9 30 27 22 -18.5 77 64 -16.9 APARTMENTS 143 155 174 12.3 117 59 73 23.7 279 173 -38.0 NEW WESTMINSTER DETACHED 35 27 44 63.0 20 13 11 -15.4 53 34 -35.8 ATTACHED 17 15 16 6.7 15 7 5 -28.6 40 22 -45.0 APARTMENTS 141 120 142 18.3 111 42 65 54.8 249 162 -34.9 PORT MOODY/BELCARRA DETACHED 24 29 28 -3.4 7 10 7 -30.0 18 25 38.9 ATTACHED 22 16 21 31.3 17 5 8 60.0 40 18 -55.0 APARTMENTS 34 31 44 41.9 33 15 23 53.3 87 56 -35.6 PORT COQUITLAM DETACHED 52 47 54 14.9 31 17 16 -5.9 71 46 -35.2 ATTACHED 27 34 39 14.7 30 16 19 18.8 65 44 -32.3 APARTMENTS 46 58 74 27.6 41 21 24 14.3 108 61 -43.5 RICHMOND DETACHED 213 160 224 40.0 77 36 54 50.0 195 120 -38.5 ATTACHED 116 87 144 65.5 67 29 30 3.4 194 84 -56.7 APARTMENTS 275 226 302 33.6 161 89 94 5.6 449 249 -44.5 SUNSHINE COAST DETACHED 103 74 115 55.4 44 36 38 5.6 115 93 -19.1 ATTACHED 16 8 14 75.0 9 7 2 -71.4 21 14 -33.3 APARTMENTS 10 12 28 133.3 10 6 11 83.3 20 19 -5.0 SQUAMISH DETACHED 36 39 42 7.7 25 16 16 0.0 49 40 -18.4 ATTACHED 14 25 18 -28.0 14 18 19 5.6 44 45 2.3 APARTMENTS 16 10 19 90.0 8 5 14 180.0 32 27 -15.6 VANCOUVER EAST DETACHED 235 153 210 37.3 83 54 53 -1.9 205 151 -26.3 ATTACHED 73 62 65 4.8 44 31 28 -9.7 106 72 -32.1 APARTMENTS 201 168 226 34.5 156 81 93 14.8 350 222 -36.6 VANCOUVER WEST DETACHED 230 188 188 0.0 53 43 64 48.8 152 141 -7.2 ATTACHED 90 94 113 20.2 39 24 34 41.7 107 78 -27.1 APARTMENTS 565 600 688 14.7 349 186 235 26.3 924 554 -40.0 WHISTLER/PEMBERTON DETACHED 26 15 21 40.0 9 10 11 10.0 43 30 -30.2 ATTACHED 52 30 36 20.0 30 9 20 122.2 71 41 -42.3 APARTMENTS 47 35 35 0.0 35 18 23 27.8 91 58 -36.3 WEST VANCOUVER/HOWE SOUND DETACHED 109 113 120 6.2 26 25 23 -8.0 65 66 1.5 ATTACHED 12 14 12 -14.3 2 3 3 0.0 11 7 -36.4 APARTMENTS 32 40 30 -25.0 14 11 8 -27.3 49 26 -46.9 GRAND TOTALS DETACHED 1800 1396 1798 28.8 717 440 529 20.2 1823 1305 -28.4 ATTACHED 703 657 854 30.0 446 277 325 17.3 1165 807 -30.7 APARTMENTS 1933 1837 2284 24.3 1349 759 873 15.0 3546 2191 -38.2