SlideShare a Scribd company logo
1 of 9
Download to read offline
News Release
FOR IMMEDIATE RELEASE:
Metro Vancouver home sales and listings surge in September
VANCOUVER, BC ā€“ October 2, 2020 ā€“ Home sale and new listing activity reached record
levels in Metro Vancouver* in September.
The Real Estate Board of Greater Vancouver (REBGV) reports that residential home sales in the
region totalled 3,643 in September 2020, a 56.2 per cent increase from the 2,333 sales recorded
in September 2019, and a 19.6 per cent increase from the 3,047 homes sold in August 2020.
Last monthā€™s sales were 44.8 per cent above the 10-year September sales average and is the
highest total on record for the month.
ā€œWe've seen robust home sale and listing activity across Metro Vancouver throughout the
summer months," Colette Gerber, REBGV Chair said. "This increased activity can be attributed,
in part, to lower interest rates and changing housing needs during the COVID-19 pandemic."
There were 6,402 detached, attached and apartment properties newly listed for sale on the
Multiple Listing ServiceĀ® (MLSĀ®) in Metro Vancouver in September 2020. This represents a
31.6 per cent increase compared to the 4,866 homes listed in September 2019 and a 10.1 per cent
increase compared to August 2020 when 5,813 homes were listed.
The total number of homes currently listed for sale on the MLSĀ® system in Metro Vancouver is
13,096, a 2.6 per cent decrease compared to September 2019 (13,439) and a 2.3 per cent increase
compared to August 2020 (12,803).
"While the pace of new MLSĀ® listings entering the market is increasing, the heightened demand
from home buyers is keeping overall supply levels down," Gerber said. "This is creating upward
pressure on home prices, which have been edging up since the spring."
For all property types, the sales-to-active listings ratio for September 2020 is 27.8 per cent. By
property type, the ratio is 28.3 per cent for detached homes, 36.1 per cent for townhomes, and
24.8 per cent for apartments.
Generally, analysts say downward pressure on home prices occurs when the ratio dips below 12
per cent for a sustained period, while home prices often experience upward pressure when it
surpasses 20 per cent over several months.
The MLSĀ® Home Price Index composite benchmark price for all residential properties in Metro
Vancouver is currently $1,041,300. This represents a 5.8 per cent increase over September 2019,
and a 0.3 per cent increase compared to August 2020.
Sales of detached homes in September 2020 reached 1,317, a 76.8 per cent increase from the 745
detached sales recorded in September 2019. The benchmark price for detached properties is
$1,507,500. This represents a 7.8 per cent increase from September 2019 and a 1.1 per cent
increase compared to August 2020.
Sales of apartment homes reached 1,596 in September 2020, a 36.9 per cent increase compared
to the 1,166 sales in September 2019. The benchmark price of an apartment property is
$683,500. This represents a 4.5 per cent increase from September 2019 and a 0.3 per cent
decrease compared to August 2020.
Attached home sales in September 2020 totalled 730, a 73 per cent increase compared to the 422
sales in September 2019. The benchmark price of an attached unit is $809,900. This represents a
5.2 per cent increase from September 2019 and a 0.4 per cent increase compared to August 2020.
-30-
*Editorā€™s Note: Areas covered by the Real Estate Board of Greater Vancouver include: Burnaby, Coquitlam, Maple
Ridge, New Westminster, North Vancouver, Pitt Meadows, Port Coquitlam, Port Moody, Richmond, South Delta,
Squamish, Sunshine Coast, Vancouver, West Vancouver, and Whistler.
The real estate industry is a key economic driver in British Columbia. In 2019, 25,351 homes changed ownership in
the Boardā€™s area, generating $1.8 billion in economic spin-off activity and an estimated 12,910 jobs. The total dollar
value of residential sales transacted through the MLSĀ® system in Greater Vancouver totalled $25.3 billion in 2019.
The Real Estate Board of Greater Vancouver is an association representing more than 14,000 REALTORSĀ® and
their companies. The Board provides a variety of member services, including the Multiple Listing ServiceĀ®. For
more information on real estate, statistics, and buying or selling a home, contact a local REALTORĀ® or visit
www.rebgv.org.
For more information please contact:
Mark Moldowan
Senior Writer & Communication Strategist
Real Estate Board of Greater Vancouver
604.730.3153
mmoldowan@rebgv.org
Property Type Area
Benchmark
Price
Price
Index
1 Month
Change %
3 Month
Change %
6 Month
Change %
1 Year
Change %
3 Year
Change %
5 Year
Change %
10 Year
Change %
Residential / Composite Lower Mainland $979,800 274.5 0.4% 1.7% 1.8% 5.8% 3.6% 50.9% 87.9%
Greater Vancouver $1,041,300 273.2 0.3% 1.6% 1.4% 5.8% 0.6% 42.5% 82.9%
Bowen Island $1,077,900 233.7 1.0% 10.8% 16.6% 10.5% 12.3% 67.5% 73.6%
Burnaby East $986,800 273.7 0.6% 1.8% 1.4% 7.2% 1.4% 42.2% 85.6%
Burnaby North $894,200 270.0 0.2% 1.0% 0.6% 5.2% 0.9% 45.5% 84.7%
Burnaby South $967,600 273.3 0.4% -0.8% 0.2% 2.8% -2.9% 41.8% 83.7%
Coquitlam $941,900 279.4 0.6% 1.3% 1.9% 6.2% 4.0% 53.2% 99.1%
Ladner $852,900 240.1 0.2% 1.5% 2.8% 7.1% -4.2% 23.8% 63.6%
Maple Ridge $789,200 251.3 0.4% 1.1% 3.0% 5.9% 8.2% 69.0% 89.7%
New Westminster $670,700 295.1 0.5% 0.7% 1.4% 4.7% 6.4% 63.6% 95.9%
North Vancouver $1,109,300 249.3 1.0% 3.4% 3.3% 9.5% 1.1% 41.5% 78.5%
Pitt Meadows $763,600 277.6 0.1% 0.2% 2.0% 4.4% 8.4% 71.5% 99.9%
Port Coquitlam $788,800 270.0 1.6% 2.8% 3.0% 8.9% 6.9% 61.8% 91.8%
Port Moody $921,500 254.7 0.6% -1.0% -1.2% 2.4% 3.0% 50.8% 87.1%
Richmond $945,700 282.3 0.1% 1.7% 1.1% 4.8% -0.7% 41.2% 76.7%
Squamish $819,400 260.7 4.7% 6.1% 5.6% 5.5% 11.9% 66.3% 114.4%
Sunshine Coast $656,500 230.0 1.9% 8.7% 14.7% 9.4% 12.5% 70.6% 75.3%
Tsawwassen $972,800 252.2 1.2% 4.9% 6.1% 9.6% -1.8% 29.2% 74.4%
Vancouver East $1,105,800 328.6 -0.3% 2.1% 1.0% 7.5% -0.2% 41.2% 100.1%
Vancouver West $1,271,900 265.6 -1.5% 0.0% -1.5% 4.0% -6.4% 28.1% 71.1%
West Vancouver $2,213,400 243.7 1.9% 4.7% 5.0% 6.7% -13.3% 11.3% 76.0%
Whistler $972,300 226.6 5.2% 6.4% 6.4% 6.1% 19.6% 72.3% 92.2%
Single Family Detached Lower Mainland $1,300,300 277.3 1.2% 3.4% 4.6% 8.2% -0.9% 39.3% 90.2%
Greater Vancouver $1,507,500 278.5 1.1% 3.0% 4.6% 7.8% -5.6% 27.3% 83.1%
Bowen Island $1,077,900 233.7 1.0% 10.8% 16.5% 10.5% 12.3% 67.5% 73.6%
Burnaby East $1,277,200 285.6 1.6% 3.8% 4.2% 10.1% 0.2% 34.8% 96.2%
Burnaby North $1,501,200 290.3 1.6% 0.9% 3.3% 11.6% -6.0% 23.9% 88.4%
Burnaby South $1,577,600 302.0 1.4% 1.2% 5.7% 8.2% -8.7% 27.5% 99.9%
Coquitlam $1,240,900 275.4 0.9% 2.5% 4.0% 7.2% -3.1% 37.4% 93.9%
Ladner $1,013,200 242.5 0.8% 0.6% 3.5% 11.3% -4.9% 19.6% 68.8%
Maple Ridge $868,000 247.3 1.3% 1.6% 4.2% 7.4% 6.8% 65.2% 91.6%
New Westminster $1,115,200 278.2 1.5% 2.5% 3.3% 8.7% -2.0% 33.9% 86.5%
North Vancouver $1,647,300 259.4 2.0% 5.4% 6.2% 12.6% -2.8% 33.0% 85.8%
Pitt Meadows $959,900 270.5 1.8% 3.7% 7.0% 9.7% 7.6% 63.2% 98.9%
Port Coquitlam $1,017,900 271.4 2.5% 4.9% 6.0% 12.0% 2.2% 45.9% 91.7%
Port Moody $1,484,800 274.2 1.2% 1.5% 4.6% 5.5% -0.8% 40.8% 95.3%
Richmond $1,564,600 303.1 1.2% 3.5% 2.7% 5.9% -11.0% 24.2% 76.5%
Squamish $1,020,400 268.9 3.2% 4.4% 5.0% 4.6% 5.6% 61.4% 107.8%
Sunshine Coast $651,100 228.1 1.9% 8.6% 14.6% 9.5% 12.2% 70.1% 74.0%
Tsawwassen $1,148,800 256.0 0.9% 4.9% 6.2% 11.5% -2.8% 26.9% 78.5%
Vancouver East $1,499,100 330.2 -0.2% 2.7% 3.5% 9.2% -3.6% 24.9% 108.2%
Vancouver West $3,084,600 312.0 0.0% 0.3% 3.7% 4.7% -15.6% 10.2% 72.0%
West Vancouver $2,687,400 253.7 0.6% 3.6% 5.3% 6.6% -14.3% 8.3% 81.1%
Whistler $1,767,700 245.9 4.9% 4.2% 5.9% 7.5% 10.6% 60.4% 89.9%
HOW TO READ THE TABLE:
ā€¢ Benchmark Price: Estimated sale price of a benchmark property. Benchmarks represent a typical property within each market.
ā€¢ Price Index: Index numbers estimate the percentage change in price on typical and constant quality properties over time. All figures are based on past sales.
ā€¢ x Month/Year Change %: Percentage change of index over a period of x month(s)/year(s) *
In January 2005, the indexes are set to 100.
Townhome properties are similar to Attached properties, a category that was used in the previous MLSLink HPI, but do not included duplexes.
The above info is deemed reliable, but is not guaranteed. All dollar amounts in CDN.
September 2020*
* MLSĀ®, Multiple Listing ServiceĀ®, and all related graphics are trademarks of The Canadian Real Estate Association 1 of 18
Property Type Area
Benchmark
Price
Price
Index
1 Month
Change %
3 Month
Change %
6 Month
Change %
1 Year
Change %
3 Year
Change %
5 Year
Change %
10 Year
Change %
September 2020*
Townhouse Lower Mainland $701,400 254.4 0.5% 1.9% 2.8% 4.6% 6.2% 60.0% 78.5%
Greater Vancouver $809,900 259.8 0.4% 2.4% 2.5% 5.2% 4.1% 51.8% 77.2%
Burnaby East $692,200 255.7 -2.3% 2.9% 5.1% 7.2% 8.8% 55.4% 76.6%
Burnaby North $731,900 273.2 -0.1% -0.4% 0.5% 0.3% 4.3% 52.5% 78.1%
Burnaby South $784,100 270.1 -2.3% -0.8% 2.0% 3.6% 4.9% 51.2% 75.8%
Coquitlam $696,300 255.5 1.1% 0.4% 2.3% 6.9% 7.9% 55.4% 83.3%
Ladner $639,000 229.2 -2.3% 1.3% -0.9% 0.4% -7.3% 27.3% 47.9%
Maple Ridge $552,900 256.7 -0.1% 2.7% 3.3% 5.8% 7.5% 72.2% 89.6%
New Westminster $758,200 278.2 -0.9% 1.3% 3.2% 6.1% 7.2% 56.4% 81.7%
North Vancouver $1,009,100 245.2 -0.6% 2.0% 4.7% 7.7% 4.6% 47.3% 77.6%
Pitt Meadows $623,100 269.6 -0.4% -0.6% 2.1% 4.7% 8.8% 72.7% 96.1%
Port Coquitlam $661,200 250.3 0.7% 2.1% 2.7% 6.1% 4.1% 61.2% 76.8%
Port Moody $649,800 219.6 -0.4% -0.2% 1.5% 2.4% 7.3% 40.2% 60.1%
Richmond $805,400 264.5 -0.2% 1.8% 2.0% 4.6% 0.8% 43.2% 69.9%
Squamish $758,500 249.4 5.8% 11.3% 6.0% 5.3% 17.0% 71.4% 111.7%
Tsawwassen $615,000 241.1 -2.1% 1.4% 0.0% 0.3% -6.8% 36.4% 53.0%
Vancouver East $926,000 294.5 2.5% 4.2% 2.0% 8.8% 1.2% 51.4% 87.5%
Vancouver West $1,164,300 272.2 0.1% 4.0% 2.8% 6.0% -2.1% 45.4% 82.3%
Whistler $980,900 236.5 6.3% 9.0% 3.8% 3.5% 18.7% 79.6% 104.4%
Apartment Lower Mainland $656,600 281.3 -0.2% 0.4% -0.7% 4.4% 8.4% 66.5% 90.1%
Greater Vancouver $683,500 273.3 -0.3% 0.4% -0.9% 4.5% 5.1% 58.9% 84.7%
Burnaby East $731,700 280.7 1.5% -1.5% -4.8% 2.5% -1.1% 54.0% 77.8%
Burnaby North $613,400 261.9 -0.2% 1.3% -0.5% 3.7% 6.4% 68.5% 88.6%
Burnaby South $659,500 264.8 0.5% -1.6% -2.2% 0.8% -0.7% 53.5% 80.9%
Coquitlam $531,700 291.8 0.5% 1.0% 0.6% 2.6% 10.2% 78.1% 111.0%
Ladner $534,800 249.7 2.3% 4.5% 6.6% 6.1% 4.4% 41.4% 67.7%
Maple Ridge $358,000 255.6 -1.2% -2.1% -0.5% 2.7% 12.5% 78.4% 77.3%
New Westminster $531,100 300.9 0.5% 0.4% 0.9% 3.9% 8.2% 75.7% 99.0%
North Vancouver $586,300 239.1 0.5% 2.0% 0.3% 7.3% 5.0% 55.1% 70.8%
Pitt Meadows $491,400 289.8 -1.0% -2.2% -0.9% 0.9% 7.9% 79.4% 98.2%
Port Coquitlam $470,200 281.2 1.6% 1.9% 1.3% 8.4% 13.5% 84.5% 102.2%
Port Moody $641,200 267.2 1.1% -2.3% -4.6% 2.3% 6.6% 74.0% 101.8%
Richmond $654,900 280.4 -0.5% 0.6% -0.1% 4.4% 9.2% 66.8% 83.0%
Squamish $519,400 256.0 5.3% 3.3% 6.7% 5.7% 20.4% 80.2% 129.2%
Tsawwassen $565,600 243.6 2.3% 4.7% 6.4% 5.7% 4.4% 39.8% 64.8%
Vancouver East $596,900 335.5 -0.7% 1.5% -0.9% 6.0% 3.2% 63.6% 93.1%
Vancouver West $782,200 253.8 -2.2% -0.9% -3.6% 3.6% -1.7% 40.9% 72.5%
West Vancouver $1,060,600 215.5 5.9% 8.0% 3.1% 3.9% -6.1% 42.9% 64.5%
Whistler $529,200 207.3 4.5% 5.7% 9.2% 7.5% 26.8% 78.4% 87.3%
HOW TO READ THE TABLE:
ā€¢ Benchmark Price: Estimated sale price of a benchmark property. Benchmarks represent a typical property within each market.
ā€¢ Price Index: Index numbers estimate the percentage change in price on typical and constant quality properties over time. All figures are based on past sales.
ā€¢ x Month/Year Change %: Percentage change of index over a period of x month(s)/year(s)
In January 2005, the indexes are set to 100. *
Townhome properties are similar to attached properties, a category that was used in the previous MLSLink HPI, but do not included duplexes.
Lower Mainland includes areas serviced by both Real Estate Board of Greater Vancouver & Fraser Valley Real Estate Board.
The above info is deemed reliable, but is not guaranteed. All dollar amounts in CDN.
* MLSĀ®, Multiple Listing ServiceĀ®, and all related graphics are trademarks of The Canadian Real Estate Association 2 of 18
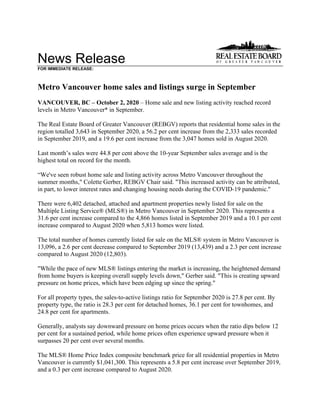
C:DATAMonthEndHpiexporthi_resgv-hpi2.tifGreaterVancouver
5YearTrend
60
110
160
210
260
310
Sep 2015
Nov 2015
Jan 2016
Mar 2016
May 2016
Jul 2016
Sep 2016
Nov 2016
Jan 2017
Mar 2017
May 2017
Jul 2017
Sep 2017
Nov 2017
Jan 2018
Mar 2018
May 2018
Jul 2018
Sep 2018
Nov 2018
Jan 2019
Mar 2019
May 2019
Jul 2019
Sep 2019
Nov 2019
Jan 2020
Mar 2020
May 2020
Jul 2020
Sep 2020
Price
Index
ResidentialDetachedTownhouseApartment
Jan2005HPI=100
9272020MLSĀ®
SALESFacts
Burnaby
Coquitlam
Delta-South
Islands-Gulf
MapleRidge/PittMeadows
NewWestminster
NorthVancouver
PortCoquitlam
PortMoody/Belcarra
Richmond
Squamish
SunshineCoast
VancouverEast
VancouverWest
WestVancouver/HoweSound
Whistler/Pemberton
Detached1011277611164291334622112279217110464381,317
Attached8170250873648293296292074551137730
Apartment221109290481061403834202161319737722441,596
Detached$1,540,000$1,288,000$1,150,000n/a$931,500$1,180,000$1,750,000$1,052,500$1,411,500$1,529,000$1,150,000$728,750$1,552,500$3,244,000$2,537,500$1,857,500
Attached$811,000$865,500$695,000n/a$573,000$744,950$1,195,000$675,000$799,950$850,900$732,000$494,950$1,161,250$1,265,000n/a$1,380,000n/a
Apartment$600,500$535,000$495,000n/a$404,950$520,000$645,000$500,000$576,500$540,000n/an/a$630,000$745,000$1,362,500$480,000
Detached988553714234103392399291051189149201,095
Attached645217070285424299522185656431620
Apartment1971062304199923933140171115534211261,332
Detached$1,561,000$1,297,500$1,136,750n/a$929,960$1,214,000$1,710,000$960,000$1,348,750$1,625,000$1,095,000$745,000$1,616,000$3,030,000$2,675,000$1,840,000
Attached$780,900$853,000n/an/a$550,000$724,000$1,078,250$706,000$735,000$858,800$720,000n/a$1,154,400$1,342,500n/a$1,137,500n/a
Apartment$586,500$521,000$504,450n/a$374,900$506,000$624,000$477,500$591,500$582,000n/an/a$636,000$775,000n/a$459,950
Detached63802679622591813722246109613516745
Attached5146100549242211771753739218422
Apartment1658718037798338241346714730312261,166
Detached$1,400,000$1,161,500$959,500n/a$830,000$1,154,834$1,598,000n/an/a$1,497,500$1,026,500$640,000$1,400,000$2,480,000$2,325,000n/a
Attached$775,000$798,900n/an/a$529,500n/a$941,500$677,500n/a$763,000n/an/a$992,500$1,338,000n/an/an/a
Apartment$590,000$524,800n/an/a$342,500$475,000$605,000$428,500$587,250$546,000n/an/a$561,500$789,000n/a$670,000
Detached559667406499471846742751516581655238966393661387,297
Attached417404138353813831720415963213975376407361774,160
Apartment1,29274416503316588212872151,168111541,1002,423981769,643
Detached$1,499,000$1,275,000$1,100,000$520,000$908,000$1,200,000$1,663,334$980,000$1,362,500$1,550,000$1,135,000$687,500$1,546,500$3,050,000$2,500,000$1,845,000
Attached$796,944$828,900$712,500n/a$550,450$728,950$1,054,900$690,000$790,000$839,000$700,000$489,900$1,130,000$1,295,000$1,622,500$1,100,000n/a
Apartment$588,000$516,000$505,000n/a$386,700$510,500$645,000$455,000$605,000$550,000$465,000$399,000$610,750$753,900$1,020,000$464,900
Detached47457325739710153581215108557155371712550308905,853
Attached4133181081413692611849844312651325365241393,338
Apartment1,189652134029465669726919799781619652,329861818,788
Detached$1,420,000$1,195,000$1,000,000$566,000$825,000$1,105,000$1,550,000$915,000$1,210,050$1,460,000$985,000$625,000$1,380,000$2,800,000$2,404,000$1,801,650
Attached$750,000$768,900$683,000n/a$525,000$710,000$985,000$653,500$737,000$782,750$656,750$449,000$990,000$1,260,000$1,687,500$955,000n/a
Apartment$578,000$516,500$489,500n/a$355,000$495,000$615,000$411,000$557,500$530,000$458,000$424,900$558,000$748,400$1,000,000$485,000
Note:MedianSellingPricesarenotreportedforareaswithlessthan20salesorfortheGulfIslands
Number
of
Sales
September
2020
Number
of
Sales
Median
Selling
Price
Number
of
Sales
Median
Selling
Price
Number
of
Sales
Median
Selling
Price
August
2020
September
2019
Jan.-
Sep.2020
Jan.-
Sep.2019
Median
Selling
Price
Number
of
Sales
Median
Selling
Price
September
2020
Year-to-date
Year-to-date
9272020MLSĀ®
LISTINGSFacts
Burnaby
Coquitlam
Delta-South
Islands-Gulf
MapleRidge/PittMeadows
NewWestminster
NorthVancouver
PortCoquitlam
PortMoody/Belcarra
Richmond
Squamish
SunshineCoast
VancouverEast
VancouverWest
WestVancouver/HoweSound
Whistler/Pemberton
Detached156183971118056203555123252100293208130202,027
Attached1511092509640915242130261313715316321,113
Apartment44721348080215288846732819439297658433,262
Detached65%69%78%100%91%52%66%84%43%48%52%92%58%50%49%190%
Attached54%64%100%n/a91%90%53%56%76%74%112%154%54%36%69%116%n/a
Apartment49%51%60%n/a60%49%49%45%51%62%84%325%50%39%38%102%
Detached163147981217949159493817836101266191144391,849
Attached116884108746734235178261511812316381,042
Apartment441170400701862567544312211234287731452,922
Detached60%58%54%58%79%69%65%80%61%56%81%104%44%48%34%51%
Attached55%59%41%n/a80%61%74%57%83%53%85%120%47%46%25%82%n/a
Apartment45%62%58%n/a59%53%36%52%75%45%81%92%45%39%35%58%
Detached14115476102124417244281953556174182166231,712
Attached10672180693583342512930191071181632893
Apartment28715540048134184623922926829368244302,261
Detached45%52%34%70%45%50%34%41%46%37%63%82%63%34%21%70%
Attached48%64%56%n/a78%26%29%65%44%60%57%26%35%33%13%56%n/a
Apartment57%56%45%n/a77%59%45%61%62%59%23%88%50%44%27%87%
Detached1,1101,165747801,4573451,2963923101,4183327961,6601,4221,04525613,831
Attached82969324197472436213382561,0592131258149401152967,539
Apartment2,7991,48535176251,2631,8095174102,312219872,2976,00435135120,887
Detached50%57%54%61%65%53%52%70%49%46%50%66%54%45%35%54%
Attached50%58%57%33%72%57%51%60%62%60%65%60%46%43%31%60%n/a
Apartment46%50%47%0%53%52%45%56%52%51%51%62%48%40%28%50%
Detached1,3171,495747761,6323721,3574543011,9273088391,7011,7241,24921215,711
Attached99668922556831776263782161,2792161406761,0371272817,751
Apartment2,5601,39231205541,3351,6455663202,4341851432,0265,68534230819,807
Detached36%38%34%51%44%41%43%47%36%29%50%44%42%32%25%42%
Attached41%46%48%20%60%39%42%49%45%35%58%36%48%35%19%49%n/a
Apartment46%47%43%n/a53%49%42%48%62%41%44%43%48%41%25%59%
*Year-to-datelistingsrepresentacumulativetotaloflistingsratherthantotalactivelistings.
%Salesto
Listings
Number
of
Listings
%Salesto
Listings
August
2020
September
2019
Jan.-
Sep.2020
Jan.-
Sep.2019
%Salesto
Listings
Number
of
Listings
%Salesto
Listings
Number
of
Listings
September
2020
Number
of
Listings
%Salesto
Listings
Number
of
Listings
September
2020
Year-to-date*
Year-to-date*
Listing & Sales Activity Summary
Listings Sales
1 2 3 Col. 2 & 3 5 6 7 Col. 6 & 7 9 10 Col. 9 & 10
Sep Aug Sep Percentage Sep Aug Sep Percentage Jul 2019 - Jul 2020 - Percentage
2019 2020 2020 Variance 2019 2020 2020 Variance Sep 2019 Sep 2020 Variance
BURNABY % % %
DETACHED 141 163 156 -4.3 63 98 101 3.1 202 271 34.2
ATTACHED 106 116 151 30.2 51 64 81 26.6 172 185 7.6
APARTMENTS 287 441 447 1.4 165 197 221 12.2 489 591 20.9
COQUITLAM
DETACHED 154 147 183 24.5 80 85 127 49.4 244 323 32.4
ATTACHED 72 88 109 23.9 46 52 70 34.6 141 180 27.7
APARTMENTS 155 170 213 25.3 87 106 109 2.8 262 331 26.3
DELTA
DETACHED 76 98 97 -1.0 26 53 76 43.4 99 197 99.0
ATTACHED 18 41 25 -39.0 10 17 25 47.1 38 60 57.9
APARTMENTS 40 40 48 20.0 18 23 29 26.1 60 75 25.0
MAPLE RIDGE/PITT MEADOWS
DETACHED 212 179 180 0.6 96 142 164 15.5 286 449 57.0
ATTACHED 69 87 96 10.3 54 70 87 24.3 156 246 57.7
APARTMENTS 48 70 80 14.3 37 41 48 17.1 115 146 27.0
NORTH VANCOUVER
DETACHED 172 159 203 27.7 59 103 133 29.1 199 337 69.3
ATTACHED 83 73 91 24.7 24 54 48 -11.1 88 148 68.2
APARTMENTS 184 256 288 12.5 83 92 140 52.2 267 351 31.5
NEW WESTMINSTER
DETACHED 44 49 56 14.3 22 34 29 -14.7 53 91 71.7
ATTACHED 35 46 40 -13.0 9 28 36 28.6 26 85 226.9
APARTMENTS 134 186 215 15.6 79 99 106 7.1 249 318 27.7
PORT MOODY/BELCARRA
DETACHED 28 38 51 34.2 13 23 22 -4.3 36 77 113.9
ATTACHED 25 35 42 20.0 11 29 32 10.3 38 87 128.9
APARTMENTS 39 44 67 52.3 24 33 34 3.0 69 103 49.3
PORT COQUITLAM
DETACHED 44 49 55 12.2 18 39 46 17.9 80 126 57.5
ATTACHED 34 42 52 23.8 22 24 29 20.8 65 92 41.5
APARTMENTS 62 75 84 12.0 38 39 38 -2.6 97 116 19.6
RICHMOND
DETACHED 195 178 232 30.3 72 99 112 13.1 224 305 36.2
ATTACHED 129 178 130 -27.0 77 95 96 1.1 200 290 45.0
APARTMENTS 229 312 328 5.1 134 140 202 44.3 408 505 23.8
SUNSHINE COAST
DETACHED 56 101 100 -1.0 46 105 92 -12.4 158 298 88.6
ATTACHED 19 15 13 -13.3 5 18 20 11.1 18 48 166.7
APARTMENTS 8 12 4 -66.7 7 11 13 18.2 18 31 72.2
SQUAMISH
DETACHED 35 36 52 44.4 22 29 27 -6.9 55 81 47.3
ATTACHED 30 26 26 0.0 17 22 29 31.8 44 76 72.7
APARTMENTS 26 21 19 -9.5 6 17 16 -5.9 22 53 140.9
VANCOUVER EAST
DETACHED 174 266 293 10.2 109 118 171 44.9 286 430 50.3
ATTACHED 107 118 137 16.1 37 56 74 32.1 116 176 51.7
APARTMENTS 293 342 392 14.6 147 155 197 27.1 399 508 27.3
VANCOUVER WEST
DETACHED 182 191 208 8.9 61 91 104 14.3 200 270 35.0
ATTACHED 118 123 153 24.4 39 56 55 -1.8 146 169 15.8
APARTMENTS 682 877 976 11.3 303 342 377 10.2 969 1057 9.1
WHISTLER/PEMBERTON
DETACHED 23 39 20 -48.7 16 20 38 90.0 36 86 138.9
ATTACHED 32 38 32 -15.8 18 31 37 19.4 50 95 90.0
APARTMENTS 30 45 43 -4.4 26 26 44 69.2 68 101 48.5
WEST VANCOUVER/HOWE SOUND
DETACHED 166 144 130 -9.7 35 49 64 30.6 118 167 41.5
ATTACHED 16 16 16 0.0 2 4 11 175.0 6 19 216.7
APARTMENTS 44 31 58 87.1 12 11 22 100.0 33 42 27.3
GRAND TOTALS
DETACHED 1702 1837 2016 9.7 738 1088 1306 20.0 2276 3508 54.1
ATTACHED 893 1042 1113 6.8 422 620 730 17.7 1304 1956 50.0
APARTMENTS 2261 2922 3262 11.6 1166 1332 1596 19.8 3525 4328 22.8
ResidentialAverageSalePrices-January1977toSeptember2020
0
200
400
600
800
1000
1200
1400
1600
1800
2000
1977
1978
1979
1980
1981
1982
1983
1984
1985
1986
1987
1988
1989
1990
1991
1992
1993
1994
1995
1996
1997
1998
1999
2000
2001
2002
2003
2004
2005
2006
2007
2008
2009
2010
2011
2012
2013
2014
2015
2016
2017
2018
2019
2020
DETACHEDCONDOMINIUMATTACHEDAPARTMENTS
INTHOUSANDS($)
NOTE:From1977-1984condominiumaverageswerenotseparatedintoattached&apartment.
$927,795
$698,821
$1,709,493

More Related Content

What's hot

REBGV Statistics Package May 2020
REBGV Statistics Package May 2020REBGV Statistics Package May 2020
REBGV Statistics Package May 2020Vicky Aulakh
Ā 
Central Okanagan Statistics Package October 2021
Central Okanagan Statistics Package October 2021 Central Okanagan Statistics Package October 2021
Central Okanagan Statistics Package October 2021 VickyAulakh1
Ā 
Rebgv stats-pkg-june-2019
Rebgv stats-pkg-june-2019Rebgv stats-pkg-june-2019
Rebgv stats-pkg-june-2019Vicky Aulakh
Ā 
Rebgv stats-pkg-april-2020
Rebgv stats-pkg-april-2020Rebgv stats-pkg-april-2020
Rebgv stats-pkg-april-2020Vicky Aulakh
Ā 
REBGV Statistics Package October 2020
REBGV Statistics Package October 2020REBGV Statistics Package October 2020
REBGV Statistics Package October 2020Vicky Aulakh
Ā 
REBGV Statistics package July 2020
REBGV Statistics package July 2020REBGV Statistics package July 2020
REBGV Statistics package July 2020Vicky Aulakh
Ā 
REBGV Statistics Package June 2020
REBGV Statistics Package June 2020REBGV Statistics Package June 2020
REBGV Statistics Package June 2020Vicky Aulakh
Ā 
May 2021 Real Estate Board of Greater Vancouver Statistics Package
May 2021 Real Estate Board of Greater Vancouver Statistics PackageMay 2021 Real Estate Board of Greater Vancouver Statistics Package
May 2021 Real Estate Board of Greater Vancouver Statistics PackageVicky Aulakh
Ā 
2021 June - REBGV Statistics Package
2021 June - REBGV Statistics Package2021 June - REBGV Statistics Package
2021 June - REBGV Statistics PackageVicky Aulakh
Ā 
REBGV January 2020 Statistics Package
REBGV January 2020 Statistics Package REBGV January 2020 Statistics Package
REBGV January 2020 Statistics Package Vicky Aulakh
Ā 
Rebgv stats-pkg-april-2019
Rebgv stats-pkg-april-2019Rebgv stats-pkg-april-2019
Rebgv stats-pkg-april-2019Kathryn Huang
Ā 
Metro Vancouver Statistics Report October 2021
Metro Vancouver Statistics Report October 2021Metro Vancouver Statistics Report October 2021
Metro Vancouver Statistics Report October 2021VickyAulakh1
Ā 
Real Estate Board of Greater Vancouver Statistics Package March 2021
Real Estate Board of Greater Vancouver Statistics Package March 2021Real Estate Board of Greater Vancouver Statistics Package March 2021
Real Estate Board of Greater Vancouver Statistics Package March 2021Vicky Aulakh
Ā 
Rebgv stats-pkg-september-2018
Rebgv stats-pkg-september-2018Rebgv stats-pkg-september-2018
Rebgv stats-pkg-september-2018Kathryn Huang
Ā 
Rebgv stats-pkg-july-2019
Rebgv stats-pkg-july-2019Rebgv stats-pkg-july-2019
Rebgv stats-pkg-july-2019Vicky Aulakh
Ā 
Rebgv stats-pkg-november-2019-f
Rebgv stats-pkg-november-2019-fRebgv stats-pkg-november-2019-f
Rebgv stats-pkg-november-2019-fVicky Aulakh
Ā 
Real Estate Board of Greater Vancouver Statistics Package August 2021
Real Estate Board of Greater Vancouver Statistics Package August 2021Real Estate Board of Greater Vancouver Statistics Package August 2021
Real Estate Board of Greater Vancouver Statistics Package August 2021Vicky Aulakh
Ā 
Rebgv stats-pkg-february-2020
Rebgv stats-pkg-february-2020Rebgv stats-pkg-february-2020
Rebgv stats-pkg-february-2020Vicky Aulakh
Ā 
Rebgv stats-pkg-december-2019
Rebgv stats-pkg-december-2019Rebgv stats-pkg-december-2019
Rebgv stats-pkg-december-2019Vicky Aulakh
Ā 
REBGV Stats Package February 2021
REBGV Stats Package February 2021REBGV Stats Package February 2021
REBGV Stats Package February 2021Vicky Aulakh
Ā 

What's hot (20)

REBGV Statistics Package May 2020
REBGV Statistics Package May 2020REBGV Statistics Package May 2020
REBGV Statistics Package May 2020
Ā 
Central Okanagan Statistics Package October 2021
Central Okanagan Statistics Package October 2021 Central Okanagan Statistics Package October 2021
Central Okanagan Statistics Package October 2021
Ā 
Rebgv stats-pkg-june-2019
Rebgv stats-pkg-june-2019Rebgv stats-pkg-june-2019
Rebgv stats-pkg-june-2019
Ā 
Rebgv stats-pkg-april-2020
Rebgv stats-pkg-april-2020Rebgv stats-pkg-april-2020
Rebgv stats-pkg-april-2020
Ā 
REBGV Statistics Package October 2020
REBGV Statistics Package October 2020REBGV Statistics Package October 2020
REBGV Statistics Package October 2020
Ā 
REBGV Statistics package July 2020
REBGV Statistics package July 2020REBGV Statistics package July 2020
REBGV Statistics package July 2020
Ā 
REBGV Statistics Package June 2020
REBGV Statistics Package June 2020REBGV Statistics Package June 2020
REBGV Statistics Package June 2020
Ā 
May 2021 Real Estate Board of Greater Vancouver Statistics Package
May 2021 Real Estate Board of Greater Vancouver Statistics PackageMay 2021 Real Estate Board of Greater Vancouver Statistics Package
May 2021 Real Estate Board of Greater Vancouver Statistics Package
Ā 
2021 June - REBGV Statistics Package
2021 June - REBGV Statistics Package2021 June - REBGV Statistics Package
2021 June - REBGV Statistics Package
Ā 
REBGV January 2020 Statistics Package
REBGV January 2020 Statistics Package REBGV January 2020 Statistics Package
REBGV January 2020 Statistics Package
Ā 
Rebgv stats-pkg-april-2019
Rebgv stats-pkg-april-2019Rebgv stats-pkg-april-2019
Rebgv stats-pkg-april-2019
Ā 
Metro Vancouver Statistics Report October 2021
Metro Vancouver Statistics Report October 2021Metro Vancouver Statistics Report October 2021
Metro Vancouver Statistics Report October 2021
Ā 
Real Estate Board of Greater Vancouver Statistics Package March 2021
Real Estate Board of Greater Vancouver Statistics Package March 2021Real Estate Board of Greater Vancouver Statistics Package March 2021
Real Estate Board of Greater Vancouver Statistics Package March 2021
Ā 
Rebgv stats-pkg-september-2018
Rebgv stats-pkg-september-2018Rebgv stats-pkg-september-2018
Rebgv stats-pkg-september-2018
Ā 
Rebgv stats-pkg-july-2019
Rebgv stats-pkg-july-2019Rebgv stats-pkg-july-2019
Rebgv stats-pkg-july-2019
Ā 
Rebgv stats-pkg-november-2019-f
Rebgv stats-pkg-november-2019-fRebgv stats-pkg-november-2019-f
Rebgv stats-pkg-november-2019-f
Ā 
Real Estate Board of Greater Vancouver Statistics Package August 2021
Real Estate Board of Greater Vancouver Statistics Package August 2021Real Estate Board of Greater Vancouver Statistics Package August 2021
Real Estate Board of Greater Vancouver Statistics Package August 2021
Ā 
Rebgv stats-pkg-february-2020
Rebgv stats-pkg-february-2020Rebgv stats-pkg-february-2020
Rebgv stats-pkg-february-2020
Ā 
Rebgv stats-pkg-december-2019
Rebgv stats-pkg-december-2019Rebgv stats-pkg-december-2019
Rebgv stats-pkg-december-2019
Ā 
REBGV Stats Package February 2021
REBGV Stats Package February 2021REBGV Stats Package February 2021
REBGV Stats Package February 2021
Ā 

Similar to Rebgv Stats Package September 2020

Rebgv stats-pkg-september-2019
Rebgv stats-pkg-september-2019Rebgv stats-pkg-september-2019
Rebgv stats-pkg-september-2019Vicky Aulakh
Ā 
Rebgv stats-pkg-october-2019
Rebgv stats-pkg-october-2019Rebgv stats-pkg-october-2019
Rebgv stats-pkg-october-2019Vicky Aulakh
Ā 
Rebgv stats-pkg-august-2018
Rebgv stats-pkg-august-2018Rebgv stats-pkg-august-2018
Rebgv stats-pkg-august-2018Kathryn Huang
Ā 
May-2019 Stats Package for Greater Vancouver
May-2019 Stats Package for Greater VancouverMay-2019 Stats Package for Greater Vancouver
May-2019 Stats Package for Greater VancouverBC PRIME Realty
Ā 
Rebgv stats-pkg-june-2018
Rebgv stats-pkg-june-2018Rebgv stats-pkg-june-2018
Rebgv stats-pkg-june-2018Kathryn Huang
Ā 
Rebgv stats-pkg-april-2018
Rebgv stats-pkg-april-2018Rebgv stats-pkg-april-2018
Rebgv stats-pkg-april-2018Kathryn Huang
Ā 
201807 rebgv-stats-package-for-media
201807 rebgv-stats-package-for-media201807 rebgv-stats-package-for-media
201807 rebgv-stats-package-for-mediaKathryn Huang
Ā 
Rebgv stats-pkg-january-2018 2
Rebgv stats-pkg-january-2018 2Rebgv stats-pkg-january-2018 2
Rebgv stats-pkg-january-2018 2Kathryn Huang
Ā 
Rebgv stats-pkg-may-2018
Rebgv stats-pkg-may-2018Rebgv stats-pkg-may-2018
Rebgv stats-pkg-may-2018Kathryn Huang
Ā 
Real Estate Board of Greater Vancouver - Stats Package May 2021
Real Estate Board of Greater Vancouver - Stats Package May 2021Real Estate Board of Greater Vancouver - Stats Package May 2021
Real Estate Board of Greater Vancouver - Stats Package May 2021AlexanderMackenzie13
Ā 
Rebgv stats-pkg-may-2021
Rebgv stats-pkg-may-2021Rebgv stats-pkg-may-2021
Rebgv stats-pkg-may-2021BC PRIME Realty
Ā 
REBGV September 2016 Stats Package Mike Stewart Vancouver Realtor
REBGV September 2016 Stats Package Mike Stewart Vancouver RealtorREBGV September 2016 Stats Package Mike Stewart Vancouver Realtor
REBGV September 2016 Stats Package Mike Stewart Vancouver RealtorMike Stewart
Ā 
Rebgv stats-pkg-march-2019
Rebgv stats-pkg-march-2019Rebgv stats-pkg-march-2019
Rebgv stats-pkg-march-2019Sherryl Jacobs
Ā 
Rebgv stats-pkg-march-2019
Rebgv stats-pkg-march-2019Rebgv stats-pkg-march-2019
Rebgv stats-pkg-march-2019Kathryn Huang
Ā 
Real Estate Board of Greater Vancouver Statistics Package October 2021
Real Estate Board of Greater Vancouver Statistics Package October 2021Real Estate Board of Greater Vancouver Statistics Package October 2021
Real Estate Board of Greater Vancouver Statistics Package October 2021VickyAulakh1
Ā 
Real Estate Board of Greater Vancouver Statistics Package November 2020
Real Estate Board of Greater Vancouver Statistics Package November 2020Real Estate Board of Greater Vancouver Statistics Package November 2020
Real Estate Board of Greater Vancouver Statistics Package November 2020Vicky Aulakh
Ā 
August 2017 REBGV Stats Mike Stewart Realtor
August 2017 REBGV Stats Mike Stewart RealtorAugust 2017 REBGV Stats Mike Stewart Realtor
August 2017 REBGV Stats Mike Stewart RealtorMike Stewart
Ā 
REBGV-Stats-Pkg-July-2022
REBGV-Stats-Pkg-July-2022REBGV-Stats-Pkg-July-2022
REBGV-Stats-Pkg-July-2022Vicky Aulakh
Ā 

Similar to Rebgv Stats Package September 2020 (20)

Rebgv stats-pkg-october-2020
Rebgv stats-pkg-october-2020Rebgv stats-pkg-october-2020
Rebgv stats-pkg-october-2020
Ā 
Rebgv stats-pkg-september-2019
Rebgv stats-pkg-september-2019Rebgv stats-pkg-september-2019
Rebgv stats-pkg-september-2019
Ā 
Rebgv stats-pkg-october-2019
Rebgv stats-pkg-october-2019Rebgv stats-pkg-october-2019
Rebgv stats-pkg-october-2019
Ā 
Rebgv stats-pkg-august-2018
Rebgv stats-pkg-august-2018Rebgv stats-pkg-august-2018
Rebgv stats-pkg-august-2018
Ā 
May-2019 Stats Package for Greater Vancouver
May-2019 Stats Package for Greater VancouverMay-2019 Stats Package for Greater Vancouver
May-2019 Stats Package for Greater Vancouver
Ā 
Rebgv stats-pkg-june-2018
Rebgv stats-pkg-june-2018Rebgv stats-pkg-june-2018
Rebgv stats-pkg-june-2018
Ā 
Rebgv stats-pkg-april-2018
Rebgv stats-pkg-april-2018Rebgv stats-pkg-april-2018
Rebgv stats-pkg-april-2018
Ā 
201807 rebgv-stats-package-for-media
201807 rebgv-stats-package-for-media201807 rebgv-stats-package-for-media
201807 rebgv-stats-package-for-media
Ā 
Rebgv stats-pkg-january-2018 2
Rebgv stats-pkg-january-2018 2Rebgv stats-pkg-january-2018 2
Rebgv stats-pkg-january-2018 2
Ā 
Rebgv stats-pkg-may-2018
Rebgv stats-pkg-may-2018Rebgv stats-pkg-may-2018
Rebgv stats-pkg-may-2018
Ā 
Real Estate Board of Greater Vancouver - Stats Package May 2021
Real Estate Board of Greater Vancouver - Stats Package May 2021Real Estate Board of Greater Vancouver - Stats Package May 2021
Real Estate Board of Greater Vancouver - Stats Package May 2021
Ā 
Rebgv stats-pkg-may-2021
Rebgv stats-pkg-may-2021Rebgv stats-pkg-may-2021
Rebgv stats-pkg-may-2021
Ā 
REBGV September 2016 Stats Package Mike Stewart Vancouver Realtor
REBGV September 2016 Stats Package Mike Stewart Vancouver RealtorREBGV September 2016 Stats Package Mike Stewart Vancouver Realtor
REBGV September 2016 Stats Package Mike Stewart Vancouver Realtor
Ā 
Rebgv stats-pkg-march-2019
Rebgv stats-pkg-march-2019Rebgv stats-pkg-march-2019
Rebgv stats-pkg-march-2019
Ā 
Rebgv stats-pkg-march-2019
Rebgv stats-pkg-march-2019Rebgv stats-pkg-march-2019
Rebgv stats-pkg-march-2019
Ā 
Real Estate Board of Greater Vancouver Statistics Package October 2021
Real Estate Board of Greater Vancouver Statistics Package October 2021Real Estate Board of Greater Vancouver Statistics Package October 2021
Real Estate Board of Greater Vancouver Statistics Package October 2021
Ā 
Rebgv stats-pkg-november-2020
Rebgv stats-pkg-november-2020Rebgv stats-pkg-november-2020
Rebgv stats-pkg-november-2020
Ā 
Real Estate Board of Greater Vancouver Statistics Package November 2020
Real Estate Board of Greater Vancouver Statistics Package November 2020Real Estate Board of Greater Vancouver Statistics Package November 2020
Real Estate Board of Greater Vancouver Statistics Package November 2020
Ā 
August 2017 REBGV Stats Mike Stewart Realtor
August 2017 REBGV Stats Mike Stewart RealtorAugust 2017 REBGV Stats Mike Stewart Realtor
August 2017 REBGV Stats Mike Stewart Realtor
Ā 
REBGV-Stats-Pkg-July-2022
REBGV-Stats-Pkg-July-2022REBGV-Stats-Pkg-July-2022
REBGV-Stats-Pkg-July-2022
Ā 

More from Vicky Aulakh

Okanagan Statistics May2023.pdf
Okanagan Statistics May2023.pdfOkanagan Statistics May2023.pdf
Okanagan Statistics May2023.pdfVicky Aulakh
Ā 
FVREB May 2023 Statistics Package.pdf
FVREB May 2023 Statistics Package.pdfFVREB May 2023 Statistics Package.pdf
FVREB May 2023 Statistics Package.pdfVicky Aulakh
Ā 
Metro Vancouver Stats.pdf
Metro Vancouver Stats.pdfMetro Vancouver Stats.pdf
Metro Vancouver Stats.pdfVicky Aulakh
Ā 
FVREB July 2022
FVREB July 2022FVREB July 2022
FVREB July 2022Vicky Aulakh
Ā 
VREB July 2022
VREB July 2022VREB July 2022
VREB July 2022Vicky Aulakh
Ā 
BCRE June 2022
BCRE June 2022BCRE June 2022
BCRE June 2022Vicky Aulakh
Ā 
Okanagan Stats June 2022
Okanagan Stats June 2022Okanagan Stats June 2022
Okanagan Stats June 2022Vicky Aulakh
Ā 
Okanagan Stats May 2022
Okanagan Stats May 2022Okanagan Stats May 2022
Okanagan Stats May 2022Vicky Aulakh
Ā 
VREB June 2022 Stats
VREB June 2022 StatsVREB June 2022 Stats
VREB June 2022 StatsVicky Aulakh
Ā 
FVREB June 2022 Stats
FVREB June 2022 StatsFVREB June 2022 Stats
FVREB June 2022 StatsVicky Aulakh
Ā 
FVREB May 2022
FVREB May 2022FVREB May 2022
FVREB May 2022Vicky Aulakh
Ā 
REBGV Statistics Package May 2022
REBGV Statistics Package May 2022REBGV Statistics Package May 2022
REBGV Statistics Package May 2022Vicky Aulakh
Ā 
VREB May 2022 Statistics Package.pdf
VREB May 2022 Statistics Package.pdfVREB May 2022 Statistics Package.pdf
VREB May 2022 Statistics Package.pdfVicky Aulakh
Ā 
The Okanagan Real Estate April 2022 Statistics
The Okanagan Real Estate April 2022 StatisticsThe Okanagan Real Estate April 2022 Statistics
The Okanagan Real Estate April 2022 StatisticsVicky Aulakh
Ā 
FVREB April 2022 Stats Package .pdf
FVREB April 2022 Stats Package .pdfFVREB April 2022 Stats Package .pdf
FVREB April 2022 Stats Package .pdfVicky Aulakh
Ā 
VREB April 2022 Stats Package .pdf
VREB April 2022 Stats Package .pdfVREB April 2022 Stats Package .pdf
VREB April 2022 Stats Package .pdfVicky Aulakh
Ā 
REBGV-Stats-Pkg-April-2022.pdf
REBGV-Stats-Pkg-April-2022.pdfREBGV-Stats-Pkg-April-2022.pdf
REBGV-Stats-Pkg-April-2022.pdfVicky Aulakh
Ā 
March 2022 Okanagan Statistics
March 2022 Okanagan StatisticsMarch 2022 Okanagan Statistics
March 2022 Okanagan StatisticsVicky Aulakh
Ā 
FVREB Statistics Package March 2022
FVREB Statistics Package March 2022FVREB Statistics Package March 2022
FVREB Statistics Package March 2022Vicky Aulakh
Ā 

More from Vicky Aulakh (20)

Okanagan Statistics May2023.pdf
Okanagan Statistics May2023.pdfOkanagan Statistics May2023.pdf
Okanagan Statistics May2023.pdf
Ā 
FVREB May 2023 Statistics Package.pdf
FVREB May 2023 Statistics Package.pdfFVREB May 2023 Statistics Package.pdf
FVREB May 2023 Statistics Package.pdf
Ā 
Metro Vancouver Stats.pdf
Metro Vancouver Stats.pdfMetro Vancouver Stats.pdf
Metro Vancouver Stats.pdf
Ā 
FVREB July 2022
FVREB July 2022FVREB July 2022
FVREB July 2022
Ā 
VREB July 2022
VREB July 2022VREB July 2022
VREB July 2022
Ā 
BCRE June 2022
BCRE June 2022BCRE June 2022
BCRE June 2022
Ā 
Okanagan Stats June 2022
Okanagan Stats June 2022Okanagan Stats June 2022
Okanagan Stats June 2022
Ā 
Okanagan Stats May 2022
Okanagan Stats May 2022Okanagan Stats May 2022
Okanagan Stats May 2022
Ā 
VREB June 2022 Stats
VREB June 2022 StatsVREB June 2022 Stats
VREB June 2022 Stats
Ā 
FVREB June 2022 Stats
FVREB June 2022 StatsFVREB June 2022 Stats
FVREB June 2022 Stats
Ā 
FVREB May 2022
FVREB May 2022FVREB May 2022
FVREB May 2022
Ā 
REBGV Statistics Package May 2022
REBGV Statistics Package May 2022REBGV Statistics Package May 2022
REBGV Statistics Package May 2022
Ā 
VREB May 2022 Statistics Package.pdf
VREB May 2022 Statistics Package.pdfVREB May 2022 Statistics Package.pdf
VREB May 2022 Statistics Package.pdf
Ā 
The Okanagan Real Estate April 2022 Statistics
The Okanagan Real Estate April 2022 StatisticsThe Okanagan Real Estate April 2022 Statistics
The Okanagan Real Estate April 2022 Statistics
Ā 
FVREB April 2022 Stats Package .pdf
FVREB April 2022 Stats Package .pdfFVREB April 2022 Stats Package .pdf
FVREB April 2022 Stats Package .pdf
Ā 
VREB April 2022 Stats Package .pdf
VREB April 2022 Stats Package .pdfVREB April 2022 Stats Package .pdf
VREB April 2022 Stats Package .pdf
Ā 
REBGV-Stats-Pkg-April-2022.pdf
REBGV-Stats-Pkg-April-2022.pdfREBGV-Stats-Pkg-April-2022.pdf
REBGV-Stats-Pkg-April-2022.pdf
Ā 
BCREA.pdf
BCREA.pdfBCREA.pdf
BCREA.pdf
Ā 
March 2022 Okanagan Statistics
March 2022 Okanagan StatisticsMarch 2022 Okanagan Statistics
March 2022 Okanagan Statistics
Ā 
FVREB Statistics Package March 2022
FVREB Statistics Package March 2022FVREB Statistics Package March 2022
FVREB Statistics Package March 2022
Ā 

Recently uploaded

Low Rate Call Girls in Trilokpuri Delhi Call 9990771857
Low Rate Call Girls in Trilokpuri Delhi Call 9990771857Low Rate Call Girls in Trilokpuri Delhi Call 9990771857
Low Rate Call Girls in Trilokpuri Delhi Call 9990771857delhimodel235
Ā 
Puravankara Mundhwa Pune E-Brochure.pdf
Puravankara Mundhwa Pune  E-Brochure.pdfPuravankara Mundhwa Pune  E-Brochure.pdf
Puravankara Mundhwa Pune E-Brochure.pdfManishSaxena95
Ā 
9990771857 Call Girls in Noida Sector 10 Noida (Call Girls) Delhi
9990771857 Call Girls in Noida Sector 10 Noida (Call Girls) Delhi9990771857 Call Girls in Noida Sector 10 Noida (Call Girls) Delhi
9990771857 Call Girls in Noida Sector 10 Noida (Call Girls) Delhidelhimodel235
Ā 
Raquel Thompson: Combining Creativity with Practicality in Architecture
Raquel Thompson: Combining  Creativity with Practicality in ArchitectureRaquel Thompson: Combining  Creativity with Practicality in Architecture
Raquel Thompson: Combining Creativity with Practicality in ArchitectureRaquel Thompson Barbados
Ā 
Call Girls in Kashmiri Gate Delhi šŸ’ÆCall Us šŸ”8264348440šŸ”
Call Girls in Kashmiri Gate Delhi šŸ’ÆCall Us šŸ”8264348440šŸ”Call Girls in Kashmiri Gate Delhi šŸ’ÆCall Us šŸ”8264348440šŸ”
Call Girls in Kashmiri Gate Delhi šŸ’ÆCall Us šŸ”8264348440šŸ”soniya singh
Ā 
Aparna Greenscapes Kompally Hyderabad E - Brochure.pdf
Aparna Greenscapes Kompally Hyderabad E - Brochure.pdfAparna Greenscapes Kompally Hyderabad E - Brochure.pdf
Aparna Greenscapes Kompally Hyderabad E - Brochure.pdffaheemali990101
Ā 
call girls in ganesh nagar Delhi 8264348440 āœ… call girls ā¤ļø
call girls in ganesh nagar Delhi 8264348440 āœ… call girls ā¤ļøcall girls in ganesh nagar Delhi 8264348440 āœ… call girls ā¤ļø
call girls in ganesh nagar Delhi 8264348440 āœ… call girls ā¤ļøsoniya singh
Ā 
Building Dreams: Newman Leech's Visionary Approach to Real Estate Investment
Building Dreams: Newman Leech's Visionary Approach to Real Estate InvestmentBuilding Dreams: Newman Leech's Visionary Approach to Real Estate Investment
Building Dreams: Newman Leech's Visionary Approach to Real Estate InvestmentNewman George Leech
Ā 
Call Girls in laxmi Nagar Delhi šŸ’ÆCall Us šŸ” 9582086666šŸ” South Delhi Escorts Se...
Call Girls in laxmi Nagar Delhi šŸ’ÆCall Us šŸ” 9582086666šŸ” South Delhi Escorts Se...Call Girls in laxmi Nagar Delhi šŸ’ÆCall Us šŸ” 9582086666šŸ” South Delhi Escorts Se...
Call Girls in laxmi Nagar Delhi šŸ’ÆCall Us šŸ” 9582086666šŸ” South Delhi Escorts Se...delhimodel235
Ā 
How to Build Multifamily and Laneway Suites in Toronto!! (feat. Expert Archi...
How to Build Multifamily and Laneway Suites  in Toronto!! (feat. Expert Archi...How to Build Multifamily and Laneway Suites  in Toronto!! (feat. Expert Archi...
How to Build Multifamily and Laneway Suites in Toronto!! (feat. Expert Archi...Volition Properties
Ā 
9990771857 Call Girls in Noida Sector 03 Noida (Call Girls) Delhi
9990771857 Call Girls in Noida Sector 03 Noida (Call Girls) Delhi9990771857 Call Girls in Noida Sector 03 Noida (Call Girls) Delhi
9990771857 Call Girls in Noida Sector 03 Noida (Call Girls) Delhidelhimodel235
Ā 
Call Girls in Khan Market 9654467111 ESCORTS SERVICE
Call Girls in Khan Market 9654467111 ESCORTS SERVICECall Girls in Khan Market 9654467111 ESCORTS SERVICE
Call Girls in Khan Market 9654467111 ESCORTS SERVICESapana Sha
Ā 
Call girls in Jeewan Park .Delhiā†«8447779280ā†¬ ź§‚Escorts Service In Delhi Ncr
Call girls in Jeewan Park .Delhiā†«8447779280ā†¬ ź§‚Escorts Service In Delhi NcrCall girls in Jeewan Park .Delhiā†«8447779280ā†¬ ź§‚Escorts Service In Delhi Ncr
Call girls in Jeewan Park .Delhiā†«8447779280ā†¬ ź§‚Escorts Service In Delhi Ncrasmaqueen5
Ā 
Call Girls in Janakpuri ā†«8447779280ā†«Short 1500 Night 6000-Escorts Service In ...
Call Girls in Janakpuri ā†«8447779280ā†«Short 1500 Night 6000-Escorts Service In ...Call Girls in Janakpuri ā†«8447779280ā†«Short 1500 Night 6000-Escorts Service In ...
Call Girls in Janakpuri ā†«8447779280ā†«Short 1500 Night 6000-Escorts Service In ...asmaqueen5
Ā 
Listing Turkey Sylvana Istanbul - Bahcesehir
Listing Turkey Sylvana Istanbul - BahcesehirListing Turkey Sylvana Istanbul - Bahcesehir
Listing Turkey Sylvana Istanbul - BahcesehirListing Turkey
Ā 
Call Girls In Mayur Vihar Delhi ā˜†ā†«8447779280 ā¤Escorts Service In Delhi
Call Girls In Mayur Vihar Delhi ā˜†ā†«8447779280 ā¤Escorts Service In DelhiCall Girls In Mayur Vihar Delhi ā˜†ā†«8447779280 ā¤Escorts Service In Delhi
Call Girls In Mayur Vihar Delhi ā˜†ā†«8447779280 ā¤Escorts Service In Delhiasmaqueen5
Ā 
Low Rate Call Girls in Tughlakabad Delhi Call 9990771857
Low Rate Call Girls in Tughlakabad Delhi Call 9990771857Low Rate Call Girls in Tughlakabad Delhi Call 9990771857
Low Rate Call Girls in Tughlakabad Delhi Call 9990771857delhimodel235
Ā 
Call Girls in Noida Sector 77 Noida šŸ’ÆCall Us šŸ” 9582086666 šŸ” South Delhi Escor...
Call Girls in Noida Sector 77 Noida šŸ’ÆCall Us šŸ” 9582086666 šŸ” South Delhi Escor...Call Girls in Noida Sector 77 Noida šŸ’ÆCall Us šŸ” 9582086666 šŸ” South Delhi Escor...
Call Girls in Noida Sector 77 Noida šŸ’ÆCall Us šŸ” 9582086666 šŸ” South Delhi Escor...delhimodel235
Ā 

Recently uploaded (20)

Low Rate Call Girls in Trilokpuri Delhi Call 9990771857
Low Rate Call Girls in Trilokpuri Delhi Call 9990771857Low Rate Call Girls in Trilokpuri Delhi Call 9990771857
Low Rate Call Girls in Trilokpuri Delhi Call 9990771857
Ā 
Puravankara Mundhwa Pune E-Brochure.pdf
Puravankara Mundhwa Pune  E-Brochure.pdfPuravankara Mundhwa Pune  E-Brochure.pdf
Puravankara Mundhwa Pune E-Brochure.pdf
Ā 
9990771857 Call Girls in Noida Sector 10 Noida (Call Girls) Delhi
9990771857 Call Girls in Noida Sector 10 Noida (Call Girls) Delhi9990771857 Call Girls in Noida Sector 10 Noida (Call Girls) Delhi
9990771857 Call Girls in Noida Sector 10 Noida (Call Girls) Delhi
Ā 
Raquel Thompson: Combining Creativity with Practicality in Architecture
Raquel Thompson: Combining  Creativity with Practicality in ArchitectureRaquel Thompson: Combining  Creativity with Practicality in Architecture
Raquel Thompson: Combining Creativity with Practicality in Architecture
Ā 
Call Girls in Kashmiri Gate Delhi šŸ’ÆCall Us šŸ”8264348440šŸ”
Call Girls in Kashmiri Gate Delhi šŸ’ÆCall Us šŸ”8264348440šŸ”Call Girls in Kashmiri Gate Delhi šŸ’ÆCall Us šŸ”8264348440šŸ”
Call Girls in Kashmiri Gate Delhi šŸ’ÆCall Us šŸ”8264348440šŸ”
Ā 
Aparna Greenscapes Kompally Hyderabad E - Brochure.pdf
Aparna Greenscapes Kompally Hyderabad E - Brochure.pdfAparna Greenscapes Kompally Hyderabad E - Brochure.pdf
Aparna Greenscapes Kompally Hyderabad E - Brochure.pdf
Ā 
call girls in ganesh nagar Delhi 8264348440 āœ… call girls ā¤ļø
call girls in ganesh nagar Delhi 8264348440 āœ… call girls ā¤ļøcall girls in ganesh nagar Delhi 8264348440 āœ… call girls ā¤ļø
call girls in ganesh nagar Delhi 8264348440 āœ… call girls ā¤ļø
Ā 
Building Dreams: Newman Leech's Visionary Approach to Real Estate Investment
Building Dreams: Newman Leech's Visionary Approach to Real Estate InvestmentBuilding Dreams: Newman Leech's Visionary Approach to Real Estate Investment
Building Dreams: Newman Leech's Visionary Approach to Real Estate Investment
Ā 
Call Girls in laxmi Nagar Delhi šŸ’ÆCall Us šŸ” 9582086666šŸ” South Delhi Escorts Se...
Call Girls in laxmi Nagar Delhi šŸ’ÆCall Us šŸ” 9582086666šŸ” South Delhi Escorts Se...Call Girls in laxmi Nagar Delhi šŸ’ÆCall Us šŸ” 9582086666šŸ” South Delhi Escorts Se...
Call Girls in laxmi Nagar Delhi šŸ’ÆCall Us šŸ” 9582086666šŸ” South Delhi Escorts Se...
Ā 
How to Build Multifamily and Laneway Suites in Toronto!! (feat. Expert Archi...
How to Build Multifamily and Laneway Suites  in Toronto!! (feat. Expert Archi...How to Build Multifamily and Laneway Suites  in Toronto!! (feat. Expert Archi...
How to Build Multifamily and Laneway Suites in Toronto!! (feat. Expert Archi...
Ā 
9990771857 Call Girls in Noida Sector 03 Noida (Call Girls) Delhi
9990771857 Call Girls in Noida Sector 03 Noida (Call Girls) Delhi9990771857 Call Girls in Noida Sector 03 Noida (Call Girls) Delhi
9990771857 Call Girls in Noida Sector 03 Noida (Call Girls) Delhi
Ā 
Call Girls in Khan Market 9654467111 ESCORTS SERVICE
Call Girls in Khan Market 9654467111 ESCORTS SERVICECall Girls in Khan Market 9654467111 ESCORTS SERVICE
Call Girls in Khan Market 9654467111 ESCORTS SERVICE
Ā 
Call girls in Jeewan Park .Delhiā†«8447779280ā†¬ ź§‚Escorts Service In Delhi Ncr
Call girls in Jeewan Park .Delhiā†«8447779280ā†¬ ź§‚Escorts Service In Delhi NcrCall girls in Jeewan Park .Delhiā†«8447779280ā†¬ ź§‚Escorts Service In Delhi Ncr
Call girls in Jeewan Park .Delhiā†«8447779280ā†¬ ź§‚Escorts Service In Delhi Ncr
Ā 
Call Girls in Janakpuri ā†«8447779280ā†«Short 1500 Night 6000-Escorts Service In ...
Call Girls in Janakpuri ā†«8447779280ā†«Short 1500 Night 6000-Escorts Service In ...Call Girls in Janakpuri ā†«8447779280ā†«Short 1500 Night 6000-Escorts Service In ...
Call Girls in Janakpuri ā†«8447779280ā†«Short 1500 Night 6000-Escorts Service In ...
Ā 
Listing Turkey Sylvana Istanbul - Bahcesehir
Listing Turkey Sylvana Istanbul - BahcesehirListing Turkey Sylvana Istanbul - Bahcesehir
Listing Turkey Sylvana Istanbul - Bahcesehir
Ā 
Low Rate Call Girls in Triveni Complex Delhi Call 9873940964
Low Rate Call Girls in Triveni Complex Delhi Call 9873940964Low Rate Call Girls in Triveni Complex Delhi Call 9873940964
Low Rate Call Girls in Triveni Complex Delhi Call 9873940964
Ā 
VIP Escorts in Delhi:šŸ”9953056974šŸ” Hot Qutub Minar Delhi Escorts Service
VIP Escorts in Delhi:šŸ”9953056974šŸ” Hot Qutub Minar Delhi Escorts ServiceVIP Escorts in Delhi:šŸ”9953056974šŸ” Hot Qutub Minar Delhi Escorts Service
VIP Escorts in Delhi:šŸ”9953056974šŸ” Hot Qutub Minar Delhi Escorts Service
Ā 
Call Girls In Mayur Vihar Delhi ā˜†ā†«8447779280 ā¤Escorts Service In Delhi
Call Girls In Mayur Vihar Delhi ā˜†ā†«8447779280 ā¤Escorts Service In DelhiCall Girls In Mayur Vihar Delhi ā˜†ā†«8447779280 ā¤Escorts Service In Delhi
Call Girls In Mayur Vihar Delhi ā˜†ā†«8447779280 ā¤Escorts Service In Delhi
Ā 
Low Rate Call Girls in Tughlakabad Delhi Call 9990771857
Low Rate Call Girls in Tughlakabad Delhi Call 9990771857Low Rate Call Girls in Tughlakabad Delhi Call 9990771857
Low Rate Call Girls in Tughlakabad Delhi Call 9990771857
Ā 
Call Girls in Noida Sector 77 Noida šŸ’ÆCall Us šŸ” 9582086666 šŸ” South Delhi Escor...
Call Girls in Noida Sector 77 Noida šŸ’ÆCall Us šŸ” 9582086666 šŸ” South Delhi Escor...Call Girls in Noida Sector 77 Noida šŸ’ÆCall Us šŸ” 9582086666 šŸ” South Delhi Escor...
Call Girls in Noida Sector 77 Noida šŸ’ÆCall Us šŸ” 9582086666 šŸ” South Delhi Escor...
Ā 

Rebgv Stats Package September 2020