SlideShare a Scribd company logo
1 of 9
Download to read offline
News Release
FOR IMMEDIATE RELEASE:
Home sales down, listings up across Metro Vancouver
VANCOUVER, BC – May 2, 2018 – The Metro Vancouver* housing market saw fewer home
buyers and more home sellers in April.
The Real Estate Board of Greater Vancouver (REBGV) reports that residential property sales in
the region totalled 2,579 in April 2018, a 27.4 per cent decrease from the 3,553 sales recorded in
April 2017, and a 2.5 per cent increase compared to March 2018 when 2,517 homes sold.
Last month’s sales were 22.5 per cent below the 10-year April sales average.
“Market conditions are changing. Home sales declined in our region last month to a 17-year
April low and home sellers have become more active than we’ve seen in the past three years,”
Phil Moore, REBGV president said. “The mortgage requirements that the federal government
implemented this year have, among other factors, diminished home buyers’ purchasing power
and they’re being felt on the buyer side today.”
There were 5,820 detached, attached and apartment properties newly listed for sale on the
Multiple Listing Service® (MLS®) in Metro Vancouver in April 2018. This represents an 18.6
per cent increase compared to the 4,907 homes listed in April 2017 and a 30.8 per cent increase
compared to March 2018 when 4,450 homes were listed.
The total number of properties currently listed for sale on the MLS® system in Metro Vancouver
is 9,822, a 25.7 per cent increase compared to April 2017 (7,813) and a 17.2 per cent increase
compared to March 2018 (8,380).
“Home buyers have more breathing room this spring. They have more selection to choose from
and less demand to compete against,” Moore said.
For all property types, the sales-to-active listings ratio for April 2018 is 26.3 per cent. By
property type, the ratio is 14.1 per cent for detached homes, 36.1 per cent for townhomes, and
46.7 per cent for condominiums.
Generally, analysts say that downward pressure on home prices occurs when the ratio dips below
the 12 per cent mark for a sustained period, while home prices often experience upward pressure
when it surpasses 20 per cent over several months.
The MLS® Home Price Index composite benchmark price for all residential properties in Metro
Vancouver is currently $1,092,000. This represents a 14.3 per cent increase over April 2017 and
a 0.7 per cent increase compared to March 2018.
Sales of detached properties in April 2018 reached 807, a 33.4 per cent decrease from the 1,211
detached sales recorded in April 2017. The benchmark price for detached properties is
$1,605,800. This represents a 5.1 per cent increase from April 2017 and a 0.2 per cent decrease
compared to March 2018.
Sales of apartment properties reached 1,308 in April 2018, a 24 per cent decrease from the 1,722
sales in April 2017. The benchmark price of an apartment property is $701,000. This represents a
23.7 per cent increase from April 2017 and a 1.1 per cent increase compared to March 2018.
Attached property sales in April 2018 totalled 464, a 25.2 per cent decrease compared to the 620
sales in April 2017. The benchmark price of an attached unit is $854,200. This represents a 17.7
per cent increase from April 2017 and a 2.3 per cent increase compared to March 2018.
-30-
*Editor’s Note: Areas covered by the Real Estate Board of Greater Vancouver include: Whistler, Sunshine Coast,
Squamish, West Vancouver, North Vancouver, Vancouver, Burnaby, New Westminster, Richmond, Port Moody,
Port Coquitlam, Coquitlam, Pitt Meadows, Maple Ridge, and South Delta.
The real estate industry is a key economic driver in British Columbia. In 2017, 35,993 homes changed ownership in
the Board’s area, generating $2.4 billion in economic spin-off activity and an estimated 17,600 jobs. The total dollar
value of residential sales transacted through the MLS® system in Greater Vancouver totalled $37 billion in 2017.
The Real Estate Board of Greater Vancouver is an association representing more than 14,000 REALTORS® and
their companies. The Board provides a variety of member services, including the Multiple Listing Service®. For
more information on real estate, statistics, and buying or selling a home, contact a local REALTOR® or visit
www.rebgv.org.
For more information please contact:
Craig Munn
Manager, Communication
Real Estate Board of Greater Vancouver
604.730.3146
cmunn@rebgv.org
Property Type Area
Benchmark
Price
Price
Index
1 Month
Change %
3 Month
Change %
6 Month
Change %
1 Year
Change %
3 Year
Change %
5 Year
Change %
10 Year
Change %
Residential / Composite Lower Mainland $1,000,900 282.4 0.9% 4.1% 6.3% 16.9% 66.5% 84.0% 91.8%
Greater Vancouver $1,092,000 285.5 0.7% 3.4% 4.8% 14.3% 60.7% 81.0% 92.0%
Bowen Island $992,600 215.2 1.5% 5.4% 3.5% 13.0% 66.7% 73.7% 56.6%
Burnaby East $1,007,700 280.3 1.4% 5.2% 7.1% 15.6% 57.2% 78.9% 89.6%
Burnaby North $940,600 284.0 0.8% 2.6% 5.3% 13.9% 63.0% 83.7% 90.1%
Burnaby South $1,044,800 295.1 -0.8% 2.3% 4.9% 13.9% 63.2% 86.1% 101.0%
Coquitlam $972,600 288.5 1.4% 4.2% 7.0% 18.5% 70.6% 96.0% 98.1%
Ladner $877,500 246.3 0.5% 1.1% 1.9% 8.4% 44.7% 61.1% 73.1%
Maple Ridge $747,300 251.3 2.2% 6.8% 9.9% 25.0% 81.8% 88.2% 77.5%
New Westminster $724,300 310.5 2.2% 7.2% 11.2% 27.4% 82.6% 93.9% 103.1%
North Vancouver $1,144,600 257.2 0.5% 4.7% 4.6% 12.3% 54.0% 75.3% 80.1%
Pitt Meadows $753,200 275.5 2.0% 7.7% 12.5% 29.6% 81.3% 99.5% 89.9%
Port Coquitlam $785,600 277.1 1.1% 6.7% 9.1% 22.2% 77.7% 95.8% 87.1%
Port Moody $974,700 269.4 1.8% 4.9% 7.6% 20.7% 70.8% 93.7% 88.7%
Richmond $1,037,400 302.9 1.2% 2.2% 5.3% 14.1% 62.8% 80.8% 103.6%
Squamish $884,300 283.1 7.0% 9.9% 8.6% 21.9% 89.0% 130.7% 108.6%
Sunshine Coast $616,800 216.1 1.1% 5.4% 4.8% 14.9% 71.1% 79.6% 55.5%
Tsawwassen $1,024,500 257.3 0.6% 2.6% 2.3% 8.2% 52.2% 71.0% 78.7%
Vancouver East $1,114,000 326.2 -0.2% 1.8% 2.8% 11.6% 60.1% 85.1% 111.7%
Vancouver West $1,372,500 289.4 -0.5% 1.3% 0.7% 8.6% 49.3% 70.9% 88.0%
West Vancouver $2,619,400 281.6 -1.4% 0.4% 0.5% 3.9% 40.2% 67.4% 87.6%
Whistler $1,053,300 231.6 7.4% 11.8% 8.9% 25.5% 89.8% 128.9% 73.1%
Single Family Detached Lower Mainland $1,339,200 284.1 0.2% 1.2% 1.3% 8.2% 55.2% 77.9% 97.6%
Greater Vancouver $1,605,800 295.1 -0.2% 0.3% -0.2% 5.1% 48.4% 74.8% 100.9%
Bowen Island $992,600 215.2 1.5% 5.4% 3.5% 13.0% 66.7% 73.7% 56.6%
Burnaby East $1,331,300 297.7 1.7% 5.1% 5.9% 11.0% 54.6% 77.8% 105.5%
Burnaby North $1,595,800 308.6 3.3% 1.8% 1.1% 4.5% 46.2% 78.5% 106.4%
Burnaby South $1,675,800 320.8 0.1% 0.5% -1.7% 2.7% 44.8% 77.3% 122.3%
Coquitlam $1,304,900 289.6 1.2% 1.9% 2.2% 9.6% 57.9% 85.3% 102.9%
Ladner $1,004,800 242.2 -0.3% -1.2% -2.2% 3.8% 39.6% 57.6% 73.5%
Maple Ridge $868,400 247.4 1.9% 4.2% 7.0% 18.5% 77.6% 87.0% 79.3%
New Westminster $1,192,600 297.5 1.4% 3.8% 5.3% 10.5% 57.6% 77.8% 104.9%
North Vancouver $1,703,400 266.4 -1.2% 2.0% 0.2% 4.8% 48.2% 78.9% 87.5%
Pitt Meadows $943,200 265.8 1.1% 4.3% 7.4% 18.5% 72.2% 90.5% 90.3%
Port Coquitlam $1,037,000 276.5 0.9% 6.0% 4.3% 11.8% 64.2% 90.0% 93.0%
Port Moody $1,510,200 278.9 1.7% 1.1% 0.1% 9.9% 57.2% 83.2% 93.5%
Richmond $1,684,500 338.3 -1.4% -0.4% -0.3% 5.2% 52.6% 78.8% 122.9%
Squamish $1,024,900 261.6 1.9% 2.2% 4.3% 10.8% 76.8% 108.9% 94.2%
Sunshine Coast $614,600 215.3 1.4% 5.3% 5.1% 15.4% 71.4% 79.6% 54.9%
Tsawwassen $1,265,500 272.5 -0.7% 0.3% -0.8% 5.2% 53.0% 75.8% 89.2%
Vancouver East $1,544,100 341.3 -0.6% -1.3% -1.4% 4.7% 47.6% 86.6% 132.0%
Vancouver West $3,404,200 349.5 -1.3% -4.1% -6.1% -2.6% 36.6% 64.7% 114.4%
West Vancouver $3,054,000 288.3 -2.0% -1.5% -1.3% 1.0% 36.0% 66.0% 87.9%
Whistler $1,679,100 212.9 0.4% -0.1% 3.0% 10.0% 63.6% 87.9% 58.6%
HOW TO READ THE TABLE:
• Benchmark Price: Estimated sale price of a benchmark property. Benchmarks represent a typical property within each market.
• Price Index: Index numbers estimate the percentage change in price on typical and constant quality properties over time. All figures are based on past sales.
• x Month/Year Change %: Percentage change of index over a period of x month(s)/year(s) *
In January 2005, the indexes are set to 100.
Townhome properties are similar to Attached properties, a category that was used in the previous MLSLink HPI, but do not included duplexes.
The above info is deemed reliable, but is not guaranteed. All dollar amounts in CDN.
April 2018*
* MLS®, Multiple Listing Service®, and all related graphics are trademarks of The Canadian Real Estate Association 1 of 15
Property Type Area
Benchmark
Price
Price
Index
1 Month
Change %
3 Month
Change %
6 Month
Change %
1 Year
Change %
3 Year
Change %
5 Year
Change %
10 Year
Change %
April 2018*
Townhouse Lower Mainland $721,600 260.8 1.9% 6.0% 7.5% 19.5% 70.0% 80.9% 81.1%
Greater Vancouver $854,200 275.6 2.3% 6.3% 6.5% 17.7% 66.9% 82.8% 89.4%
Burnaby East $699,300 258.3 1.3% 4.7% 8.1% 19.7% 59.4% 69.6% 77.2%
Burnaby North $757,700 282.8 0.5% 3.2% 5.4% 16.7% 62.0% 77.0% 88.0%
Burnaby South $834,900 287.6 0.9% 6.2% 9.5% 18.5% 65.0% 83.2% 96.6%
Coquitlam $701,600 257.4 1.8% 5.9% 7.8% 16.2% 66.9% 82.7% 82.2%
Ladner $786,100 274.1 0.8% 1.3% 5.5% 13.4% 56.7% 72.3% 82.4%
Maple Ridge $585,200 271.7 1.8% 9.6% 10.5% 30.1% 89.6% 93.1% 87.1%
New Westminster $715,400 282.9 1.0% 3.1% 5.4% 15.7% 63.1% 76.3% 91.0%
North Vancouver $1,030,900 250.5 2.5% 3.9% 5.5% 13.2% 61.0% 72.3% 79.4%
Pitt Meadows $634,900 274.7 1.3% 7.6% 10.6% 27.5% 80.2% 98.8% 88.5%
Port Coquitlam $688,900 259.9 2.3% 8.4% 7.1% 21.1% 74.4% 87.1% 80.6%
Port Moody $662,200 223.8 0.4% 4.7% 9.2% 21.1% 52.5% 64.1% 55.3%
Richmond $839,000 275.7 1.0% 2.0% 4.9% 12.8% 59.3% 72.4% 90.7%
Squamish $937,800 340.7 10.2% 19.2% 4.3% 24.8% 105.4% 192.4% 148.9%
Tsawwassen $781,300 291.0 3.5% 2.4% 5.5% 13.1% 65.7% 80.0% 93.6%
Vancouver East $933,500 306.4 2.8% 8.8% 9.2% 21.1% 68.3% 77.5% 94.4%
Vancouver West $1,302,200 287.6 2.5% 4.4% 2.9% 10.1% 60.4% 80.5% 93.5%
Whistler $1,091,500 291.9 8.0% 19.4% 3.9% 25.1% 89.1% 159.2% 119.1%
Apartment Lower Mainland $664,700 290.6 1.3% 6.7% 12.0% 28.4% 83.6% 93.9% 89.7%
Greater Vancouver $701,000 281.7 1.1% 5.3% 9.2% 23.7% 75.4% 88.3% 85.8%
Burnaby East $731,500 277.7 0.5% 6.4% 10.6% 30.1% 64.3% 95.3% 74.9%
Burnaby North $640,400 273.4 -0.2% 3.6% 9.1% 22.2% 82.5% 94.0% 83.2%
Burnaby South $715,800 287.4 -1.6% 2.6% 7.8% 20.2% 78.7% 93.4% 93.1%
Coquitlam $543,600 298.3 1.4% 6.0% 11.7% 30.6% 92.9% 118.4% 95.9%
Ladner $472,600 224.0 2.9% 9.6% 11.8% 19.5% 46.8% 57.2% 56.3%
Maple Ridge $329,000 237.6 4.1% 12.9% 22.2% 50.6% 91.3% 88.3% 53.5%
New Westminster $557,000 317.5 2.5% 8.6% 13.5% 34.9% 95.4% 101.8% 103.7%
North Vancouver $611,900 249.1 1.8% 7.9% 9.9% 23.1% 62.6% 73.2% 72.5%
Pitt Meadows $485,700 287.1 3.5% 11.4% 20.3% 47.5% 92.3% 110.6% 85.5%
Port Coquitlam $481,400 287.9 0.6% 6.6% 15.1% 34.5% 98.0% 108.0% 82.6%
Port Moody $692,300 288.5 2.6% 7.7% 12.9% 30.4% 94.7% 119.2% 105.3%
Richmond $684,100 292.0 3.7% 5.3% 12.2% 28.0% 84.1% 92.0% 96.0%
Squamish $544,400 262.2 10.9% 11.0% 19.9% 37.9% 99.2% 112.8% 91.9%
Tsawwassen $513,600 216.6 4.7% 11.5% 13.6% 21.4% 54.4% 61.8% 51.2%
Vancouver East $574,700 317.1 -0.5% 4.1% 6.7% 19.7% 80.3% 88.4% 94.1%
Vancouver West $841,700 273.1 -0.4% 3.6% 4.4% 16.0% 60.6% 77.6% 80.1%
West Vancouver $1,295,900 262.5 1.4% 9.9% 11.4% 20.3% 71.2% 76.1% 89.0%
Whistler $596,300 195.5 11.4% 11.7% 19.6% 38.8% 131.1% 152.3% 45.8%
HOW TO READ THE TABLE:
• Benchmark Price: Estimated sale price of a benchmark property. Benchmarks represent a typical property within each market.
• Price Index: Index numbers estimate the percentage change in price on typical and constant quality properties over time. All figures are based on past sales.
• x Month/Year Change %: Percentage change of index over a period of x month(s)/year(s)
In January 2005, the indexes are set to 100. *
Townhome properties are similar to attached properties, a category that was used in the previous MLSLink HPI, but do not included duplexes.
Lower Mainland includes areas serviced by both Real Estate Board of Greater Vancouver & Fraser Valley Real Estate Board.
The above info is deemed reliable, but is not guaranteed. All dollar amounts in CDN.
* MLS®, Multiple Listing Service®, and all related graphics are trademarks of The Canadian Real Estate Association 2 of 15
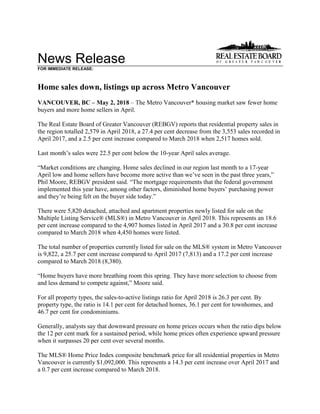
C:DATAMonthEndHpiexporthi_resgv-hpi2.tifGreaterVancouver
5YearTrend
60
110
160
210
260
310
Apr 2013
Jun 2013
Aug 2013
Oct 2013
Dec 2013
Feb 2014
Apr 2014
Jun 2014
Aug 2014
Oct 2014
Dec 2014
Feb 2015
Apr 2015
Jun 2015
Aug 2015
Oct 2015
Dec 2015
Feb 2016
Apr 2016
Jun 2016
Aug 2016
Oct 2016
Dec 2016
Feb 2017
Apr 2017
Jun 2017
Aug 2017
Oct 2017
Dec 2017
Feb 2018
Apr 2018
Price
Index
ResidentialDetachedTownhouseApartment
Jan2005HPI=100
4252018MLS®
SALESFacts
Burnaby
Coquitlam
Delta-South
Islands-Gulf
MapleRidge/PittMeadows
NewWestminster
NorthVancouver
PortCoquitlam
PortMoody/Belcarra
Richmond
Squamish
SunshineCoast
VancouverEast
VancouverWest
WestVancouver/HoweSound
Whistler/Pemberton
Detached547745412327773421652442103683211807
Attached6031805013421916791795347416464
Apartment160921705593101481716712714235020271,308
Detached$1,575,000$1,310,000$1,175,000n/a$908,000$1,180,000$1,675,000$1,030,000$1,420,000$1,680,000$1,050,000$622,500$1,650,000$2,970,000$2,655,000n/a
Attached$809,900$870,000n/an/a$579,950n/a$1,040,000n/an/a$850,000n/an/a$1,136,000$1,315,000n/an/an/a
Apartment$599,000$608,180n/an/a$380,000$535,000$650,000$453,000n/a$618,000n/an/a$620,000$845,000$1,053,750$388,500
Detached507834511320673177725448353269722
Attached5835904715303017671494439230446
Apartment1509120053111117413316181015634914351,349
Detached$1,785,000$1,375,000$1,236,000n/a$865,000$1,126,500$1,790,000$1,025,000n/a$1,687,000$942,000$597,500$1,600,000$2,981,500$2,915,000n/a
Attached$797,100$899,000n/an/a$540,000n/a$1,105,000$726,500n/a$895,000n/an/a$1,112,000$1,538,000n/a$1,289,500n/a
Apartment$594,000$540,000$555,000n/a$403,000$536,500$640,000$480,000$642,000$613,500n/an/a$621,950$806,500n/a$544,900
Detached104113527140281104522157346714210966151,211
Attached6755150682036271912131134862929620
Apartment238126200901311064840230181016443821421,722
Detached$1,600,000$1,310,000$1,057,500n/a$785,000$1,107,500$1,900,000$935,000$1,264,500$1,632,000$996,500$640,000$1,552,500$3,320,000$3,500,000n/a
Attached$825,000$705,000n/an/a$475,500$640,000$1,002,000$582,000n/a$828,000$579,900n/a$889,950$1,316,000n/a$573,500n/a
Apartment$510,000$480,000$497,500n/a$319,450$446,000$585,000$342,500$592,000$475,000n/an/a$511,000$762,000$960,500$419,500
Detached2122711231139580232105392607315730822097542,637
Attached213115321178531198456273613015915415871,630
Apartment56635061025534238015610461644274921,274691184,854
Detached$1,655,000$1,335,000$1,140,000n/a$885,000$1,237,500$1,740,000$1,025,000$1,462,000$1,700,000$955,000$623,324$1,615,000$3,265,000$2,835,000$2,092,500
Attached$786,000$830,000$678,000n/a$560,000$775,000$1,025,000$702,347$738,000$865,000$662,500$389,950$1,129,900$1,398,000n/a$1,170,000n/a
Apartment$600,000$558,000$551,000n/a$378,000$526,250$665,000$447,500$613,500$593,000$435,000$479,100$625,000$850,000$1,225,000$409,500
Detached29131317319398723301356445596202430333180593,550
Attached1991536212166011691543467835133190271051,866
Apartment70343666026238438517213880557395381,472781285,663
Detached$1,580,000$1,234,250$1,065,000n/a$749,000$1,085,000$1,740,000$880,000$1,280,000$1,628,999$882,500$571,500$1,521,500$3,295,000$3,325,000$1,940,000
Attached$750,000$710,000$668,450n/a$458,750$646,000$963,500$567,000$595,750$798,000$589,900$355,000$945,000$1,328,500$2,000,000$699,000n/a
Apartment$500,000$465,000$479,000n/a$300,000$431,000$542,000$337,500$495,000$465,000$363,000$315,000$518,000$713,500$1,001,500$342,500
Note:MedianSellingPricesarenotreportedforareaswithlessthan20salesorfortheGulfIslands
Number
of
Sales
April
2018
Number
of
Sales
Median
Selling
Price
Number
of
Sales
Median
Selling
Price
Number
of
Sales
Median
Selling
Price
March
2018
April
2017
Jan.-
Apr.2018
Jan.-
Apr.2017
Median
Selling
Price
Number
of
Sales
Median
Selling
Price
April
2018
Year-to-date
Year-to-date
4252018MLS®
LISTINGSFacts
Burnaby
Coquitlam
Delta-South
Islands-Gulf
MapleRidge/PittMeadows
NewWestminster
NorthVancouver
PortCoquitlam
PortMoody/Belcarra
Richmond
Squamish
SunshineCoast
VancouverEast
VancouverWest
WestVancouver/HoweSound
Whistler/Pemberton
Detached240206122921561243823825750108337296202222,488
Attached10472182793167333513929211051291726907
Apartment279173330108143168673828435927273440422,425
Detached23%37%37%44%57%44%32%41%55%25%48%39%31%23%16%50%
Attached58%43%44%0%63%42%63%58%46%57%59%43%50%36%24%62%n/a
Apartment57%53%52%n/a51%65%60%72%45%59%34%78%52%48%50%64%
Detached154159891217835157522421336103235230109261,812
Attached88481126017572722116141673901252705
Apartment205112390671411434634275161020156532471,933
Detached32%49%38%42%63%57%43%60%29%36%69%43%35%23%24%35%
Attached66%73%82%0%78%88%53%111%77%58%100%56%60%43%17%58%n/a
Apartment73%81%51%n/a79%79%82%89%97%59%50%100%78%62%44%74%
Detached187183911318643162624326449114291241160152,104
Attached118741506725583429144232279901725820
Apartment27113820089145136495223621721453140341,983
Detached56%62%57%54%75%65%68%73%51%59%69%59%49%45%41%100%
Attached57%74%100%n/a101%80%62%79%66%84%135%59%61%69%53%116%n/a
Apartment88%91%100%n/a101%90%78%98%77%97%86%143%77%82%53%124%
Detached717632377336601576912141119891683459641,042603827,785
Attached35321454824989196124944758457317396591302,899
Apartment833484109030745755319813999495338032,2881371757,605
Detached30%43%33%33%60%51%34%49%35%26%43%46%32%21%16%66%
Attached60%54%59%13%71%60%61%68%60%57%73%53%50%39%25%67%n/a
Apartment68%72%56%n/a83%75%69%79%75%62%46%82%61%56%50%67%
Detached685566367306131205892081201,053165340949911597777,390
Attached337213703265871661237550111552231323571152,733
Apartment95152688033248751722817392666357392,0121171557,352
Detached42%55%47%63%65%60%56%65%53%43%58%59%45%37%30%77%
Attached59%72%89%33%82%69%70%74%72%69%68%67%58%59%47%91%n/a
Apartment74%83%75%n/a79%79%74%75%80%87%86%111%73%73%67%83%
*Year-to-datelistingsrepresentacumulativetotaloflistingsratherthantotalactivelistings.
%Salesto
Listings
Number
of
Listings
%Salesto
Listings
March
2018
April
2017
Jan.-
Apr.2018
Jan.-
Apr.2017
%Salesto
Listings
Number
of
Listings
%Salesto
Listings
Number
of
Listings
April
2018
Number
of
Listings
%Salesto
Listings
Number
of
Listings
April
2018
Year-to-date*
Year-to-date*
Listing & Sales Activity Summary
Listings Sales
1 2 3 Col. 2 & 3 5 6 7 Col. 6 & 7 9 10 Col. 9 & 10
Apr Mar Apr Percentage Apr Mar Apr Percentage Feb 2017 - Feb 2018 - Percentage
2017 2018 2018 Variance 2017 2018 2018 Variance Apr 2017 Apr 2018 Variance
BURNABY % % %
DETACHED 187 154 240 55.8 104 50 54 8.0 251 156 -37.8
ATTACHED 118 88 104 18.2 67 58 60 3.4 172 178 3.5
APARTMENTS 271 205 279 36.1 238 150 160 6.7 595 454 -23.7
COQUITLAM
DETACHED 183 159 206 29.6 113 78 77 -1.3 278 215 -22.7
ATTACHED 74 48 72 50.0 55 35 31 -11.4 134 96 -28.4
APARTMENTS 138 112 173 54.5 126 91 92 1.1 376 270 -28.2
DELTA
DETACHED 91 89 122 37.1 52 34 45 32.4 154 109 -29.2
ATTACHED 15 11 18 63.6 15 9 8 -11.1 54 24 -55.6
APARTMENTS 20 39 33 -15.4 20 20 17 -15.0 55 48 -12.7
MAPLE RIDGE/PITT MEADOWS
DETACHED 186 178 215 20.8 140 113 123 8.8 341 321 -5.9
ATTACHED 67 60 79 31.7 68 47 50 6.4 187 136 -27.3
APARTMENTS 89 67 108 61.2 90 53 55 3.8 227 173 -23.8
NORTH VANCOUVER
DETACHED 162 157 243 54.8 110 67 77 14.9 296 202 -31.8
ATTACHED 58 57 67 17.5 36 30 42 40.0 103 92 -10.7
APARTMENTS 136 143 168 17.5 106 117 101 -13.7 326 305 -6.4
NEW WESTMINSTER
DETACHED 43 35 61 74.3 28 20 27 35.0 61 69 13.1
ATTACHED 25 17 31 82.4 20 15 13 -13.3 55 40 -27.3
APARTMENTS 145 141 143 1.4 131 111 93 -16.2 337 270 -19.9
PORT MOODY/BELCARRA
DETACHED 43 24 38 58.3 22 7 21 200.0 56 36 -35.7
ATTACHED 29 22 35 59.1 19 17 16 -5.9 41 45 9.8
APARTMENTS 52 34 38 11.8 40 33 17 -48.5 116 72 -37.9
PORT COQUITLAM
DETACHED 62 52 82 57.7 45 31 34 9.7 121 92 -24.0
ATTACHED 34 27 33 22.2 27 30 19 -36.7 77 68 -11.7
APARTMENTS 49 46 67 45.7 48 41 48 17.1 141 127 -9.9
RICHMOND
DETACHED 264 213 257 20.7 157 77 65 -15.6 400 194 -51.5
ATTACHED 144 116 139 19.8 121 67 79 17.9 299 212 -29.1
APARTMENTS 236 275 284 3.3 230 161 167 3.7 682 471 -30.9
SUNSHINE COAST
DETACHED 114 103 108 4.9 67 44 42 -4.5 170 121 -28.8
ATTACHED 22 16 21 31.3 13 9 9 0.0 29 25 -13.8
APARTMENTS 7 10 9 -10.0 10 10 7 -30.0 32 21 -34.4
SQUAMISH
DETACHED 49 36 50 38.9 34 25 24 -4.0 80 67 -16.3
ATTACHED 23 14 29 107.1 31 14 17 21.4 67 51 -23.9
APARTMENTS 21 16 35 118.8 18 8 12 50.0 49 38 -22.4
VANCOUVER EAST
DETACHED 291 235 337 43.4 142 83 103 24.1 379 263 -30.6
ATTACHED 79 73 105 43.8 48 44 53 20.5 121 134 10.7
APARTMENTS 214 201 272 35.3 164 156 142 -9.0 463 425 -8.2
VANCOUVER WEST
DETACHED 241 230 296 28.7 109 53 68 28.3 297 174 -41.4
ATTACHED 90 90 129 43.3 62 39 47 20.5 166 130 -21.7
APARTMENTS 531 565 734 29.9 438 349 350 0.3 1261 1031 -18.2
WHISTLER/PEMBERTON
DETACHED 15 26 22 -15.4 15 9 11 22.2 47 39 -17.0
ATTACHED 25 52 26 -50.0 29 30 16 -46.7 83 68 -18.1
APARTMENTS 34 47 42 -10.6 42 35 27 -22.9 113 91 -19.5
WEST VANCOUVER/HOWE SOUND
DETACHED 160 109 202 85.3 66 26 32 23.1 160 82 -48.8
ATTACHED 17 12 17 41.7 9 2 4 100.0 24 11 -54.2
APARTMENTS 40 32 40 25.0 21 14 20 42.9 65 46 -29.2
GRAND TOTALS
DETACHED 2091 1800 2479 37.7 1204 717 803 12.0 3091 2140 -30.8
ATTACHED 820 703 905 28.7 620 446 464 4.0 1612 1310 -18.7
APARTMENTS 1983 1933 2425 25.5 1722 1349 1308 -3.0 4838 3842 -20.6
ResidentialAverageSalePrices-January1977toApril2018
0
200
400
600
800
1000
1200
1400
1600
1800
2000
1977
1978
1979
1980
1981
1982
1983
1984
1985
1986
1987
1988
1989
1990
1991
1992
1993
1994
1995
1996
1997
1998
1999
2000
2001
2002
2003
2004
2005
2006
2007
2008
2009
2010
2011
2012
2013
2014
2015
2016
2017
2018
DETACHEDCONDOMINIUMATTACHEDAPARTMENTS
INTHOUSANDS($)
NOTE:From1977-1984condominiumaverageswerenotseparatedintoattached&apartment.
$933,631
$747,823
$1,658,958

More Related Content

What's hot

Rebgv stats-pkg-november-2018
Rebgv stats-pkg-november-2018Rebgv stats-pkg-november-2018
Rebgv stats-pkg-november-2018Kathryn Huang
 
Rebgv stats-pkg-june-2019
Rebgv stats-pkg-june-2019Rebgv stats-pkg-june-2019
Rebgv stats-pkg-june-2019Vicky Aulakh
 
Rebgv stats-pkg-february-2019
Rebgv stats-pkg-february-2019Rebgv stats-pkg-february-2019
Rebgv stats-pkg-february-2019Sherryl Jacobs
 
Real Estate Board of Greater Vancouver Statistics Package July 2021
Real Estate Board of Greater Vancouver Statistics Package July 2021Real Estate Board of Greater Vancouver Statistics Package July 2021
Real Estate Board of Greater Vancouver Statistics Package July 2021Vicky Aulakh
 
REBGV Statistics Package April 2021
REBGV Statistics Package April 2021REBGV Statistics Package April 2021
REBGV Statistics Package April 2021Vicky Aulakh
 
Rebgv stats-pkg-november-2019-f
Rebgv stats-pkg-november-2019-fRebgv stats-pkg-november-2019-f
Rebgv stats-pkg-november-2019-fVicky Aulakh
 
REBGV Statistics Package October 2020
REBGV Statistics Package October 2020REBGV Statistics Package October 2020
REBGV Statistics Package October 2020Vicky Aulakh
 
REBGV Statistics Package August 2020
REBGV Statistics Package August 2020REBGV Statistics Package August 2020
REBGV Statistics Package August 2020Vicky Aulakh
 
Real Estate Board of Greater Vancouver Statistics Package August 2021
Real Estate Board of Greater Vancouver Statistics Package August 2021Real Estate Board of Greater Vancouver Statistics Package August 2021
Real Estate Board of Greater Vancouver Statistics Package August 2021Vicky Aulakh
 
Rebgv stats-pkg-march-2019
Rebgv stats-pkg-march-2019Rebgv stats-pkg-march-2019
Rebgv stats-pkg-march-2019Kathryn Huang
 
Rebgv stats-pkg-may-2019
Rebgv stats-pkg-may-2019Rebgv stats-pkg-may-2019
Rebgv stats-pkg-may-2019Kathryn Huang
 
Rebgv stats-pkg-february-2019
Rebgv stats-pkg-february-2019Rebgv stats-pkg-february-2019
Rebgv stats-pkg-february-2019Kathryn Huang
 
2021 June - REBGV Statistics Package
2021 June - REBGV Statistics Package2021 June - REBGV Statistics Package
2021 June - REBGV Statistics PackageVicky Aulakh
 
Rebgv stats-pkg-july-2019
Rebgv stats-pkg-july-2019Rebgv stats-pkg-july-2019
Rebgv stats-pkg-july-2019Vicky Aulakh
 
Real Estate Board of Greater Vancouver Statistics Package - November 2021
Real Estate Board of Greater Vancouver Statistics Package - November 2021Real Estate Board of Greater Vancouver Statistics Package - November 2021
Real Estate Board of Greater Vancouver Statistics Package - November 2021VickyAulakh1
 
Rebgv stats-pkg-august-2019
Rebgv stats-pkg-august-2019Rebgv stats-pkg-august-2019
Rebgv stats-pkg-august-2019Vicky Aulakh
 
REBGV January 2020 Statistics Package
REBGV January 2020 Statistics Package REBGV January 2020 Statistics Package
REBGV January 2020 Statistics Package Vicky Aulakh
 
May 2017 REBGV Stats
May 2017 REBGV Stats May 2017 REBGV Stats
May 2017 REBGV Stats Mike Stewart
 
Rebgv stats-pkg-april-2019
Rebgv stats-pkg-april-2019Rebgv stats-pkg-april-2019
Rebgv stats-pkg-april-2019Kathryn Huang
 
REBGV Statistics Package May 2020
REBGV Statistics Package May 2020REBGV Statistics Package May 2020
REBGV Statistics Package May 2020Vicky Aulakh
 

What's hot (20)

Rebgv stats-pkg-november-2018
Rebgv stats-pkg-november-2018Rebgv stats-pkg-november-2018
Rebgv stats-pkg-november-2018
 
Rebgv stats-pkg-june-2019
Rebgv stats-pkg-june-2019Rebgv stats-pkg-june-2019
Rebgv stats-pkg-june-2019
 
Rebgv stats-pkg-february-2019
Rebgv stats-pkg-february-2019Rebgv stats-pkg-february-2019
Rebgv stats-pkg-february-2019
 
Real Estate Board of Greater Vancouver Statistics Package July 2021
Real Estate Board of Greater Vancouver Statistics Package July 2021Real Estate Board of Greater Vancouver Statistics Package July 2021
Real Estate Board of Greater Vancouver Statistics Package July 2021
 
REBGV Statistics Package April 2021
REBGV Statistics Package April 2021REBGV Statistics Package April 2021
REBGV Statistics Package April 2021
 
Rebgv stats-pkg-november-2019-f
Rebgv stats-pkg-november-2019-fRebgv stats-pkg-november-2019-f
Rebgv stats-pkg-november-2019-f
 
REBGV Statistics Package October 2020
REBGV Statistics Package October 2020REBGV Statistics Package October 2020
REBGV Statistics Package October 2020
 
REBGV Statistics Package August 2020
REBGV Statistics Package August 2020REBGV Statistics Package August 2020
REBGV Statistics Package August 2020
 
Real Estate Board of Greater Vancouver Statistics Package August 2021
Real Estate Board of Greater Vancouver Statistics Package August 2021Real Estate Board of Greater Vancouver Statistics Package August 2021
Real Estate Board of Greater Vancouver Statistics Package August 2021
 
Rebgv stats-pkg-march-2019
Rebgv stats-pkg-march-2019Rebgv stats-pkg-march-2019
Rebgv stats-pkg-march-2019
 
Rebgv stats-pkg-may-2019
Rebgv stats-pkg-may-2019Rebgv stats-pkg-may-2019
Rebgv stats-pkg-may-2019
 
Rebgv stats-pkg-february-2019
Rebgv stats-pkg-february-2019Rebgv stats-pkg-february-2019
Rebgv stats-pkg-february-2019
 
2021 June - REBGV Statistics Package
2021 June - REBGV Statistics Package2021 June - REBGV Statistics Package
2021 June - REBGV Statistics Package
 
Rebgv stats-pkg-july-2019
Rebgv stats-pkg-july-2019Rebgv stats-pkg-july-2019
Rebgv stats-pkg-july-2019
 
Real Estate Board of Greater Vancouver Statistics Package - November 2021
Real Estate Board of Greater Vancouver Statistics Package - November 2021Real Estate Board of Greater Vancouver Statistics Package - November 2021
Real Estate Board of Greater Vancouver Statistics Package - November 2021
 
Rebgv stats-pkg-august-2019
Rebgv stats-pkg-august-2019Rebgv stats-pkg-august-2019
Rebgv stats-pkg-august-2019
 
REBGV January 2020 Statistics Package
REBGV January 2020 Statistics Package REBGV January 2020 Statistics Package
REBGV January 2020 Statistics Package
 
May 2017 REBGV Stats
May 2017 REBGV Stats May 2017 REBGV Stats
May 2017 REBGV Stats
 
Rebgv stats-pkg-april-2019
Rebgv stats-pkg-april-2019Rebgv stats-pkg-april-2019
Rebgv stats-pkg-april-2019
 
REBGV Statistics Package May 2020
REBGV Statistics Package May 2020REBGV Statistics Package May 2020
REBGV Statistics Package May 2020
 

Similar to Rebgv stats-pkg-april-2018

Rebgv stats-pkg-august-2018
Rebgv stats-pkg-august-2018Rebgv stats-pkg-august-2018
Rebgv stats-pkg-august-2018Kathryn Huang
 
Rebgv Stats Package September 2020
Rebgv Stats Package September 2020Rebgv Stats Package September 2020
Rebgv Stats Package September 2020Vicky Aulakh
 
Rebgv stats-pkg-october-2018 .pdf
Rebgv stats-pkg-october-2018 .pdf Rebgv stats-pkg-october-2018 .pdf
Rebgv stats-pkg-october-2018 .pdf Kathryn Huang
 
Rebgv stats-pkg-september-2018
Rebgv stats-pkg-september-2018Rebgv stats-pkg-september-2018
Rebgv stats-pkg-september-2018Kathryn Huang
 
May-2019 Stats Package for Greater Vancouver
May-2019 Stats Package for Greater VancouverMay-2019 Stats Package for Greater Vancouver
May-2019 Stats Package for Greater VancouverBC PRIME Realty
 
March 2017 Rebgv Stats Package Mike Stewart
March 2017 Rebgv Stats Package Mike StewartMarch 2017 Rebgv Stats Package Mike Stewart
March 2017 Rebgv Stats Package Mike StewartMike Stewart
 
August 2017 REBGV Stats Mike Stewart Realtor
August 2017 REBGV Stats Mike Stewart RealtorAugust 2017 REBGV Stats Mike Stewart Realtor
August 2017 REBGV Stats Mike Stewart RealtorMike Stewart
 
November 2017 rebgv stats mike stewart real estate agent
November 2017 rebgv stats mike stewart real estate agentNovember 2017 rebgv stats mike stewart real estate agent
November 2017 rebgv stats mike stewart real estate agentMike Stewart
 
Rebgv stats-pkg-september-2019
Rebgv stats-pkg-september-2019Rebgv stats-pkg-september-2019
Rebgv stats-pkg-september-2019Vicky Aulakh
 
Rebgv stats-pkg-march-2019
Rebgv stats-pkg-march-2019Rebgv stats-pkg-march-2019
Rebgv stats-pkg-march-2019Sherryl Jacobs
 
February 2017 REBGV Statistics Package Mike Stewart Realtor
February 2017 REBGV Statistics Package Mike Stewart RealtorFebruary 2017 REBGV Statistics Package Mike Stewart Realtor
February 2017 REBGV Statistics Package Mike Stewart RealtorMike Stewart
 
July 2017 Real Estate Board of Greater Vancouver Stats Package Mike Stewart r...
July 2017 Real Estate Board of Greater Vancouver Stats Package Mike Stewart r...July 2017 Real Estate Board of Greater Vancouver Stats Package Mike Stewart r...
July 2017 Real Estate Board of Greater Vancouver Stats Package Mike Stewart r...Mike Stewart
 
REBGV STATS PACKAGE JULY 2017
REBGV STATS PACKAGE JULY 2017REBGV STATS PACKAGE JULY 2017
REBGV STATS PACKAGE JULY 2017Marcella Riccardi
 
Real Estate Board of Greater Vancouver Statistics Package January 2021
Real Estate Board of Greater Vancouver Statistics Package January 2021 Real Estate Board of Greater Vancouver Statistics Package January 2021
Real Estate Board of Greater Vancouver Statistics Package January 2021 Vicky Aulakh
 
Real Estate Board of Greater Vancouver Statistics Package October 2021
Real Estate Board of Greater Vancouver Statistics Package October 2021Real Estate Board of Greater Vancouver Statistics Package October 2021
Real Estate Board of Greater Vancouver Statistics Package October 2021VickyAulakh1
 
REBGV September 2016 Stats Package Mike Stewart Vancouver Realtor
REBGV September 2016 Stats Package Mike Stewart Vancouver RealtorREBGV September 2016 Stats Package Mike Stewart Vancouver Realtor
REBGV September 2016 Stats Package Mike Stewart Vancouver RealtorMike Stewart
 

Similar to Rebgv stats-pkg-april-2018 (17)

Rebgv stats-pkg-august-2018
Rebgv stats-pkg-august-2018Rebgv stats-pkg-august-2018
Rebgv stats-pkg-august-2018
 
Rebgv Stats Package September 2020
Rebgv Stats Package September 2020Rebgv Stats Package September 2020
Rebgv Stats Package September 2020
 
Rebgv stats-pkg-october-2018 .pdf
Rebgv stats-pkg-october-2018 .pdf Rebgv stats-pkg-october-2018 .pdf
Rebgv stats-pkg-october-2018 .pdf
 
Rebgv stats-pkg-september-2018
Rebgv stats-pkg-september-2018Rebgv stats-pkg-september-2018
Rebgv stats-pkg-september-2018
 
May-2019 Stats Package for Greater Vancouver
May-2019 Stats Package for Greater VancouverMay-2019 Stats Package for Greater Vancouver
May-2019 Stats Package for Greater Vancouver
 
March 2017 Rebgv Stats Package Mike Stewart
March 2017 Rebgv Stats Package Mike StewartMarch 2017 Rebgv Stats Package Mike Stewart
March 2017 Rebgv Stats Package Mike Stewart
 
August 2017 REBGV Stats Mike Stewart Realtor
August 2017 REBGV Stats Mike Stewart RealtorAugust 2017 REBGV Stats Mike Stewart Realtor
August 2017 REBGV Stats Mike Stewart Realtor
 
November 2017 rebgv stats mike stewart real estate agent
November 2017 rebgv stats mike stewart real estate agentNovember 2017 rebgv stats mike stewart real estate agent
November 2017 rebgv stats mike stewart real estate agent
 
Rebgv stats-pkg-october-2020
Rebgv stats-pkg-october-2020Rebgv stats-pkg-october-2020
Rebgv stats-pkg-october-2020
 
Rebgv stats-pkg-september-2019
Rebgv stats-pkg-september-2019Rebgv stats-pkg-september-2019
Rebgv stats-pkg-september-2019
 
Rebgv stats-pkg-march-2019
Rebgv stats-pkg-march-2019Rebgv stats-pkg-march-2019
Rebgv stats-pkg-march-2019
 
February 2017 REBGV Statistics Package Mike Stewart Realtor
February 2017 REBGV Statistics Package Mike Stewart RealtorFebruary 2017 REBGV Statistics Package Mike Stewart Realtor
February 2017 REBGV Statistics Package Mike Stewart Realtor
 
July 2017 Real Estate Board of Greater Vancouver Stats Package Mike Stewart r...
July 2017 Real Estate Board of Greater Vancouver Stats Package Mike Stewart r...July 2017 Real Estate Board of Greater Vancouver Stats Package Mike Stewart r...
July 2017 Real Estate Board of Greater Vancouver Stats Package Mike Stewart r...
 
REBGV STATS PACKAGE JULY 2017
REBGV STATS PACKAGE JULY 2017REBGV STATS PACKAGE JULY 2017
REBGV STATS PACKAGE JULY 2017
 
Real Estate Board of Greater Vancouver Statistics Package January 2021
Real Estate Board of Greater Vancouver Statistics Package January 2021 Real Estate Board of Greater Vancouver Statistics Package January 2021
Real Estate Board of Greater Vancouver Statistics Package January 2021
 
Real Estate Board of Greater Vancouver Statistics Package October 2021
Real Estate Board of Greater Vancouver Statistics Package October 2021Real Estate Board of Greater Vancouver Statistics Package October 2021
Real Estate Board of Greater Vancouver Statistics Package October 2021
 
REBGV September 2016 Stats Package Mike Stewart Vancouver Realtor
REBGV September 2016 Stats Package Mike Stewart Vancouver RealtorREBGV September 2016 Stats Package Mike Stewart Vancouver Realtor
REBGV September 2016 Stats Package Mike Stewart Vancouver Realtor
 

More from Kathryn Huang

Disclosureof representationintradingservices english-recbc (4)
Disclosureof representationintradingservices english-recbc (4)Disclosureof representationintradingservices english-recbc (4)
Disclosureof representationintradingservices english-recbc (4)Kathryn Huang
 
Property disclosure statement strata title properties mike stewart prec
Property disclosure statement strata title properties mike stewart precProperty disclosure statement strata title properties mike stewart prec
Property disclosure statement strata title properties mike stewart precKathryn Huang
 
Privacy noticeandconsent (3)
Privacy noticeandconsent (3)Privacy noticeandconsent (3)
Privacy noticeandconsent (3)Kathryn Huang
 
Rebgv stats-pkg-january-2019
Rebgv stats-pkg-january-2019Rebgv stats-pkg-january-2019
Rebgv stats-pkg-january-2019Kathryn Huang
 
Rebgv stats-pkg-december-2018
Rebgv stats-pkg-december-2018Rebgv stats-pkg-december-2018
Rebgv stats-pkg-december-2018Kathryn Huang
 
Broadway corridor-planning-program-presentation-may-2018
Broadway corridor-planning-program-presentation-may-2018Broadway corridor-planning-program-presentation-may-2018
Broadway corridor-planning-program-presentation-may-2018Kathryn Huang
 
2018 03-metro-vancouver
2018 03-metro-vancouver 2018 03-metro-vancouver
2018 03-metro-vancouver Kathryn Huang
 
2017 Real Estate Board of Greater Vancouver Statistics Package with Charts & ...
2017 Real Estate Board of Greater Vancouver Statistics Package with Charts & ...2017 Real Estate Board of Greater Vancouver Statistics Package with Charts & ...
2017 Real Estate Board of Greater Vancouver Statistics Package with Charts & ...Kathryn Huang
 

More from Kathryn Huang (10)

Disclosureof representationintradingservices english-recbc (4)
Disclosureof representationintradingservices english-recbc (4)Disclosureof representationintradingservices english-recbc (4)
Disclosureof representationintradingservices english-recbc (4)
 
Property disclosure statement strata title properties mike stewart prec
Property disclosure statement strata title properties mike stewart precProperty disclosure statement strata title properties mike stewart prec
Property disclosure statement strata title properties mike stewart prec
 
2516 bc
2516 bc2516 bc
2516 bc
 
Privacy noticeandconsent (3)
Privacy noticeandconsent (3)Privacy noticeandconsent (3)
Privacy noticeandconsent (3)
 
Rebgv stats-pkg-january-2019
Rebgv stats-pkg-january-2019Rebgv stats-pkg-january-2019
Rebgv stats-pkg-january-2019
 
Rebgv stats-pkg-december-2018
Rebgv stats-pkg-december-2018Rebgv stats-pkg-december-2018
Rebgv stats-pkg-december-2018
 
2440 bc
2440 bc2440 bc
2440 bc
 
Broadway corridor-planning-program-presentation-may-2018
Broadway corridor-planning-program-presentation-may-2018Broadway corridor-planning-program-presentation-may-2018
Broadway corridor-planning-program-presentation-may-2018
 
2018 03-metro-vancouver
2018 03-metro-vancouver 2018 03-metro-vancouver
2018 03-metro-vancouver
 
2017 Real Estate Board of Greater Vancouver Statistics Package with Charts & ...
2017 Real Estate Board of Greater Vancouver Statistics Package with Charts & ...2017 Real Estate Board of Greater Vancouver Statistics Package with Charts & ...
2017 Real Estate Board of Greater Vancouver Statistics Package with Charts & ...
 

Recently uploaded

Call Girls in Pitampura Delhi 💯Call Us 🔝8264348440🔝
Call Girls in Pitampura Delhi 💯Call Us 🔝8264348440🔝Call Girls in Pitampura Delhi 💯Call Us 🔝8264348440🔝
Call Girls in Pitampura Delhi 💯Call Us 🔝8264348440🔝soniya singh
 
Eco-Efficient Living: Redefining Sustainability through Leech's Green Design ...
Eco-Efficient Living: Redefining Sustainability through Leech's Green Design ...Eco-Efficient Living: Redefining Sustainability through Leech's Green Design ...
Eco-Efficient Living: Redefining Sustainability through Leech's Green Design ...Newman George Leech
 
Call Girls in Inderpuri Delhi 💯Call Us 🔝8264348440🔝
Call Girls in Inderpuri Delhi 💯Call Us 🔝8264348440🔝Call Girls in Inderpuri Delhi 💯Call Us 🔝8264348440🔝
Call Girls in Inderpuri Delhi 💯Call Us 🔝8264348440🔝soniya singh
 
Model Call Girl in Shastri Nagar Delhi reach out to us at 🔝8264348440🔝
Model Call Girl in Shastri Nagar Delhi reach out to us at 🔝8264348440🔝Model Call Girl in Shastri Nagar Delhi reach out to us at 🔝8264348440🔝
Model Call Girl in Shastri Nagar Delhi reach out to us at 🔝8264348440🔝soniya singh
 
Call Girls in shastri nagar Delhi 8264348440 ✅ call girls ❤️
Call Girls in shastri nagar Delhi 8264348440 ✅ call girls ❤️Call Girls in shastri nagar Delhi 8264348440 ✅ call girls ❤️
Call Girls in shastri nagar Delhi 8264348440 ✅ call girls ❤️soniya singh
 
Building Dreams: Newman Leech's Visionary Approach to Real Estate Investment
Building Dreams: Newman Leech's Visionary Approach to Real Estate InvestmentBuilding Dreams: Newman Leech's Visionary Approach to Real Estate Investment
Building Dreams: Newman Leech's Visionary Approach to Real Estate InvestmentNewman George Leech
 
Call Girls In Madipur Metro Delhi꧁ +91)8447779280꧂Low Rate 2 short 2000 full ...
Call Girls In Madipur Metro Delhi꧁ +91)8447779280꧂Low Rate 2 short 2000 full ...Call Girls In Madipur Metro Delhi꧁ +91)8447779280꧂Low Rate 2 short 2000 full ...
Call Girls In Madipur Metro Delhi꧁ +91)8447779280꧂Low Rate 2 short 2000 full ...asmaqueen5
 
Low Rate Call Girls in Tughlakabad Delhi Call 9990771857
Low Rate Call Girls in Tughlakabad Delhi Call 9990771857Low Rate Call Girls in Tughlakabad Delhi Call 9990771857
Low Rate Call Girls in Tughlakabad Delhi Call 9990771857delhimodel235
 
call girls in Shahdara (DELHI) 🔝 >༒9953330565🔝 genuine Escort Service 🔝✔️✔️
call girls in Shahdara (DELHI) 🔝 >༒9953330565🔝 genuine Escort Service 🔝✔️✔️call girls in Shahdara (DELHI) 🔝 >༒9953330565🔝 genuine Escort Service 🔝✔️✔️
call girls in Shahdara (DELHI) 🔝 >༒9953330565🔝 genuine Escort Service 🔝✔️✔️9953056974 Low Rate Call Girls In Saket, Delhi NCR
 
Call Girls in Model Town Delhi 💯Call Us 🔝8264348440🔝
Call Girls in Model Town Delhi 💯Call Us 🔝8264348440🔝Call Girls in Model Town Delhi 💯Call Us 🔝8264348440🔝
Call Girls in Model Town Delhi 💯Call Us 🔝8264348440🔝soniya singh
 
Call Girls In Mundka Industrial Metro@꧂8447779280 ↬Enjoy ꧂Escort Service in ...
Call Girls In Mundka Industrial Metro@꧂8447779280 ↬Enjoy ꧂Escort Service in  ...Call Girls In Mundka Industrial Metro@꧂8447779280 ↬Enjoy ꧂Escort Service in  ...
Call Girls In Mundka Industrial Metro@꧂8447779280 ↬Enjoy ꧂Escort Service in ...asmaqueen5
 
Call girls in Jeewan Park .Delhi↫8447779280↬ ꧂Escorts Service In Delhi Ncr
Call girls in Jeewan Park .Delhi↫8447779280↬ ꧂Escorts Service In Delhi NcrCall girls in Jeewan Park .Delhi↫8447779280↬ ꧂Escorts Service In Delhi Ncr
Call girls in Jeewan Park .Delhi↫8447779280↬ ꧂Escorts Service In Delhi Ncrasmaqueen5
 
8 Key Elements for Comfortable Farmland Living
8 Key Elements for Comfortable Farmland Living 8 Key Elements for Comfortable Farmland Living
8 Key Elements for Comfortable Farmland Living Farmland Bazaar
 
Call Girls in Sarai Kale Khan Delhi 💯Call Us 🔝8264348440🔝
Call Girls in Sarai Kale Khan Delhi 💯Call Us 🔝8264348440🔝Call Girls in Sarai Kale Khan Delhi 💯Call Us 🔝8264348440🔝
Call Girls in Sarai Kale Khan Delhi 💯Call Us 🔝8264348440🔝soniya singh
 
Low Rate Call Girls In Madipur Slum Quarter +91)8447779280Low Rate 2 short 2...
Low Rate Call Girls In Madipur Slum Quarter  +91)8447779280Low Rate 2 short 2...Low Rate Call Girls In Madipur Slum Quarter  +91)8447779280Low Rate 2 short 2...
Low Rate Call Girls In Madipur Slum Quarter +91)8447779280Low Rate 2 short 2...asmaqueen5
 
Cashpay_Call Girls In Gaur City Mall Noida ❤️8860477959 Escorts Service In 24...
Cashpay_Call Girls In Gaur City Mall Noida ❤️8860477959 Escorts Service In 24...Cashpay_Call Girls In Gaur City Mall Noida ❤️8860477959 Escorts Service In 24...
Cashpay_Call Girls In Gaur City Mall Noida ❤️8860477959 Escorts Service In 24...lizamodels9
 
Call Girls in Nehru Place Delhi 💯Call Us 🔝8264348440🔝
Call Girls in Nehru Place Delhi 💯Call Us 🔝8264348440🔝Call Girls in Nehru Place Delhi 💯Call Us 🔝8264348440🔝
Call Girls in Nehru Place Delhi 💯Call Us 🔝8264348440🔝soniya singh
 
Low Rate Call Girls in Akshardham Delhi Call 9990771857
Low Rate Call Girls in Akshardham   Delhi Call 9990771857Low Rate Call Girls in Akshardham   Delhi Call 9990771857
Low Rate Call Girls in Akshardham Delhi Call 9990771857delhimodel235
 

Recently uploaded (20)

Call Girls in Pitampura Delhi 💯Call Us 🔝8264348440🔝
Call Girls in Pitampura Delhi 💯Call Us 🔝8264348440🔝Call Girls in Pitampura Delhi 💯Call Us 🔝8264348440🔝
Call Girls in Pitampura Delhi 💯Call Us 🔝8264348440🔝
 
Eco-Efficient Living: Redefining Sustainability through Leech's Green Design ...
Eco-Efficient Living: Redefining Sustainability through Leech's Green Design ...Eco-Efficient Living: Redefining Sustainability through Leech's Green Design ...
Eco-Efficient Living: Redefining Sustainability through Leech's Green Design ...
 
Call Girls in Inderpuri Delhi 💯Call Us 🔝8264348440🔝
Call Girls in Inderpuri Delhi 💯Call Us 🔝8264348440🔝Call Girls in Inderpuri Delhi 💯Call Us 🔝8264348440🔝
Call Girls in Inderpuri Delhi 💯Call Us 🔝8264348440🔝
 
Model Call Girl in Shastri Nagar Delhi reach out to us at 🔝8264348440🔝
Model Call Girl in Shastri Nagar Delhi reach out to us at 🔝8264348440🔝Model Call Girl in Shastri Nagar Delhi reach out to us at 🔝8264348440🔝
Model Call Girl in Shastri Nagar Delhi reach out to us at 🔝8264348440🔝
 
Call Girls in shastri nagar Delhi 8264348440 ✅ call girls ❤️
Call Girls in shastri nagar Delhi 8264348440 ✅ call girls ❤️Call Girls in shastri nagar Delhi 8264348440 ✅ call girls ❤️
Call Girls in shastri nagar Delhi 8264348440 ✅ call girls ❤️
 
Building Dreams: Newman Leech's Visionary Approach to Real Estate Investment
Building Dreams: Newman Leech's Visionary Approach to Real Estate InvestmentBuilding Dreams: Newman Leech's Visionary Approach to Real Estate Investment
Building Dreams: Newman Leech's Visionary Approach to Real Estate Investment
 
Call Girls In Madipur Metro Delhi꧁ +91)8447779280꧂Low Rate 2 short 2000 full ...
Call Girls In Madipur Metro Delhi꧁ +91)8447779280꧂Low Rate 2 short 2000 full ...Call Girls In Madipur Metro Delhi꧁ +91)8447779280꧂Low Rate 2 short 2000 full ...
Call Girls In Madipur Metro Delhi꧁ +91)8447779280꧂Low Rate 2 short 2000 full ...
 
Low Rate Call Girls in Tughlakabad Delhi Call 9990771857
Low Rate Call Girls in Tughlakabad Delhi Call 9990771857Low Rate Call Girls in Tughlakabad Delhi Call 9990771857
Low Rate Call Girls in Tughlakabad Delhi Call 9990771857
 
call girls in Shahdara (DELHI) 🔝 >༒9953330565🔝 genuine Escort Service 🔝✔️✔️
call girls in Shahdara (DELHI) 🔝 >༒9953330565🔝 genuine Escort Service 🔝✔️✔️call girls in Shahdara (DELHI) 🔝 >༒9953330565🔝 genuine Escort Service 🔝✔️✔️
call girls in Shahdara (DELHI) 🔝 >༒9953330565🔝 genuine Escort Service 🔝✔️✔️
 
Low Rate Call Girls in Triveni Complex Delhi Call 9873940964
Low Rate Call Girls in Triveni Complex Delhi Call 9873940964Low Rate Call Girls in Triveni Complex Delhi Call 9873940964
Low Rate Call Girls in Triveni Complex Delhi Call 9873940964
 
Call Girls in Model Town Delhi 💯Call Us 🔝8264348440🔝
Call Girls in Model Town Delhi 💯Call Us 🔝8264348440🔝Call Girls in Model Town Delhi 💯Call Us 🔝8264348440🔝
Call Girls in Model Town Delhi 💯Call Us 🔝8264348440🔝
 
Call Girls In Mundka Industrial Metro@꧂8447779280 ↬Enjoy ꧂Escort Service in ...
Call Girls In Mundka Industrial Metro@꧂8447779280 ↬Enjoy ꧂Escort Service in  ...Call Girls In Mundka Industrial Metro@꧂8447779280 ↬Enjoy ꧂Escort Service in  ...
Call Girls In Mundka Industrial Metro@꧂8447779280 ↬Enjoy ꧂Escort Service in ...
 
Call girls in Jeewan Park .Delhi↫8447779280↬ ꧂Escorts Service In Delhi Ncr
Call girls in Jeewan Park .Delhi↫8447779280↬ ꧂Escorts Service In Delhi NcrCall girls in Jeewan Park .Delhi↫8447779280↬ ꧂Escorts Service In Delhi Ncr
Call girls in Jeewan Park .Delhi↫8447779280↬ ꧂Escorts Service In Delhi Ncr
 
8 Key Elements for Comfortable Farmland Living
8 Key Elements for Comfortable Farmland Living 8 Key Elements for Comfortable Farmland Living
8 Key Elements for Comfortable Farmland Living
 
Call Girls in Sarai Kale Khan Delhi 💯Call Us 🔝8264348440🔝
Call Girls in Sarai Kale Khan Delhi 💯Call Us 🔝8264348440🔝Call Girls in Sarai Kale Khan Delhi 💯Call Us 🔝8264348440🔝
Call Girls in Sarai Kale Khan Delhi 💯Call Us 🔝8264348440🔝
 
Low Rate Call Girls In Madipur Slum Quarter +91)8447779280Low Rate 2 short 2...
Low Rate Call Girls In Madipur Slum Quarter  +91)8447779280Low Rate 2 short 2...Low Rate Call Girls In Madipur Slum Quarter  +91)8447779280Low Rate 2 short 2...
Low Rate Call Girls In Madipur Slum Quarter +91)8447779280Low Rate 2 short 2...
 
Call Girls in Mahavir Nagar whatsaap call US +919953056974
Call Girls in Mahavir Nagar  whatsaap call US  +919953056974Call Girls in Mahavir Nagar  whatsaap call US  +919953056974
Call Girls in Mahavir Nagar whatsaap call US +919953056974
 
Cashpay_Call Girls In Gaur City Mall Noida ❤️8860477959 Escorts Service In 24...
Cashpay_Call Girls In Gaur City Mall Noida ❤️8860477959 Escorts Service In 24...Cashpay_Call Girls In Gaur City Mall Noida ❤️8860477959 Escorts Service In 24...
Cashpay_Call Girls In Gaur City Mall Noida ❤️8860477959 Escorts Service In 24...
 
Call Girls in Nehru Place Delhi 💯Call Us 🔝8264348440🔝
Call Girls in Nehru Place Delhi 💯Call Us 🔝8264348440🔝Call Girls in Nehru Place Delhi 💯Call Us 🔝8264348440🔝
Call Girls in Nehru Place Delhi 💯Call Us 🔝8264348440🔝
 
Low Rate Call Girls in Akshardham Delhi Call 9990771857
Low Rate Call Girls in Akshardham   Delhi Call 9990771857Low Rate Call Girls in Akshardham   Delhi Call 9990771857
Low Rate Call Girls in Akshardham Delhi Call 9990771857
 

Rebgv stats-pkg-april-2018