
Recommended
Recommended
More Related Content
What's hot
What's hot (20)
Similar to Rebgv stats-pkg-february-2019
Similar to Rebgv stats-pkg-february-2019 (19)
More from Kathryn Huang
More from Kathryn Huang (14)
Recently uploaded
Recently uploaded (20)
Rebgv stats-pkg-february-2019
- 1. News Release FOR IMMEDIATE RELEASE: Housing market conditions continue to favour home buyers VANCOUVER, BC – March 4, 2019 – The Metro Vancouver* housing market saw increased supply from home sellers and below average demand from home buyers in February. The Real Estate Board of Greater Vancouver (REBGV) reports that residential home sales in the region totalled 1,484 in February 2019, a 32.8 per cent decrease from the 2,207 sales recorded in February 2018, and a 34.5 per cent increase from the 1,103 homes sold in January 2019. Last month’s sales were 42.5 per cent below the 10-year February sales average. “For much of the past four years, we’ve been in a sellers’ market. Conditions have shifted over the last 12 months to favour buyers, particularly in the detached home market,” Phil Moore, REBGV president said. “This means that home buyers face less competition today, have more selection to choose from and more time to make their decisions.” There were 3,892 detached, attached and apartment properties newly listed for sale on the Multiple Listing Service® (MLS®) in Metro Vancouver in February 2019. This represents a 7.8 per cent decrease compared to the 4,223 homes listed in February 2018 and a 19.7 per cent decrease compared to the 4,848 homes listed in January 2019. The total number of homes currently listed for sale on the MLS® system in Metro Vancouver is 11,590, a 48.2 per cent increase compared to February 2018 (7,822) and a 7.2 per cent increase compared to January 2019 (10,808). For all property types, the sales-to-active listings ratio for February 2019 is 12.8 per cent. Generally, analysts say that downward pressure on home prices occurs when the ratio dips below the 12 per cent mark for a sustained period, while home prices often experience upward pressure when it surpasses 20 per cent over several months. “Homes priced well for today’s market are attracting interest, however, buyers are choosing to take a wait-and-see approach for the time being,” Moore said. “REALTORS® continue to experience more traffic at open houses. We’ll see if this trend leads to increased sales activity during the spring market.” The MLS® Home Price Index composite benchmark price for all residential properties in Metro Vancouver is currently $1,016,600. This represents a 6.1 per cent decrease over February 2018, a 6.2 per cent decrease over the past six months, and a 0.3 per cent decrease compared to January 2019.
- 2. Sales of detached homes in February 2019 reached 448, a 27.9 per decrease cent from the 621 detached sales recorded in February 2018. The benchmark price for detached properties is $1,443,100. This represents a 9.7 per cent decrease from February 2018, a 7.6 per cent decrease over the past six months, and a 0.7 per cent decrease compared to January 2019. Sales of apartment homes reached 759 in February 2019, a 35.9 per cent decrease compared to the 1,185 sales in February 2018. The benchmark price of an apartment property is $660,300. This represents a four per cent decrease from February 2018, a 5.1 per cent decrease over the past six months, and a 0.3 per cent increase compared to January 2019. Attached home sales in February 2019 totalled 277, a 30.9 per cent decrease compared to the 401 sales in February 2018. The benchmark price of an attached unit is $789,300. This represents a 3.3 per cent decrease from February 2018, a 6.7 per cent decrease over the past six months, and a 1.4 per cent decrease compared to January 2019. -30- *Editor’s Note: Areas covered by the Real Estate Board of Greater Vancouver include: Whistler, Sunshine Coast, Squamish, West Vancouver, North Vancouver, Vancouver, Burnaby, New Westminster, Richmond, Port Moody, Port Coquitlam, Coquitlam, Pitt Meadows, Maple Ridge, and South Delta. The real estate industry is a key economic driver in British Columbia. In 2018, 24,619 homes changed ownership in the Board’s area, generating $1.7 billion in economic spin-off activity and an estimated 11,720 jobs. The total dollar value of residential sales transacted through the MLS® system in Greater Vancouver totalled $26 billion in 2018. The Real Estate Board of Greater Vancouver is an association representing more than 14,000 REALTORS® and their companies. The Board provides a variety of member services, including the Multiple Listing Service®. For more information on real estate, statistics, and buying or selling a home, contact a local REALTOR® or visit www.rebgv.org. For more information please contact: Craig Munn Manager, Communication Real Estate Board of Greater Vancouver 604.730.3146 cmunn@rebgv.org
- 3. Property Type Area Benchmark Price Price Index 1 Month Change % 3 Month Change % 6 Month Change % 1 Year Change % 3 Year Change % 5 Year Change % 10 Year Change % Residential / Composite Lower Mainland $954,700 262.1 -0.2% -2.4% -6.0% -5.0% 31.2% 68.1% 101.3% Greater Vancouver $1,016,600 263.2 -0.3% -2.4% -6.2% -6.1% 25.0% 63.4% 102.3% Bowen Island $990,300 214.7 2.1% 0.8% 0.6% 1.6% 53.7% 77.7% 76.9% Burnaby East $950,000 263.5 -0.6% -2.9% -6.4% -6.0% 28.3% 61.0% 103.0% Burnaby North $864,000 260.9 -1.2% -4.8% -7.5% -7.3% 29.1% 65.5% 99.9% Burnaby South $992,700 280.4 0.4% -1.1% -4.3% -4.3% 35.6% 70.7% 114.5% Coquitlam $914,000 271.1 0.2% -1.6% -6.6% -3.4% 34.1% 77.3% 113.3% Ladner $821,500 230.6 -1.6% -3.0% -7.8% -5.1% 14.2% 52.0% 75.8% Maple Ridge $746,500 237.7 -0.8% -2.9% -6.7% -4.3% 47.5% 78.6% 87.8% New Westminster $649,800 285.5 -1.3% -5.5% -7.1% -4.0% 43.4% 77.3% 111.2% North Vancouver $1,012,000 230.7 -0.7% -3.8% -7.5% -7.5% 18.9% 56.5% 87.9% Pitt Meadows $749,000 272.3 -1.4% -1.4% -5.5% -0.2% 56.9% 87.1% 109.9% Port Coquitlam $756,300 258.9 0.0% -0.6% -4.4% -2.7% 38.4% 78.9% 97.9% Port Moody $896,500 247.8 -1.8% -4.8% -7.4% -5.5% 30.8% 72.3% 96.7% Richmond $968,300 279.0 -0.8% -2.2% -6.0% -6.3% 24.1% 63.4% 109.1% Squamish $757,300 237.7 -0.2% -1.4% -4.8% -1.3% 49.8% 99.4% 84.5% Sunshine Coast $608,800 213.3 0.7% -0.4% -2.1% 3.4% 52.2% 80.3% 72.4% Tsawwassen $955,600 240.0 1.2% -1.8% -5.0% -4.0% 15.0% 58.2% 87.8% Vancouver East $1,031,700 302.1 0.6% -2.4% -6.2% -6.7% 22.3% 66.0% 121.2% Vancouver West $1,260,100 265.7 -0.2% -1.6% -5.7% -8.3% 14.4% 52.1% 104.2% West Vancouver $2,228,700 239.6 -0.4% -5.5% -8.0% -16.1% -1.8% 37.3% 101.0% Whistler $904,100 195.8 0.3% -1.4% -6.9% -3.6% 52.6% 98.0% 51.1% Single Family Detached Lower Mainland $1,231,100 261.3 -0.2% -2.9% -6.4% -7.3% 18.0% 60.2% 105.6% Greater Vancouver $1,443,100 265.7 -0.7% -3.8% -7.6% -9.7% 10.0% 53.9% 107.6% Bowen Island $990,300 214.7 2.1% 0.8% 0.6% 1.6% 53.7% 77.7% 76.9% Burnaby East $1,172,100 262.1 0.4% -2.9% -7.6% -8.5% 10.5% 56.0% 109.5% Burnaby North $1,400,800 270.9 -1.0% -4.7% -6.7% -8.6% 5.3% 51.3% 109.4% Burnaby South $1,542,100 295.2 0.5% -4.3% -4.9% -8.4% 13.8% 56.4% 132.6% Coquitlam $1,182,800 262.5 -1.0% -3.8% -9.4% -7.4% 16.7% 64.0% 107.5% Ladner $933,000 224.9 -1.1% -1.7% -7.6% -7.1% 5.1% 50.2% 75.0% Maple Ridge $807,000 229.9 0.3% -2.8% -7.3% -4.8% 39.5% 76.4% 88.9% New Westminster $1,059,100 264.2 0.5% -2.8% -6.4% -8.7% 13.2% 57.4% 108.5% North Vancouver $1,492,400 233.4 -1.3% -4.9% -9.5% -11.5% 6.6% 55.2% 93.2% Pitt Meadows $896,000 252.5 -0.6% 0.2% -4.8% -1.8% 40.5% 80.7% 104.8% Port Coquitlam $928,200 247.5 -1.6% -5.1% -7.9% -5.9% 16.5% 65.9% 97.7% Port Moody $1,404,100 259.3 -3.5% -6.3% -8.2% -5.4% 19.2% 62.2% 102.7% Richmond $1,546,500 299.6 -2.2% -3.8% -7.4% -12.1% 7.2% 57.0% 121.1% Squamish $1,003,700 253.7 2.1% 2.9% 0.3% 1.8% 53.0% 107.3% 104.1% Sunshine Coast $603,700 211.5 0.6% -0.4% -2.3% 3.2% 51.6% 79.5% 70.8% Tsawwassen $1,191,700 256.6 3.4% -0.5% -4.7% -4.6% 11.3% 63.9% 106.6% Vancouver East $1,412,900 312.3 -1.1% -3.9% -7.6% -9.5% 11.6% 61.5% 137.9% Vancouver West $3,029,200 311.0 -0.7% -5.5% -7.6% -13.5% 0.8% 41.1% 128.2% West Vancouver $2,616,500 247.0 -0.2% -4.4% -7.6% -16.7% -4.1% 35.7% 108.8% Whistler $1,741,000 222.4 2.1% 2.3% -2.4% 0.5% 49.7% 93.4% 75.8% HOW TO READ THE TABLE: • Benchmark Price: Estimated sale price of a benchmark property. Benchmarks represent a typical property within each market. • Price Index: Index numbers estimate the percentage change in price on typical and constant quality properties over time. All figures are based on past sales. • x Month/Year Change %: Percentage change of index over a period of x month(s)/year(s) * In January 2005, the indexes are set to 100. Townhome properties are similar to Attached properties, a category that was used in the previous MLSLink HPI, but do not included duplexes. The above info is deemed reliable, but is not guaranteed. All dollar amounts in CDN. February 2019* * MLS®, Multiple Listing Service®, and all related graphics are trademarks of The Canadian Real Estate Association 1 of 15
- 4. Property Type Area Benchmark Price Price Index 1 Month Change % 3 Month Change % 6 Month Change % 1 Year Change % 3 Year Change % 5 Year Change % 10 Year Change % February 2019* Townhouse Lower Mainland $666,800 240.5 -1.3% -3.4% -6.4% -3.3% 39.3% 66.8% 84.7% Greater Vancouver $789,300 251.2 -1.4% -3.6% -6.7% -3.3% 33.5% 65.6% 91.5% Burnaby East $687,100 253.8 1.0% 0.4% -3.6% 0.3% 58.4% 63.1% 91.1% Burnaby North $715,300 267.0 -1.2% -3.7% -6.6% -4.9% 33.0% 66.6% 98.2% Burnaby South $807,300 278.1 1.8% 1.1% -4.1% 0.0% 46.8% 71.8% 108.8% Coquitlam $656,200 240.8 -2.4% -2.1% -5.0% -3.6% 33.6% 68.7% 88.3% Ladner $727,300 253.6 -1.8% -5.5% -11.1% -7.1% 25.2% 52.5% 87.2% Maple Ridge $525,200 243.8 -2.5% -4.5% -7.3% -4.8% 55.8% 77.8% 82.2% New Westminster $696,700 275.5 0.1% -2.3% -6.0% -2.2% 39.6% 68.7% 107.5% North Vancouver $956,500 232.4 -2.4% -5.8% -7.2% -4.2% 29.2% 60.6% 89.9% Pitt Meadows $615,700 266.4 -2.9% -5.4% -7.8% 4.8% 60.1% 90.1% 102.3% Port Coquitlam $621,300 235.2 -2.6% -2.8% -6.9% -5.1% 31.8% 65.9% 80.5% Port Moody $637,100 215.3 -1.1% -5.4% -7.4% -1.2% 21.1% 59.0% 69.0% Richmond $796,400 261.7 -1.5% -5.2% -8.0% -2.8% 30.3% 57.9% 96.5% Squamish $658,100 224.4 -0.5% -3.9% -7.2% -2.4% 40.0% 80.4% 74.2% Tsawwassen $703,200 261.9 -4.0% -4.9% -11.4% -7.0% 27.2% 57.2% 93.3% Vancouver East $823,800 270.4 -2.9% -0.8% -7.9% -5.2% 19.6% 63.9% 97.4% Vancouver West $1,208,500 266.9 -0.7% -3.1% -4.7% -3.3% 27.1% 68.4% 107.9% Whistler $879,200 219.9 0.8% -3.1% -6.6% -0.8% 49.7% 88.1% 70.7% Apartment Lower Mainland $644,400 272.3 0.3% -1.5% -5.5% -3.4% 49.2% 79.6% 102.9% Greater Vancouver $660,300 265.0 0.3% -1.1% -5.1% -4.0% 41.8% 73.1% 101.2% Burnaby East $718,900 275.8 -3.4% -5.7% -8.2% -9.6% 41.7% 62.2% 100.0% Burnaby North $599,900 256.1 -1.1% -5.1% -7.8% -6.6% 54.9% 78.6% 97.6% Burnaby South $689,400 276.8 0.2% -0.1% -4.0% -2.9% 50.4% 81.4% 109.5% Coquitlam $523,300 287.2 1.5% 0.2% -5.3% -0.4% 59.7% 95.0% 125.1% Ladner $445,400 211.1 -3.9% -3.8% -5.4% 0.5% 32.9% 47.4% 55.1% Maple Ridge $353,600 252.5 -1.6% -1.5% -5.5% -3.9% 66.4% 79.5% 81.8% New Westminster $515,000 291.8 -1.8% -6.4% -7.5% -3.2% 56.8% 84.6% 111.1% North Vancouver $561,500 225.3 0.4% -2.2% -5.9% -4.7% 35.5% 56.7% 80.1% Pitt Meadows $497,200 293.2 -1.2% -0.9% -5.7% -4.3% 71.9% 89.3% 111.1% Port Coquitlam $469,400 280.7 2.3% 3.9% -0.5% 0.3% 72.4% 98.9% 102.8% Port Moody $622,500 259.4 -1.1% -3.6% -6.9% -6.9% 50.7% 88.5% 110.6% Richmond $660,100 275.6 0.4% 0.3% -3.7% -2.0% 51.6% 78.3% 109.1% Squamish $459,100 221.1 -2.0% -3.4% -10.6% -6.0% 54.8% 125.6% 64.3% Tsawwassen $476,900 201.1 -4.1% -4.2% -4.3% 1.3% 39.1% 50.7% 47.8% Vancouver East $545,200 300.8 2.8% -1.1% -4.2% -3.6% 41.6% 74.8% 108.7% Vancouver West $784,300 254.5 0.1% 0.3% -4.9% -6.2% 24.8% 61.0% 98.2% West Vancouver $1,103,800 223.6 -0.4% -8.6% -7.3% -10.8% 21.2% 57.1% 83.4% Whistler $496,600 162.8 -1.9% -2.9% -10.8% -9.3% 65.8% 156.4% 22.8% HOW TO READ THE TABLE: • Benchmark Price: Estimated sale price of a benchmark property. Benchmarks represent a typical property within each market. • Price Index: Index numbers estimate the percentage change in price on typical and constant quality properties over time. All figures are based on past sales. • x Month/Year Change %: Percentage change of index over a period of x month(s)/year(s) In January 2005, the indexes are set to 100. * Townhome properties are similar to attached properties, a category that was used in the previous MLSLink HPI, but do not included duplexes. Lower Mainland includes areas serviced by both Real Estate Board of Greater Vancouver & Fraser Valley Real Estate Board. The above info is deemed reliable, but is not guaranteed. All dollar amounts in CDN. * MLS®, Multiple Listing Service®, and all related graphics are trademarks of The Canadian Real Estate Association 2 of 15
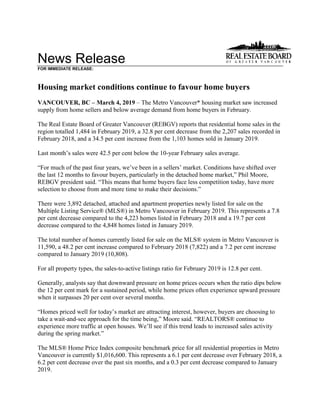
- 5. C:DATAMonthEndHpiexporthi_resgv-hpi2.tifGreaterVancouver 5YearTrend 60 110 160 210 260 310 Feb 2014 Apr 2014 Jun 2014 Aug 2014 Oct 2014 Dec 2014 Feb 2015 Apr 2015 Jun 2015 Aug 2015 Oct 2015 Dec 2015 Feb 2016 Apr 2016 Jun 2016 Aug 2016 Oct 2016 Dec 2016 Feb 2017 Apr 2017 Jun 2017 Aug 2017 Oct 2017 Dec 2017 Feb 2018 Apr 2018 Jun 2018 Aug 2018 Oct 2018 Dec 2018 Feb 2019 Price Index ResidentialDetachedTownhouseApartment Jan2005HPI=100
- 8. Listing & Sales Activity Summary Listings Sales 1 2 3 Col. 2 & 3 5 6 7 Col. 6 & 7 9 10 Col. 9 & 10 Feb Jan Feb Percentage Feb Jan Feb Percentage Dec 2017 - Dec 2018 - Percentage 2018 2019 2019 Variance 2018 2019 2019 Variance Feb 2018 Feb 2019 Variance BURNABY % % % DETACHED 159 142 115 -19.0 52 26 30 15.4 152 86 -43.4 ATTACHED 83 123 69 -43.9 60 24 29 20.8 140 65 -53.6 APARTMENTS 169 285 215 -24.6 144 80 124 55.0 401 280 -30.2 COQUITLAM DETACHED 128 161 122 -24.2 60 27 38 40.7 166 92 -44.6 ATTACHED 52 67 64 -4.5 30 18 31 72.2 81 69 -14.8 APARTMENTS 114 142 102 -28.2 87 42 65 54.8 246 149 -39.4 DELTA DETACHED 82 79 61 -22.8 30 16 18 12.5 70 53 -24.3 ATTACHED 11 25 26 4.0 7 7 8 14.3 23 23 0.0 APARTMENTS 19 26 18 -30.8 11 6 14 133.3 29 28 -3.4 MAPLE RIDGE/PITT MEADOWS DETACHED 150 153 133 -13.1 85 39 57 46.2 241 147 -39.0 ATTACHED 47 60 61 1.7 39 33 33 0.0 121 75 -38.0 APARTMENTS 74 65 47 -27.7 65 20 23 15.0 187 66 -64.7 NORTH VANCOUVER DETACHED 147 171 120 -29.8 58 35 37 5.7 158 113 -28.5 ATTACHED 38 77 52 -32.5 20 15 27 80.0 68 66 -2.9 APARTMENTS 131 179 155 -13.4 87 41 59 43.9 240 134 -44.2 NEW WESTMINSTER DETACHED 34 42 27 -35.7 22 10 13 30.0 50 36 -28.0 ATTACHED 13 17 15 -11.8 12 10 7 -30.0 39 23 -41.0 APARTMENTS 90 134 120 -10.4 66 55 42 -23.6 223 136 -39.0 PORT MOODY/BELCARRA DETACHED 29 34 29 -14.7 8 8 10 25.0 21 24 14.3 ATTACHED 23 13 16 23.1 12 5 5 0.0 38 20 -47.4 APARTMENTS 34 35 31 -11.4 22 18 15 -16.7 65 46 -29.2 PORT COQUITLAM DETACHED 43 42 47 11.9 27 13 17 30.8 60 48 -20.0 ATTACHED 35 31 34 9.7 19 9 16 77.8 52 40 -23.1 APARTMENTS 49 63 58 -7.9 38 16 21 31.3 99 55 -44.4 RICHMOND DETACHED 283 302 160 -47.0 52 30 36 20.0 185 95 -48.6 ATTACHED 116 159 87 -45.3 66 25 29 16.0 204 82 -59.8 APARTMENTS 237 289 226 -21.8 143 66 89 34.8 429 219 -49.0 SUNSHINE COAST DETACHED 68 67 74 10.4 35 19 36 89.5 120 69 -42.5 ATTACHED 16 15 8 -46.7 7 5 7 40.0 17 16 -5.9 APARTMENTS 4 16 12 -25.0 4 2 6 200.0 16 11 -31.3 SQUAMISH DETACHED 43 31 39 25.8 18 8 16 100.0 38 31 -18.4 ATTACHED 25 23 25 8.7 20 8 18 125.0 48 30 -37.5 APARTMENTS 19 17 10 -41.2 18 8 5 -37.5 35 16 -54.3 VANCOUVER EAST DETACHED 216 195 153 -21.5 77 44 54 22.7 210 140 -33.3 ATTACHED 66 67 62 -7.5 37 13 31 138.5 95 62 -34.7 APARTMENTS 187 194 168 -13.4 127 48 81 68.8 310 182 -41.3 VANCOUVER WEST DETACHED 248 235 188 -20.0 53 34 43 26.5 135 110 -18.5 ATTACHED 96 115 94 -18.3 44 20 24 20.0 94 62 -34.0 APARTMENTS 536 613 600 -2.1 332 133 186 39.8 826 458 -44.6 WHISTLER/PEMBERTON DETACHED 21 29 15 -48.3 19 9 10 11.1 47 21 -55.3 ATTACHED 32 36 30 -16.7 22 12 9 -25.0 60 29 -51.7 APARTMENTS 47 47 35 -25.5 29 17 18 5.9 74 45 -39.2 WEST VANCOUVER/HOWE SOUND DETACHED 155 160 113 -29.4 24 18 25 38.9 69 58 -15.9 ATTACHED 14 14 14 0.0 5 1 3 200.0 10 9 -10.0 APARTMENTS 34 54 40 -25.9 12 7 11 57.1 45 28 -37.8 GRAND TOTALS DETACHED 1806 1843 1396 -24.3 620 336 440 31.0 1722 1123 -34.8 ATTACHED 667 842 657 -22.0 400 205 277 35.1 1090 671 -38.4 APARTMENTS 1744 2159 1837 -14.9 1185 559 759 35.8 3225 1853 -42.5