SlideShare a Scribd company logo
1 of 9
Download to read offline
News Release
FOR IMMEDIATE RELEASE:
Metro Vancouver home sales return to more traditional levels in
April
VANCOUVER, BC – May 3, 2022 – Home buyer demand in Metro Vancouver* returned to
more historically typical levels in April.
The Real Estate Board of Greater Vancouver (REBGV) reports that residential home sales in the
region totalled 3,232 in April 2022, a 34.1 per cent decrease from the 4,908 sales recorded in
April 2021, and a 25.6 per cent decrease from the 4,344 homes sold in March 2022.
Last month’s sales were 1.5 per cent above the 10-year April sales average.
“So far this spring, we’ve seen home sales ease down from the record-breaking pace of the last
year,” Daniel John, REBGV Chair said. “While a small sample size, the return to a more
traditional pace of home sales that we’ve experienced over the last two months provides hopeful
home buyers more time to make decisions, secure financing and perform other due diligence
such as home inspections.”
There were 6,107 detached, attached and apartment properties newly listed for sale on the
Multiple Listing Service® (MLS®) in Metro Vancouver in April 2022. This represents a 23.1
per cent decrease compared to the 7,938 homes listed in April 2021 and an 8.5 per cent decrease
compared to March 2022 when 6,673 homes were listed.
The total number of homes currently listed for sale on the MLS® system in Metro Vancouver is
8,796, a 14.1 per cent decrease compared to April 2021 (10,245) and a 15.3 per cent increase
compared to March 2022 (7,628).
“With interest rates climbing and the total inventory of homes for sale inching higher, it’s
important to work with your local Realtor to understand how these factors could affect your
home buying or selling situation,” John said.
For all property types, the sales-to-active listings ratio for April 2022 is 36.7 per cent. By
property type, the ratio is 25.3 per cent for detached homes, 47.1 per cent for townhomes, and 45
per cent for apartments.
Generally, analysts say downward pressure on home prices occurs when the ratio dips below 12
per cent for a sustained period, while home prices often experience upward pressure when it
surpasses 20 per cent over several months.
The MLS® Home Price Index composite benchmark price for all residential properties in Metro
Vancouver is currently $1,374,500. This represents an 18.9 per cent increase over April 2021 and
a one per cent increase compared to March 2022.
Sales of detached homes in April 2022 reached 962, a 41.9 per cent decrease from the 1,655
detached sales recorded in April 2021. The benchmark price for a detached home is $2,139,200.
This represents a 20.8 per cent increase from April 2021 and a one per cent increase compared to
March 2022.
Sales of apartment homes reached 1,692 in April 2022, a 26.1 per cent decrease compared to the
2,289 sales in April 2021. The benchmark price of an apartment home is $844,700. This
represents a 16 per cent increase from April 2021 and a 1.1 per cent increase compared to March
2022.
Attached home sales in April 2022 totalled 578, a 40 per cent decrease compared to the 964 sales
in April 2021. The benchmark price of an attached home is $1,150,500. This represents a 25 per
cent increase from April 2021 and a 1.1 per cent increase compared to March 2022.
-30-
*Editor’s Note: Areas covered by the Real Estate Board of Greater Vancouver include: Burnaby, Coquitlam, Maple
Ridge, New Westminster, North Vancouver, Pitt Meadows, Port Coquitlam, Port Moody, Richmond, South Delta,
Squamish, Sunshine Coast, Vancouver, West Vancouver, and Whistler.
The real estate industry is a key economic driver in British Columbia. In 2021, 43,999 homes changed ownership in
the Board’s area, generating $2.98 billion in economic spin-off activity and an estimated 20,942 jobs. The total
dollar value of residential sales transacted through the MLS® system in Greater Vancouver totalled $53.4 billion in
2021.
The Real Estate Board of Greater Vancouver is an association representing more than 14,000 REALTORS® and
their companies. The Board provides a variety of member services, including the Multiple Listing Service®. For
more information on real estate, statistics, and buying or selling a home, contact a local REALTOR® or visit
www.rebgv.org.
For more information please contact:
Craig Munn
Director, Communication
Real Estate Board of Greater Vancouver
604.730.3146
cmunn@rebgv.org
Property Type Area
Benchmark
Price
Price
Index
1 Month
Change %
3 Month
Change %
6 Month
Change %
1 Year
Change %
3 Year
Change %
5 Year
Change %
10 Year
Change %
Residential / Composite Lower Mainland $1,403,700 391.0 0.9% 10.4% 18.6% 25.3% 47.4% 60.4% 146.2%
Greater Vancouver $1,374,500 361.8 1.0% 9.5% 14.6% 18.9% 36.8% 43.4% 119.1%
Bowen Island $1,675,200 363.2 2.4% 12.7% 15.6% 23.2% 69.0% 90.8% 170.2%
Burnaby East $1,276,000 363.8 -0.5% 10.3% 16.0% 20.9% 34.4% 39.7% 118.1%
Burnaby North $1,285,500 346.3 1.9% 9.3% 14.5% 18.8% 30.8% 38.2% 116.4%
Burnaby South $1,207,900 342.9 1.3% 9.6% 14.3% 17.2% 25.0% 31.7% 105.1%
Coquitlam $1,339,700 398.2 1.0% 11.4% 19.3% 25.1% 48.4% 62.7% 164.4%
Ladner $1,260,500 357.2 1.0% 9.3% 17.3% 24.5% 50.8% 51.0% 121.9%
Maple Ridge $1,280,300 407.7 0.4% 12.8% 23.1% 32.2% 68.6% 97.1% 201.8%
New Westminster $850,500 377.3 0.5% 9.9% 15.8% 21.2% 31.5% 54.9% 130.9%
North Vancouver $1,438,000 330.4 1.3% 9.6% 15.4% 19.2% 38.7% 41.0% 116.2%
Pitt Meadows $1,140,400 416.7 -0.2% 10.1% 20.9% 28.5% 54.3% 88.0% 195.1%
Port Coquitlam $1,162,100 397.8 1.4% 13.7% 22.4% 27.2% 56.7% 75.5% 171.2%
Port Moody $1,287,300 362.0 2.5% 14.1% 20.3% 23.9% 42.9% 61.2% 159.9%
Richmond $1,256,500 375.2 0.6% 8.8% 13.7% 18.2% 34.5% 39.5% 111.7%
Squamish $1,215,100 376.7 1.6% 11.4% 12.3% 22.9% 52.3% 75.9% 194.3%
Sunshine Coast $975,200 359.6 2.0% 12.7% 14.4% 23.7% 61.2% 86.3% 173.0%
Tsawwassen $1,378,600 349.2 1.7% 9.3% 15.2% 23.7% 43.1% 41.5% 121.2%
Vancouver East $1,359,900 404.1 0.8% 8.3% 11.8% 13.8% 28.4% 30.6% 115.5%
Vancouver West $1,483,100 309.7 0.9% 6.0% 8.6% 9.1% 19.9% 16.8% 76.3%
West Vancouver $2,748,300 302.6 2.6% 5.5% 6.7% 10.8% 28.8% 12.1% 69.5%
Whistler $1,565,300 350.0 2.0% 12.6% 13.6% 25.1% 60.3% 98.3% 197.6%
Single Family Detached Lower Mainland $1,995,600 425.2 0.6% 9.8% 19.5% 27.0% 63.0% 61.7% 157.4%
Greater Vancouver $2,139,200 394.2 1.0% 9.5% 15.6% 20.8% 49.4% 39.8% 120.3%
Bowen Island $1,675,700 363.3 2.4% 12.7% 15.6% 23.2% 69.1% 90.8% 170.3%
Burnaby East $1,750,800 391.5 -1.4% 9.7% 16.6% 22.0% 49.2% 45.9% 127.9%
Burnaby North $2,048,300 396.1 1.3% 9.8% 17.5% 19.8% 47.1% 34.1% 120.1%
Burnaby South $2,127,700 407.3 2.9% 11.4% 17.1% 23.1% 39.0% 30.4% 114.4%
Coquitlam $1,847,800 410.1 0.8% 10.3% 20.1% 25.0% 59.8% 55.2% 160.9%
Ladner $1,571,800 376.2 -0.6% 7.7% 17.2% 23.7% 63.1% 56.9% 132.9%
Maple Ridge $1,447,600 412.4 1.2% 12.7% 23.0% 31.8% 77.5% 97.5% 213.1%
New Westminster $1,580,200 394.2 -0.8% 11.4% 15.8% 22.8% 49.9% 46.4% 127.5%
North Vancouver $2,231,000 351.3 0.2% 10.1% 15.0% 18.6% 47.6% 36.5% 125.2%
Pitt Meadows $1,540,100 434.0 -1.5% 7.5% 21.5% 32.1% 71.7% 93.5% 209.6%
Port Coquitlam $1,614,600 430.5 0.0% 11.5% 25.3% 29.3% 76.1% 74.1% 189.5%
Port Moody $2,314,900 427.5 1.8% 14.5% 23.2% 27.6% 69.4% 68.5% 178.7%
Richmond $2,188,500 419.6 0.3% 7.6% 12.2% 15.9% 36.5% 26.0% 98.5%
Squamish $1,626,600 398.7 1.1% 10.0% 13.3% 20.5% 58.0% 68.7% 207.2%
Sunshine Coast $1,016,500 356.1 2.1% 12.9% 15.1% 23.7% 66.3% 90.9% 169.6%
Tsawwassen $1,688,800 368.7 0.9% 8.2% 15.6% 25.6% 53.4% 46.5% 131.6%
Vancouver East $1,956,200 430.9 1.2% 8.4% 13.9% 16.3% 42.8% 30.4% 126.9%
Vancouver West $3,643,100 368.5 2.0% 5.7% 5.6% 8.3% 22.0% 3.0% 58.7%
West Vancouver $3,380,200 319.1 2.0% 4.5% 5.6% 11.8% 31.0% 11.8% 72.2%
Whistler $2,963,700 374.1 -0.7% 8.5% 12.9% 22.7% 68.1% 80.6% 197.4%
HOW TO READ THE TABLE:
• Benchmark Price: Estimated sale price of a benchmark property. Benchmarks represent a typical property within each market.
• Price Index: Index numbers estimate the percentage change in price on typical and constant quality properties over time. All figures are based on past sales.
• x Month/Year Change %: Percentage change of index over a period of x month(s)/year(s) *
In January 2005, the indexes are set to 100.
Townhome properties are similar to Attached properties, a category that was used in the previous MLSLink HPI, but do not included duplexes.
The above info is deemed reliable, but is not guaranteed. All dollar amounts in CDN.
April 2022
*
* MLS®, Multiple Listing Service®, and all related graphics are trademarks of The Canadian Real Estate Association 1 of 19
Property Type Area
Benchmark
Price
Price
Index
1 Month
Change %
3 Month
Change %
6 Month
Change %
1 Year
Change %
3 Year
Change %
5 Year
Change %
10 Year
Change %
April 2022
*
Townhouse Lower Mainland $1,061,800 382.7 1.4% 12.5% 21.6% 31.6% 54.9% 73.3% 156.0%
Greater Vancouver $1,150,500 369.1 1.1% 11.7% 18.0% 25.0% 45.9% 58.5% 134.5%
Burnaby East $816,500 366.3 -1.5% 8.0% 17.8% 19.8% 28.9% 38.9% 124.6%
Burnaby North $983,000 366.9 4.9% 13.4% 16.8% 23.3% 38.6% 51.4% 124.4%
Burnaby South $878,500 367.4 -1.4% 9.8% 15.0% 19.0% 31.2% 39.0% 120.1%
Coquitlam $1,064,000 390.3 0.9% 13.4% 21.2% 29.4% 52.7% 67.5% 169.9%
Ladner $936,300 346.5 0.5% 8.5% 17.2% 24.6% 41.9% 45.0% 111.8%
Maple Ridge $889,200 412.8 -1.5% 13.8% 24.8% 33.9% 63.9% 97.7% 195.9%
New Westminster $993,900 379.6 0.0% 7.4% 15.0% 23.4% 39.6% 54.9% 128.3%
North Vancouver $1,384,400 342.3 0.8% 11.9% 17.8% 27.2% 48.1% 55.4% 126.4%
Pitt Meadows $902,300 390.4 1.0% 12.5% 20.1% 25.7% 49.5% 81.2% 183.3%
Port Coquitlam $1,010,600 382.6 3.2% 16.2% 24.3% 30.4% 64.2% 78.0% 162.1%
Port Moody $970,100 329.9 4.9% 18.5% 27.3% 31.1% 43.1% 70.8% 135.6%
Richmond $1,120,100 368.1 1.8% 9.0% 16.5% 24.7% 43.5% 50.5% 122.3%
Squamish $1,067,300 360.3 0.0% 13.9% 18.1% 25.2% 54.3% 86.4% 177.4%
Sunshine Coast $739,800 354.4 -0.3% 15.3% 19.8% 26.8% 62.0% 81.8% 171.2%
Tsawwassen $1,019,200 335.5 0.5% 8.8% 15.9% 21.3% 23.3% 29.3% 99.1%
Vancouver East $1,182,600 376.1 0.5% 12.3% 12.2% 18.0% 35.0% 37.8% 114.9%
Vancouver West $1,417,500 331.4 2.4% 8.1% 9.0% 14.1% 28.0% 27.0% 92.9%
Whistler $1,586,700 388.5 1.0% 15.7% 21.3% 28.7% 64.1% 111.0% 215.9%
Apartment Lower Mainland $868,500 366.8 1.0% 10.0% 16.7% 21.3% 32.4% 58.4% 136.6%
Greater Vancouver $844,700 339.2 1.1% 8.9% 13.2% 16.0% 26.4% 45.1% 118.4%
Burnaby East $846,700 337.0 0.9% 11.0% 14.4% 20.1% 24.8% 39.6% 95.9%
Burnaby North $830,400 325.3 1.5% 8.6% 13.3% 18.2% 23.4% 42.7% 122.4%
Burnaby South $773,900 317.1 1.4% 8.9% 13.2% 14.8% 18.4% 33.5% 102.5%
Coquitlam $712,500 391.0 1.2% 11.4% 18.1% 23.6% 39.3% 71.2% 172.3%
Ladner $692,600 324.4 6.1% 14.7% 17.1% 25.6% 34.2% 45.5% 107.2%
Maple Ridge $546,600 390.9 0.9% 11.9% 21.2% 31.0% 53.5% 98.1% 172.6%
New Westminster $658,900 373.3 0.9% 10.0% 16.0% 20.6% 27.1% 58.5% 133.9%
North Vancouver $754,300 306.9 2.4% 8.4% 15.3% 17.2% 29.2% 43.7% 105.7%
Pitt Meadows $682,700 419.2 0.5% 11.0% 20.7% 27.0% 45.6% 87.6% 186.7%
Port Coquitlam $641,500 383.6 1.6% 14.2% 19.3% 23.9% 40.7% 79.2% 165.5%
Port Moody $840,600 350.3 1.4% 11.2% 14.7% 18.7% 32.2% 57.7% 170.3%
Richmond $829,700 355.2 0.2% 9.7% 13.5% 17.0% 29.4% 54.3% 129.9%
Squamish $677,800 367.6 3.7% 11.4% 7.0% 24.7% 43.1% 82.7% 200.6%
Sunshine Coast $608,500 368.3 4.0% 8.7% 6.0% 20.8% 36.6% 64.3% 195.8%
Tsawwassen $738,300 318.4 4.2% 12.0% 13.8% 20.5% 27.4% 36.2% 107.3%
Vancouver East $699,600 393.2 0.5% 7.6% 10.4% 11.1% 18.0% 33.0% 108.2%
Vancouver West $904,200 293.4 0.6% 6.0% 9.8% 9.0% 18.3% 24.6% 89.7%
West Vancouver $1,252,600 254.5 5.3% 8.8% 11.4% 8.0% 17.1% 19.7% 68.3%
Whistler $719,200 309.1 4.5% 12.6% 8.6% 25.8% 54.3% 100.2% 195.8%
HOW TO READ THE TABLE:
• Benchmark Price: Estimated sale price of a benchmark property. Benchmarks represent a typical property within each market.
• Price Index: Index numbers estimate the percentage change in price on typical and constant quality properties over time. All figures are based on past sales.
• x Month/Year Change %: Percentage change of index over a period of x month(s)/year(s)
In January 2005, the indexes are set to 100. *
Townhome properties are similar to attached properties, a category that was used in the previous MLSLink HPI, but do not included duplexes.
Lower Mainland includes areas serviced by both Real Estate Board of Greater Vancouver & Fraser Valley Real Estate Board.
The above info is deemed reliable, but is not guaranteed. All dollar amounts in CDN.
* MLS®, Multiple Listing Service®, and all related graphics are trademarks of The Canadian Real Estate Association 2 of 19
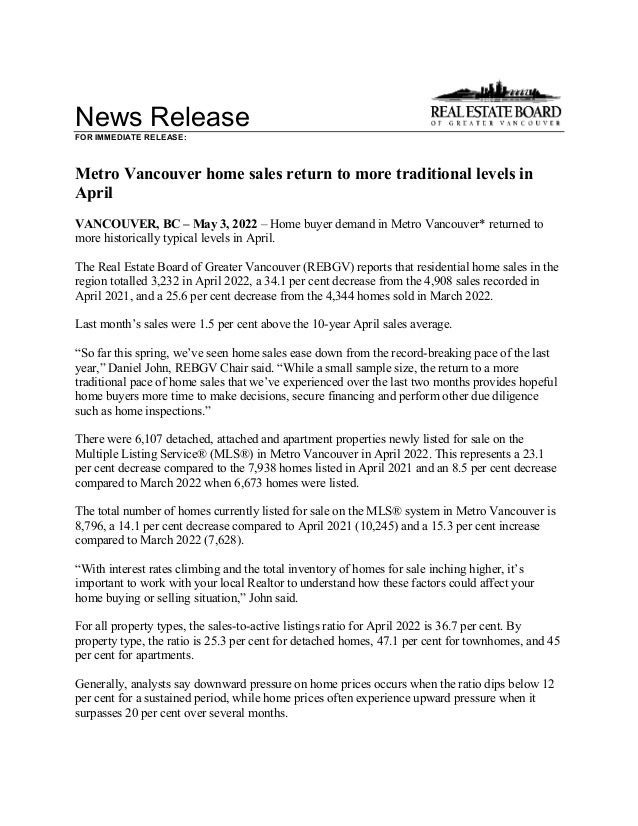
C:DATAMonthEndHpiexporthi_resgv-hpi2.tif
Greater
Vancouver
5
Year
Trend
60
110
160
210
260
310
360
410
460
Apr 2017
Jun 2017
Aug 2017
Oct 2017
Dec 2017
Feb 2018
Apr 2018
Jun 2018
Aug 2018
Oct 2018
Dec 2018
Feb 2019
Apr 2019
Jun 2019
Aug 2019
Oct 2019
Dec 2019
Feb 2020
Apr 2020
Jun 2020
Aug 2020
Oct 2020
Dec 2020
Feb 2021
Apr 2021
Jun 2021
Aug 2021
Oct 2021
Dec 2021
Feb 2022
Apr 2022
Price
Index
Residential
Detached
Townhouse
Apartment
Jan
2005
HPI
=
100
4
29
2022
MLS
®
SALES
Facts
B
u
r
n
a
b
y
C
o
q
u
it
la
m
D
e
lt
a
-
S
o
u
th
Is
la
n
d
s
-
G
u
lf
M
a
p
le
R
id
g
e
/P
it
t
M
e
a
d
o
w
s
N
e
w
W
e
s
tm
in
s
t
e
r
N
o
r
th
V
a
n
c
o
u
v
e
r
P
o
r
t
C
o
q
u
it
la
m
P
o
r
t
M
o
o
d
y
/B
e
lc
a
r
r
a
R
ic
h
m
o
n
d
S
q
u
a
m
is
h
S
u
n
s
h
in
e
C
o
a
s
t
V
a
n
c
o
u
v
e
r
E
a
s
t
V
a
n
c
o
u
v
e
r
W
e
s
t
W
e
s
t
V
a
n
c
o
u
v
e
r
/H
o
w
e
S
o
u
n
d
W
h
is
tl
e
r
/P
e
m
b
e
r
to
n
Detached
85
88
36
10
103
24
96
36
16
96
24
72
110
93
54
19
962
Attached
61
42
13
0
63
7
54
33
23
96
19
10
65
60
4
28
578
Apartment
242
149
31
0
44
102
125
48
26
233
9
3
178
465
13
24
1,692
Detached
$2,207,000
$1,840,000
$1,692,500
n/a
$1,404,500
$1,701,500
$2,260,500
$1,500,000
n/a
$1,960,000
$1,770,000
$1,125,000
$2,065,000
$3,768,000
$3,205,000
n/a
Attached
$1,103,000
$1,250,000
n/a
n/a
$846,000
n/a
$1,362,500
$1,050,000
$1,126,500
$1,165,000
n/a
n/a
$1,350,000
$1,614,950
n/a
$1,244,000
n/a
Apartment
$740,000
$707,900
$675,000
n/a
$553,000
$630,000
$781,028
$582,500
$779,000
$675,000
n/a
n/a
$680,000
$887,500
n/a
$799,500
Detached
91
119
72
7
153
29
117
51
33
148
27
71
174
124
62
13
1,291
Attached
93
66
18
2
75
25
64
31
24
116
21
14
84
75
15
20
743
Apartment
341
211
32
1
87
149
162
59
50
291
23
13
239
600
9
43
2,310
Detached
$2,190,000
$1,900,000
$1,651,000
n/a
$1,488,000
$1,640,000
$2,320,000
$1,555,500
$2,100,000
$2,110,000
$1,679,000
$1,082,500
$2,095,000
$3,500,000
$3,000,000
n/a
Attached
$1,020,000
$1,181,900
n/a
n/a
$930,000
$1,030,000
$1,480,000
$1,025,000
$1,150,000
$1,227,000
$1,159,873
n/a
$1,404,000
$1,629,000
n/a
$1,810,000
n/a
Apartment
$755,000
$755,000
$646,500
n/a
$598,000
$679,900
$850,000
$620,000
$794,500
$690,000
$760,000
n/a
$680,000
$863,000
n/a
$725,000
Detached
160
126
73
10
204
38
183
74
30
178
32
80
221
139
80
27
1,655
Attached
124
74
33
1
104
24
86
22
38
178
29
10
92
111
5
33
964
Apartment
371
155
46
0
70
135
207
69
57
305
35
20
241
512
28
38
2,289
Detached
$1,776,500
$1,654,000
$1,338,000
n/a
$1,181,000
$1,344,000
$1,935,000
$1,250,000
$1,837,750
$1,744,000
$1,512,600
$914,987
$1,850,000
$3,300,000
$3,300,000
$2,075,000
Attached
$907,500
$984,000
$880,000
n/a
$690,000
$838,000
$1,219,450
$820,500
$835,000
$968,000
$925,000
n/a
$1,255,000
$1,408,000
n/a
$1,159,000
n/a
Apartment
$636,000
$600,000
$565,000
n/a
$458,000
$535,500
$699,000
$501,900
$650,000
$603,000
$565,000
$489,500
$630,000
$815,000
$880,000
$777,500
Detached
323
336
206
24
443
103
330
158
90
453
84
228
466
384
206
51
3,885
Attached
252
166
52
2
244
57
185
96
87
340
84
41
252
257
24
90
2,229
Apartment
1,112
609
108
2
244
427
506
189
134
924
69
26
750
1,883
52
136
7,171
Detached
$2,180,000
$1,880,000
$1,674,000
$834,500
$1,500,000
$1,690,000
$2,299,500
$1,560,000
$2,100,000
$2,100,000
$1,645,000
$1,063,000
$2,100,000
$3,600,000
$3,047,500
$3,100,000
Attached
$1,050,000
$1,209,500
$999,500
n/a
$907,750
$1,028,000
$1,407,000
$1,025,000
$1,084,000
$1,185,000
$1,095,450
$655,000
$1,404,000
$1,658,000
$2,163,000
$1,585,125
n/a
Apartment
$741,800
$730,000
$634,750
n/a
$580,003
$633,000
$810,000
$599,000
$759,950
$680,000
$738,000
$579,000
$690,000
$875,000
$1,120,000
$612,000
Detached
468
487
311
37
739
135
491
239
107
622
129
299
711
441
285
90
5,591
Attached
402
272
99
3
358
84
300
110
104
541
90
51
325
318
36
108
3,201
Apartment
1,254
586
160
0
293
485
643
227
182
987
103
54
839
1,865
84
178
7,940
Detached
$1,752,000
$1,566,500
$1,315,000
$805,000
$1,149,500
$1,325,000
$1,920,000
$1,253,500
$1,700,000
$1,750,000
$1,412,000
$850,000
$1,766,500
$3,359,000
$3,100,000
$2,120,000
Attached
$899,900
$964,950
$855,000
n/a
$653,250
$768,950
$1,201,000
$777,500
$887,950
$928,000
$869,500
$549,000
$1,218,000
$1,448,950
$1,800,500
$1,049,000
n/a
Apartment
$625,000
$570,000
$587,500
n/a
$437,900
$549,300
$700,000
$492,000
$640,000
$585,000
$560,555
$470,000
$625,000
$768,000
$1,030,000
$589,250
Note:
Median
Selling
Prices
are
not
reported
for
areas
with
less
than
20
sales
or
for
the
Gulf
Islands
Number
of
Sales
April
2022
Number
of
Sales
Median
Selling
Price
Number
of
Sales
Median
Selling
Price
Number
of
Sales
Median
Selling
Price
March
2022
April
2021
Jan.
-
Apr.
2022
Jan.
-
Apr.
2021
Median
Selling
Price
Number
of
Sales
Median
Selling
Price
April
2022
Year-to-date
Year-to-date
4
29
2022
MLS
®
LISTINGS
Facts
B
u
r
n
a
b
y
C
o
q
u
it
la
m
D
e
lt
a
-
S
o
u
th
Is
la
n
d
s
-
G
u
lf
M
a
p
le
R
id
g
e
/P
it
t
M
e
a
d
o
w
s
N
e
w
W
e
s
tm
in
s
t
e
r
N
o
r
th
V
a
n
c
o
u
v
e
r
P
o
r
t
C
o
q
u
it
la
m
P
o
r
t
M
o
o
d
y
/B
e
lc
a
r
r
a
R
ic
h
m
o
n
d
S
q
u
a
m
is
h
S
u
n
s
h
in
e
C
o
a
s
t
V
a
n
c
o
u
v
e
r
E
a
s
t
V
a
n
c
o
u
v
e
r
W
e
s
t
W
e
s
t
V
a
n
c
o
u
v
e
r
/H
o
w
e
S
o
u
n
d
W
h
is
tl
e
r
/P
e
m
b
e
r
to
n
Detached
147
176
82
11
274
56
193
85
29
245
40
107
249
284
184
23
2,185
Attached
116
85
30
0
146
14
61
41
33
173
35
12
140
148
9
30
1,073
Apartment
491
222
23
1
81
132
214
62
48
332
22
10
280
839
40
52
2,849
Detached
58%
50%
44%
91%
38%
43%
50%
42%
55%
39%
60%
67%
44%
33%
29%
83%
Attached
53%
49%
43%
n/a
43%
50%
89%
80%
70%
55%
54%
83%
46%
41%
44%
93%
n/a
Apartment
49%
67%
135%
0%
54%
77%
58%
77%
54%
70%
41%
30%
64%
55%
33%
46%
Detached
196
188
106
12
286
55
183
91
47
298
45
132
277
274
144
26
2,360
Attached
110
98
22
2
129
18
82
38
42
189
33
16
133
123
12
32
1,079
Apartment
471
318
39
0
96
183
220
80
50
391
22
9
321
958
24
52
3,234
Detached
46%
63%
68%
58%
53%
53%
64%
56%
70%
50%
60%
54%
63%
45%
43%
50%
Attached
85%
67%
82%
100%
58%
139%
78%
82%
57%
61%
64%
88%
63%
61%
125%
63%
n/a
Apartment
72%
66%
82%
n/a
91%
81%
74%
74%
100%
74%
105%
144%
74%
63%
38%
83%
Detached
337
278
130
12
284
72
263
117
52
361
50
121
481
350
223
34
3,165
Attached
183
116
36
0
120
31
112
44
50
208
41
9
136
189
21
28
1,324
Apartment
491
208
48
0
91
193
295
94
72
415
30
25
402
999
39
47
3,449
Detached
47%
45%
56%
83%
72%
53%
70%
63%
58%
49%
64%
66%
46%
40%
36%
79%
Attached
68%
64%
92%
n/a
87%
77%
77%
50%
76%
86%
71%
111%
68%
59%
24%
118%
n/a
Apartment
76%
75%
96%
n/a
77%
70%
70%
73%
79%
73%
117%
80%
60%
51%
72%
81%
Detached
582
620
361
36
921
194
601
280
131
947
146
351
913
947
607
85
7,722
Attached
392
276
86
3
442
81
246
121
125
589
123
57
456
525
39
129
3,690
Apartment
1,714
896
117
1
323
568
769
250
193
1,340
95
35
1,147
3,256
119
186
11,009
Detached
55%
54%
57%
67%
48%
53%
55%
56%
69%
48%
58%
65%
51%
41%
34%
60%
Attached
64%
60%
60%
67%
55%
70%
75%
79%
70%
58%
68%
72%
55%
49%
62%
70%
n/a
Apartment
65%
68%
92%
200%
76%
75%
66%
76%
69%
69%
73%
74%
65%
58%
44%
73%
Detached
909
847
466
35
995
236
754
379
173
1,087
194
419
1,333
1,007
697
99
9,630
Attached
563
354
141
4
407
103
415
150
138
703
124
44
480
594
70
127
4,417
Apartment
1,677
732
200
0
340
714
952
360
222
1,449
123
69
1,261
3,256
154
197
11,706
Detached
51%
57%
67%
106%
74%
57%
65%
63%
62%
57%
66%
71%
53%
44%
41%
91%
Attached
71%
77%
70%
75%
88%
82%
72%
73%
75%
77%
73%
116%
68%
54%
51%
85%
n/a
Apartment
75%
80%
80%
n/a
86%
68%
68%
63%
82%
68%
84%
78%
67%
57%
55%
90%
*
Year-to-date
listings
represent
a
cumulative
total
of
listings
rather
than
total
active
listings.
%
Sales
to
Listings
Number
of
Listings
%
Sales
to
Listings
March
2022
April
2021
Jan.
-
Apr.
2022
Jan.
-
Apr.
2021
%
Sales
to
Listings
Number
of
Listings
%
Sales
to
Listings
Number
of
Listings
April
2022
Number
of
Listings
%
Sales
to
Listings
Number
of
Listings
April
2022
Year-to-date*
Year-to-date*
Listing & Sales Activity Summary
Listings Sales
1 2 3 Col. 2 & 3 5 6 7 Col. 6 & 7 9 10 Col. 9 & 10
Apr Mar Apr Percentage Apr Mar Apr Percentage Feb 2021 - Feb 2022 - Percentage
2021 2022 2022 Variance 2021 2022 2022 Variance Apr 2021 Apr 2022 Variance
BURNABY % % %
DETACHED 337 196 147 -25.0 160 91 85 -6.6 412 278 -32.5
ATTACHED 183 110 116 5.5 124 93 61 -34.4 344 208 -39.5
APARTMENTS 491 471 491 4.2 371 341 242 -29.0 1058 886 -16.3
COQUITLAM
DETACHED 278 188 176 -6.4 126 119 88 -26.1 411 287 -30.2
ATTACHED 116 98 85 -13.3 74 66 42 -36.4 234 149 -36.3
APARTMENTS 208 318 222 -30.2 155 211 149 -29.4 480 503 4.8
DELTA
DETACHED 130 106 82 -22.6 73 72 36 -50.0 266 170 -36.1
ATTACHED 36 22 30 36.4 33 18 13 -27.8 89 44 -50.6
APARTMENTS 48 39 23 -41.0 46 32 31 -3.1 142 90 -36.6
MAPLE RIDGE/PITT MEADOWS
DETACHED 284 286 274 -4.2 204 153 103 -32.7 644 382 -40.7
ATTACHED 120 129 146 13.2 104 75 63 -16.0 290 208 -28.3
APARTMENTS 91 96 81 -15.6 70 87 44 -49.4 244 191 -21.7
NORTH VANCOUVER
DETACHED 263 183 193 5.5 183 117 96 -17.9 446 293 -34.3
ATTACHED 112 82 61 -25.6 86 64 54 -15.6 259 164 -36.7
APARTMENTS 295 220 214 -2.7 207 162 125 -22.8 551 421 -23.6
NEW WESTMINSTER
DETACHED 72 55 56 1.8 38 29 24 -17.2 114 85 -25.4
ATTACHED 31 18 14 -22.2 24 25 7 -72.0 70 50 -28.6
APARTMENTS 193 183 132 -27.9 135 149 102 -31.5 419 354 -15.5
PORT MOODY/BELCARRA
DETACHED 52 47 29 -38.3 30 33 16 -51.5 98 75 -23.5
ATTACHED 50 42 33 -21.4 38 24 23 -4.2 95 70 -26.3
APARTMENTS 72 50 48 -4.0 57 50 26 -48.0 154 110 -28.6
PORT COQUITLAM
DETACHED 117 91 85 -6.6 74 51 36 -29.4 206 129 -37.4
ATTACHED 44 38 41 7.9 22 31 33 6.5 92 83 -9.8
APARTMENTS 94 80 62 -22.5 69 59 48 -18.6 190 154 -18.9
RICHMOND
DETACHED 361 298 245 -17.8 178 148 96 -35.1 551 345 -37.4
ATTACHED 208 189 173 -8.5 178 116 96 -17.2 477 284 -40.5
APARTMENTS 415 391 332 -15.1 305 291 233 -19.9 845 749 -11.4
SUNSHINE COAST
DETACHED 121 132 107 -18.9 80 71 72 1.4 257 192 -25.3
ATTACHED 9 16 12 -25.0 10 14 10 -28.6 43 34 -20.9
APARTMENTS 25 9 10 11.1 20 13 3 -76.9 44 24 -45.5
SQUAMISH
DETACHED 50 45 40 -11.1 32 27 24 -11.1 110 71 -35.5
ATTACHED 41 33 35 6.1 29 21 19 -9.5 78 70 -10.3
APARTMENTS 30 22 22 0.0 35 23 9 -60.9 87 62 -28.7
VANCOUVER EAST
DETACHED 481 277 249 -10.1 221 174 110 -36.8 602 401 -33.4
ATTACHED 136 133 140 5.3 92 84 65 -22.6 277 205 -26.0
APARTMENTS 402 321 280 -12.8 241 239 178 -25.5 740 607 -18.0
VANCOUVER WEST
DETACHED 350 274 284 3.6 139 124 93 -25.0 372 319 -14.2
ATTACHED 189 123 148 20.3 111 75 60 -20.0 280 208 -25.7
APARTMENTS 999 958 839 -12.4 512 600 465 -22.5 1580 1553 -1.7
WHISTLER/PEMBERTON
DETACHED 34 26 23 -11.5 27 13 19 46.2 75 41 -45.3
ATTACHED 28 32 30 -6.3 33 20 28 40.0 85 79 -7.1
APARTMENTS 47 52 52 0.0 38 43 24 -44.2 138 110 -20.3
WEST VANCOUVER/HOWE SOUND
DETACHED 223 144 184 27.8 80 62 54 -12.9 256 174 -32.0
ATTACHED 21 12 9 -25.0 5 15 4 -73.3 31 23 -25.8
APARTMENTS 39 24 40 66.7 28 9 13 44.4 73 40 -45.2
GRAND TOTALS
DETACHED 3153 2348 2174 -7.4 1645 1284 952 -25.9 4820 3242 -32.7
ATTACHED 1324 1077 1073 -0.4 963 741 578 -22.0 2744 1879 -31.5
APARTMENTS 3449 3234 2848 -11.9 2289 2309 1692 -26.7 6745 5854 -13.2
Residential
Average
Sale
Prices
-
January
1977
to
April
2022
0
500
1000
1500
2000
2500
1
9
7
7
1
9
7
8
1
9
7
9
1
9
8
0
1
9
8
1
1
9
8
2
1
9
8
3
1
9
8
4
1
9
8
5
1
9
8
6
1
9
8
7
1
9
8
8
1
9
8
9
1
9
9
0
1
9
9
1
1
9
9
2
1
9
9
3
1
9
9
4
1
9
9
5
1
9
9
6
1
9
9
7
1
9
9
8
1
9
9
9
2
0
0
0
2
0
0
1
2
0
0
2
2
0
0
3
2
0
0
4
2
0
0
5
2
0
0
6
2
0
0
7
2
0
0
8
2
0
0
9
2
0
1
0
2
0
1
1
2
0
1
2
2
0
1
3
2
0
1
4
2
0
1
5
2
0
1
6
2
0
1
7
2
0
1
8
2
0
1
9
2
0
2
0
2
0
2
1
2
0
2
2
DETACHED
CONDOMINIUM
ATTACHED
APARTMENTS
IN
THOUSANDS
($)
NOTE:
From
1977
-
1984
condominium
averages
were
not
separated
into
attached
&
apartment.
$1,195,021
$841,602
$2,311,837

More Related Content

Similar to REBGV-Stats-Pkg-April-2022.pdf

Real Estate Board of Greater Vancouver Statistics Package February 2022
Real Estate Board of Greater Vancouver Statistics Package February 2022Real Estate Board of Greater Vancouver Statistics Package February 2022
Real Estate Board of Greater Vancouver Statistics Package February 2022Vicky Aulakh
 
REBGV Statistics Package May 2022
REBGV Statistics Package May 2022REBGV Statistics Package May 2022
REBGV Statistics Package May 2022Vicky Aulakh
 
Rebgv stats-pkg-february-2020
Rebgv stats-pkg-february-2020Rebgv stats-pkg-february-2020
Rebgv stats-pkg-february-2020Vicky Aulakh
 
January 2016 rebgv stats mike stewart realtor Corrected Feb 5 2016
January 2016 rebgv stats mike stewart realtor Corrected Feb 5 2016January 2016 rebgv stats mike stewart realtor Corrected Feb 5 2016
January 2016 rebgv stats mike stewart realtor Corrected Feb 5 2016Mike Stewart
 
REBGV Statistics package July 2020
REBGV Statistics package July 2020REBGV Statistics package July 2020
REBGV Statistics package July 2020Vicky Aulakh
 
REBGV Statistics Package May 2020
REBGV Statistics Package May 2020REBGV Statistics Package May 2020
REBGV Statistics Package May 2020Vicky Aulakh
 
Rebgv stats-pkg-april-2018
Rebgv stats-pkg-april-2018Rebgv stats-pkg-april-2018
Rebgv stats-pkg-april-2018Kathryn Huang
 
Rebgv stats-pkg-april-2020
Rebgv stats-pkg-april-2020Rebgv stats-pkg-april-2020
Rebgv stats-pkg-april-2020Vicky Aulakh
 
REBGV Statistics Package June 2020
REBGV Statistics Package June 2020REBGV Statistics Package June 2020
REBGV Statistics Package June 2020Vicky Aulakh
 
Rebgv stats-pkg-may-2018
Rebgv stats-pkg-may-2018Rebgv stats-pkg-may-2018
Rebgv stats-pkg-may-2018Kathryn Huang
 
March 2017 Rebgv Stats Package Mike Stewart
March 2017 Rebgv Stats Package Mike StewartMarch 2017 Rebgv Stats Package Mike Stewart
March 2017 Rebgv Stats Package Mike StewartMike Stewart
 
Real Estate Board of Greater Vancouver Statistics Package March 2021
Real Estate Board of Greater Vancouver Statistics Package March 2021Real Estate Board of Greater Vancouver Statistics Package March 2021
Real Estate Board of Greater Vancouver Statistics Package March 2021Vicky Aulakh
 
REBGV Stats Package June 2016 Mike Stewart Vancouver Realtor
REBGV Stats Package June 2016 Mike Stewart Vancouver RealtorREBGV Stats Package June 2016 Mike Stewart Vancouver Realtor
REBGV Stats Package June 2016 Mike Stewart Vancouver RealtorMike Stewart
 
May 2021 Real Estate Board of Greater Vancouver Statistics Package
May 2021 Real Estate Board of Greater Vancouver Statistics PackageMay 2021 Real Estate Board of Greater Vancouver Statistics Package
May 2021 Real Estate Board of Greater Vancouver Statistics PackageVicky Aulakh
 
Real Estate Board of Greater Vancouver - Stats Package May 2021
Real Estate Board of Greater Vancouver - Stats Package May 2021Real Estate Board of Greater Vancouver - Stats Package May 2021
Real Estate Board of Greater Vancouver - Stats Package May 2021AlexanderMackenzie13
 
Rebgv stats-pkg-may-2021
Rebgv stats-pkg-may-2021Rebgv stats-pkg-may-2021
Rebgv stats-pkg-may-2021BC PRIME Realty
 
REBGV January 2020 Statistics Package
REBGV January 2020 Statistics Package REBGV January 2020 Statistics Package
REBGV January 2020 Statistics Package Vicky Aulakh
 
REBGV November 2015 Statistics Package Mike Stewart Realtor
REBGV November 2015 Statistics Package Mike Stewart RealtorREBGV November 2015 Statistics Package Mike Stewart Realtor
REBGV November 2015 Statistics Package Mike Stewart RealtorMike Stewart
 
REBGV Statistics Package October 2020
REBGV Statistics Package October 2020REBGV Statistics Package October 2020
REBGV Statistics Package October 2020Vicky Aulakh
 

Similar to REBGV-Stats-Pkg-April-2022.pdf (20)

Real Estate Board of Greater Vancouver Statistics Package February 2022
Real Estate Board of Greater Vancouver Statistics Package February 2022Real Estate Board of Greater Vancouver Statistics Package February 2022
Real Estate Board of Greater Vancouver Statistics Package February 2022
 
REBGV Statistics Package May 2022
REBGV Statistics Package May 2022REBGV Statistics Package May 2022
REBGV Statistics Package May 2022
 
Rebgv stats-pkg-february-2020
Rebgv stats-pkg-february-2020Rebgv stats-pkg-february-2020
Rebgv stats-pkg-february-2020
 
January 2016 rebgv stats mike stewart realtor Corrected Feb 5 2016
January 2016 rebgv stats mike stewart realtor Corrected Feb 5 2016January 2016 rebgv stats mike stewart realtor Corrected Feb 5 2016
January 2016 rebgv stats mike stewart realtor Corrected Feb 5 2016
 
REBGV Statistics package July 2020
REBGV Statistics package July 2020REBGV Statistics package July 2020
REBGV Statistics package July 2020
 
REBGV Statistics Package May 2020
REBGV Statistics Package May 2020REBGV Statistics Package May 2020
REBGV Statistics Package May 2020
 
Rebgv stats-pkg-april-2018
Rebgv stats-pkg-april-2018Rebgv stats-pkg-april-2018
Rebgv stats-pkg-april-2018
 
Rebgv stats-pkg-april-2020
Rebgv stats-pkg-april-2020Rebgv stats-pkg-april-2020
Rebgv stats-pkg-april-2020
 
REBGV Statistics Package June 2020
REBGV Statistics Package June 2020REBGV Statistics Package June 2020
REBGV Statistics Package June 2020
 
Rebgv stats-pkg-may-2018
Rebgv stats-pkg-may-2018Rebgv stats-pkg-may-2018
Rebgv stats-pkg-may-2018
 
March 2017 Rebgv Stats Package Mike Stewart
March 2017 Rebgv Stats Package Mike StewartMarch 2017 Rebgv Stats Package Mike Stewart
March 2017 Rebgv Stats Package Mike Stewart
 
Real Estate Board of Greater Vancouver Statistics Package March 2021
Real Estate Board of Greater Vancouver Statistics Package March 2021Real Estate Board of Greater Vancouver Statistics Package March 2021
Real Estate Board of Greater Vancouver Statistics Package March 2021
 
REBGV Stats Package June 2016 Mike Stewart Vancouver Realtor
REBGV Stats Package June 2016 Mike Stewart Vancouver RealtorREBGV Stats Package June 2016 Mike Stewart Vancouver Realtor
REBGV Stats Package June 2016 Mike Stewart Vancouver Realtor
 
May 2021 Real Estate Board of Greater Vancouver Statistics Package
May 2021 Real Estate Board of Greater Vancouver Statistics PackageMay 2021 Real Estate Board of Greater Vancouver Statistics Package
May 2021 Real Estate Board of Greater Vancouver Statistics Package
 
Real Estate Board of Greater Vancouver - Stats Package May 2021
Real Estate Board of Greater Vancouver - Stats Package May 2021Real Estate Board of Greater Vancouver - Stats Package May 2021
Real Estate Board of Greater Vancouver - Stats Package May 2021
 
Rebgv stats-pkg-may-2021
Rebgv stats-pkg-may-2021Rebgv stats-pkg-may-2021
Rebgv stats-pkg-may-2021
 
REBGV January 2020 Statistics Package
REBGV January 2020 Statistics Package REBGV January 2020 Statistics Package
REBGV January 2020 Statistics Package
 
REBGV November 2015 Statistics Package Mike Stewart Realtor
REBGV November 2015 Statistics Package Mike Stewart RealtorREBGV November 2015 Statistics Package Mike Stewart Realtor
REBGV November 2015 Statistics Package Mike Stewart Realtor
 
REBGV Statistics Package October 2020
REBGV Statistics Package October 2020REBGV Statistics Package October 2020
REBGV Statistics Package October 2020
 
Rebgv stats-pkg-october-2020
Rebgv stats-pkg-october-2020Rebgv stats-pkg-october-2020
Rebgv stats-pkg-october-2020
 

More from Vicky Aulakh

Okanagan Statistics May2023.pdf
Okanagan Statistics May2023.pdfOkanagan Statistics May2023.pdf
Okanagan Statistics May2023.pdfVicky Aulakh
 
FVREB May 2023 Statistics Package.pdf
FVREB May 2023 Statistics Package.pdfFVREB May 2023 Statistics Package.pdf
FVREB May 2023 Statistics Package.pdfVicky Aulakh
 
Metro Vancouver Stats.pdf
Metro Vancouver Stats.pdfMetro Vancouver Stats.pdf
Metro Vancouver Stats.pdfVicky Aulakh
 
FVREB July 2022
FVREB July 2022FVREB July 2022
FVREB July 2022Vicky Aulakh
 
VREB July 2022
VREB July 2022VREB July 2022
VREB July 2022Vicky Aulakh
 
BCRE June 2022
BCRE June 2022BCRE June 2022
BCRE June 2022Vicky Aulakh
 
Okanagan Stats June 2022
Okanagan Stats June 2022Okanagan Stats June 2022
Okanagan Stats June 2022Vicky Aulakh
 
Okanagan Stats May 2022
Okanagan Stats May 2022Okanagan Stats May 2022
Okanagan Stats May 2022Vicky Aulakh
 
VREB June 2022 Stats
VREB June 2022 StatsVREB June 2022 Stats
VREB June 2022 StatsVicky Aulakh
 
FVREB June 2022 Stats
FVREB June 2022 StatsFVREB June 2022 Stats
FVREB June 2022 StatsVicky Aulakh
 
FVREB May 2022
FVREB May 2022FVREB May 2022
FVREB May 2022Vicky Aulakh
 
VREB May 2022 Statistics Package.pdf
VREB May 2022 Statistics Package.pdfVREB May 2022 Statistics Package.pdf
VREB May 2022 Statistics Package.pdfVicky Aulakh
 
The Okanagan Real Estate April 2022 Statistics
The Okanagan Real Estate April 2022 StatisticsThe Okanagan Real Estate April 2022 Statistics
The Okanagan Real Estate April 2022 StatisticsVicky Aulakh
 
FVREB April 2022 Stats Package .pdf
FVREB April 2022 Stats Package .pdfFVREB April 2022 Stats Package .pdf
FVREB April 2022 Stats Package .pdfVicky Aulakh
 
VREB April 2022 Stats Package .pdf
VREB April 2022 Stats Package .pdfVREB April 2022 Stats Package .pdf
VREB April 2022 Stats Package .pdfVicky Aulakh
 
March 2022 Okanagan Statistics
March 2022 Okanagan StatisticsMarch 2022 Okanagan Statistics
March 2022 Okanagan StatisticsVicky Aulakh
 
FVREB Statistics Package March 2022
FVREB Statistics Package March 2022FVREB Statistics Package March 2022
FVREB Statistics Package March 2022Vicky Aulakh
 
February 2022 Okanagan Real Estate Board Statistics Package With Charts & Graphs
February 2022 Okanagan Real Estate Board Statistics Package With Charts & GraphsFebruary 2022 Okanagan Real Estate Board Statistics Package With Charts & Graphs
February 2022 Okanagan Real Estate Board Statistics Package With Charts & GraphsVicky Aulakh
 
Victoria Real Estate Board February 2022
Victoria Real Estate Board February 2022Victoria Real Estate Board February 2022
Victoria Real Estate Board February 2022Vicky Aulakh
 

More from Vicky Aulakh (20)

Okanagan Statistics May2023.pdf
Okanagan Statistics May2023.pdfOkanagan Statistics May2023.pdf
Okanagan Statistics May2023.pdf
 
FVREB May 2023 Statistics Package.pdf
FVREB May 2023 Statistics Package.pdfFVREB May 2023 Statistics Package.pdf
FVREB May 2023 Statistics Package.pdf
 
Metro Vancouver Stats.pdf
Metro Vancouver Stats.pdfMetro Vancouver Stats.pdf
Metro Vancouver Stats.pdf
 
FVREB July 2022
FVREB July 2022FVREB July 2022
FVREB July 2022
 
VREB July 2022
VREB July 2022VREB July 2022
VREB July 2022
 
BCRE June 2022
BCRE June 2022BCRE June 2022
BCRE June 2022
 
Okanagan Stats June 2022
Okanagan Stats June 2022Okanagan Stats June 2022
Okanagan Stats June 2022
 
Okanagan Stats May 2022
Okanagan Stats May 2022Okanagan Stats May 2022
Okanagan Stats May 2022
 
VREB June 2022 Stats
VREB June 2022 StatsVREB June 2022 Stats
VREB June 2022 Stats
 
FVREB June 2022 Stats
FVREB June 2022 StatsFVREB June 2022 Stats
FVREB June 2022 Stats
 
FVREB May 2022
FVREB May 2022FVREB May 2022
FVREB May 2022
 
VREB May 2022 Statistics Package.pdf
VREB May 2022 Statistics Package.pdfVREB May 2022 Statistics Package.pdf
VREB May 2022 Statistics Package.pdf
 
The Okanagan Real Estate April 2022 Statistics
The Okanagan Real Estate April 2022 StatisticsThe Okanagan Real Estate April 2022 Statistics
The Okanagan Real Estate April 2022 Statistics
 
FVREB April 2022 Stats Package .pdf
FVREB April 2022 Stats Package .pdfFVREB April 2022 Stats Package .pdf
FVREB April 2022 Stats Package .pdf
 
VREB April 2022 Stats Package .pdf
VREB April 2022 Stats Package .pdfVREB April 2022 Stats Package .pdf
VREB April 2022 Stats Package .pdf
 
BCREA.pdf
BCREA.pdfBCREA.pdf
BCREA.pdf
 
March 2022 Okanagan Statistics
March 2022 Okanagan StatisticsMarch 2022 Okanagan Statistics
March 2022 Okanagan Statistics
 
FVREB Statistics Package March 2022
FVREB Statistics Package March 2022FVREB Statistics Package March 2022
FVREB Statistics Package March 2022
 
February 2022 Okanagan Real Estate Board Statistics Package With Charts & Graphs
February 2022 Okanagan Real Estate Board Statistics Package With Charts & GraphsFebruary 2022 Okanagan Real Estate Board Statistics Package With Charts & Graphs
February 2022 Okanagan Real Estate Board Statistics Package With Charts & Graphs
 
Victoria Real Estate Board February 2022
Victoria Real Estate Board February 2022Victoria Real Estate Board February 2022
Victoria Real Estate Board February 2022
 

Recently uploaded

9990771857 Call Girls in Noida Sector 11 Noida (Call Girls) Delhi
9990771857 Call Girls in Noida Sector 11 Noida (Call Girls) Delhi9990771857 Call Girls in Noida Sector 11 Noida (Call Girls) Delhi
9990771857 Call Girls in Noida Sector 11 Noida (Call Girls) Delhidelhimodel235
 
9990771857 Call Girls in Noida Sector 1 Noida (Call Girls) Delhi
9990771857 Call Girls in Noida Sector 1 Noida (Call Girls) Delhi9990771857 Call Girls in Noida Sector 1 Noida (Call Girls) Delhi
9990771857 Call Girls in Noida Sector 1 Noida (Call Girls) Delhidelhimodel235
 
Call Girls in Khan Market 9654467111 ESCORTS SERVICE
Call Girls in Khan Market 9654467111 ESCORTS SERVICECall Girls in Khan Market 9654467111 ESCORTS SERVICE
Call Girls in Khan Market 9654467111 ESCORTS SERVICESapana Sha
 
call girls in Shahdara (DELHI) 🔝 >༒9953330565🔝 genuine Escort Service 🔝✔️✔️
call girls in Shahdara (DELHI) 🔝 >༒9953330565🔝 genuine Escort Service 🔝✔️✔️call girls in Shahdara (DELHI) 🔝 >༒9953330565🔝 genuine Escort Service 🔝✔️✔️
call girls in Shahdara (DELHI) 🔝 >༒9953330565🔝 genuine Escort Service 🔝✔️✔️9953056974 Low Rate Call Girls In Saket, Delhi NCR
 
Omaxe Dwarka In Delhi E Brochure Pdf
Omaxe Dwarka In Delhi E Brochure     PdfOmaxe Dwarka In Delhi E Brochure     Pdf
Omaxe Dwarka In Delhi E Brochure Pdfashiyadav24
 
call girls in ganesh nagar Delhi 8264348440 ✅ call girls ❤️
call girls in ganesh nagar Delhi 8264348440 ✅ call girls ❤️call girls in ganesh nagar Delhi 8264348440 ✅ call girls ❤️
call girls in ganesh nagar Delhi 8264348440 ✅ call girls ❤️soniya singh
 
Call Girls Janta Market {Delhi//8447779280)) ₹↬Short 2000 Full Night 5500 ↫Es...
Call Girls Janta Market {Delhi//8447779280)) ₹↬Short 2000 Full Night 5500 ↫Es...Call Girls Janta Market {Delhi//8447779280)) ₹↬Short 2000 Full Night 5500 ↫Es...
Call Girls Janta Market {Delhi//8447779280)) ₹↬Short 2000 Full Night 5500 ↫Es...asmaqueen5
 
Model Call Girl in Shastri Nagar Delhi reach out to us at 🔝8264348440🔝
Model Call Girl in Shastri Nagar Delhi reach out to us at 🔝8264348440🔝Model Call Girl in Shastri Nagar Delhi reach out to us at 🔝8264348440🔝
Model Call Girl in Shastri Nagar Delhi reach out to us at 🔝8264348440🔝soniya singh
 
9990771857 Call Girls in Noida Sector 06 Noida (Call Girls) Delhi
9990771857 Call Girls in Noida Sector 06 Noida (Call Girls) Delhi9990771857 Call Girls in Noida Sector 06 Noida (Call Girls) Delhi
9990771857 Call Girls in Noida Sector 06 Noida (Call Girls) Delhidelhimodel235
 
How to Build Multifamily and Laneway Suites in Toronto!! (feat. Expert Archi...
How to Build Multifamily and Laneway Suites  in Toronto!! (feat. Expert Archi...How to Build Multifamily and Laneway Suites  in Toronto!! (feat. Expert Archi...
How to Build Multifamily and Laneway Suites in Toronto!! (feat. Expert Archi...Volition Properties
 
Low Rate Call Girls in Trilokpuri Delhi Call 9990771857
Low Rate Call Girls in Trilokpuri Delhi Call 9990771857Low Rate Call Girls in Trilokpuri Delhi Call 9990771857
Low Rate Call Girls in Trilokpuri Delhi Call 9990771857delhimodel235
 
Low Rate Call Girls in Triveni Complex Delhi Call 9990771857
Low Rate Call Girls in Triveni Complex Delhi Call 9990771857Low Rate Call Girls in Triveni Complex Delhi Call 9990771857
Low Rate Call Girls in Triveni Complex Delhi Call 9990771857delhimodel235
 
Call Girls In Hari Nagar Dadb Block {8447779280}Hari Nagar {West Delhi Escort...
Call Girls In Hari Nagar Dadb Block {8447779280}Hari Nagar {West Delhi Escort...Call Girls In Hari Nagar Dadb Block {8447779280}Hari Nagar {West Delhi Escort...
Call Girls In Hari Nagar Dadb Block {8447779280}Hari Nagar {West Delhi Escort...asmaqueen5
 
Building Dreams: Newman Leech's Visionary Approach to Real Estate Investment
Building Dreams: Newman Leech's Visionary Approach to Real Estate InvestmentBuilding Dreams: Newman Leech's Visionary Approach to Real Estate Investment
Building Dreams: Newman Leech's Visionary Approach to Real Estate InvestmentNewman George Leech
 
9990771857 Call Girls in Noida Sector 10 Noida (Call Girls) Delhi
9990771857 Call Girls in Noida Sector 10 Noida (Call Girls) Delhi9990771857 Call Girls in Noida Sector 10 Noida (Call Girls) Delhi
9990771857 Call Girls in Noida Sector 10 Noida (Call Girls) Delhidelhimodel235
 
Call Girls in Model Town Delhi 💯Call Us 🔝8264348440🔝
Call Girls in Model Town Delhi 💯Call Us 🔝8264348440🔝Call Girls in Model Town Delhi 💯Call Us 🔝8264348440🔝
Call Girls in Model Town Delhi 💯Call Us 🔝8264348440🔝soniya singh
 
Low Rate Call Girls in Tughlakabad Delhi Call 9990771857
Low Rate Call Girls in Tughlakabad Delhi Call 9990771857Low Rate Call Girls in Tughlakabad Delhi Call 9990771857
Low Rate Call Girls in Tughlakabad Delhi Call 9990771857delhimodel235
 
Call Girls in Pitampura Delhi 💯Call Us 🔝8264348440🔝
Call Girls in Pitampura Delhi 💯Call Us 🔝8264348440🔝Call Girls in Pitampura Delhi 💯Call Us 🔝8264348440🔝
Call Girls in Pitampura Delhi 💯Call Us 🔝8264348440🔝soniya singh
 

Recently uploaded (20)

9990771857 Call Girls in Noida Sector 11 Noida (Call Girls) Delhi
9990771857 Call Girls in Noida Sector 11 Noida (Call Girls) Delhi9990771857 Call Girls in Noida Sector 11 Noida (Call Girls) Delhi
9990771857 Call Girls in Noida Sector 11 Noida (Call Girls) Delhi
 
9990771857 Call Girls in Noida Sector 1 Noida (Call Girls) Delhi
9990771857 Call Girls in Noida Sector 1 Noida (Call Girls) Delhi9990771857 Call Girls in Noida Sector 1 Noida (Call Girls) Delhi
9990771857 Call Girls in Noida Sector 1 Noida (Call Girls) Delhi
 
Call Girls in Khan Market 9654467111 ESCORTS SERVICE
Call Girls in Khan Market 9654467111 ESCORTS SERVICECall Girls in Khan Market 9654467111 ESCORTS SERVICE
Call Girls in Khan Market 9654467111 ESCORTS SERVICE
 
call girls in Shahdara (DELHI) 🔝 >༒9953330565🔝 genuine Escort Service 🔝✔️✔️
call girls in Shahdara (DELHI) 🔝 >༒9953330565🔝 genuine Escort Service 🔝✔️✔️call girls in Shahdara (DELHI) 🔝 >༒9953330565🔝 genuine Escort Service 🔝✔️✔️
call girls in Shahdara (DELHI) 🔝 >༒9953330565🔝 genuine Escort Service 🔝✔️✔️
 
Omaxe Dwarka In Delhi E Brochure Pdf
Omaxe Dwarka In Delhi E Brochure     PdfOmaxe Dwarka In Delhi E Brochure     Pdf
Omaxe Dwarka In Delhi E Brochure Pdf
 
call girls in ganesh nagar Delhi 8264348440 ✅ call girls ❤️
call girls in ganesh nagar Delhi 8264348440 ✅ call girls ❤️call girls in ganesh nagar Delhi 8264348440 ✅ call girls ❤️
call girls in ganesh nagar Delhi 8264348440 ✅ call girls ❤️
 
Call Girls Janta Market {Delhi//8447779280)) ₹↬Short 2000 Full Night 5500 ↫Es...
Call Girls Janta Market {Delhi//8447779280)) ₹↬Short 2000 Full Night 5500 ↫Es...Call Girls Janta Market {Delhi//8447779280)) ₹↬Short 2000 Full Night 5500 ↫Es...
Call Girls Janta Market {Delhi//8447779280)) ₹↬Short 2000 Full Night 5500 ↫Es...
 
Model Call Girl in Shastri Nagar Delhi reach out to us at 🔝8264348440🔝
Model Call Girl in Shastri Nagar Delhi reach out to us at 🔝8264348440🔝Model Call Girl in Shastri Nagar Delhi reach out to us at 🔝8264348440🔝
Model Call Girl in Shastri Nagar Delhi reach out to us at 🔝8264348440🔝
 
VIP Escorts in Delhi:🔝9953056974🔝 Hot Qutub Minar Delhi Escorts Service
VIP Escorts in Delhi:🔝9953056974🔝 Hot Qutub Minar Delhi Escorts ServiceVIP Escorts in Delhi:🔝9953056974🔝 Hot Qutub Minar Delhi Escorts Service
VIP Escorts in Delhi:🔝9953056974🔝 Hot Qutub Minar Delhi Escorts Service
 
9990771857 Call Girls in Noida Sector 06 Noida (Call Girls) Delhi
9990771857 Call Girls in Noida Sector 06 Noida (Call Girls) Delhi9990771857 Call Girls in Noida Sector 06 Noida (Call Girls) Delhi
9990771857 Call Girls in Noida Sector 06 Noida (Call Girls) Delhi
 
How to Build Multifamily and Laneway Suites in Toronto!! (feat. Expert Archi...
How to Build Multifamily and Laneway Suites  in Toronto!! (feat. Expert Archi...How to Build Multifamily and Laneway Suites  in Toronto!! (feat. Expert Archi...
How to Build Multifamily and Laneway Suites in Toronto!! (feat. Expert Archi...
 
Low Rate Call Girls in Trilokpuri Delhi Call 9990771857
Low Rate Call Girls in Trilokpuri Delhi Call 9990771857Low Rate Call Girls in Trilokpuri Delhi Call 9990771857
Low Rate Call Girls in Trilokpuri Delhi Call 9990771857
 
Low Rate Call Girls in Triveni Complex Delhi Call 9990771857
Low Rate Call Girls in Triveni Complex Delhi Call 9990771857Low Rate Call Girls in Triveni Complex Delhi Call 9990771857
Low Rate Call Girls in Triveni Complex Delhi Call 9990771857
 
Call Girls In Hari Nagar Dadb Block {8447779280}Hari Nagar {West Delhi Escort...
Call Girls In Hari Nagar Dadb Block {8447779280}Hari Nagar {West Delhi Escort...Call Girls In Hari Nagar Dadb Block {8447779280}Hari Nagar {West Delhi Escort...
Call Girls In Hari Nagar Dadb Block {8447779280}Hari Nagar {West Delhi Escort...
 
Building Dreams: Newman Leech's Visionary Approach to Real Estate Investment
Building Dreams: Newman Leech's Visionary Approach to Real Estate InvestmentBuilding Dreams: Newman Leech's Visionary Approach to Real Estate Investment
Building Dreams: Newman Leech's Visionary Approach to Real Estate Investment
 
9990771857 Call Girls in Noida Sector 10 Noida (Call Girls) Delhi
9990771857 Call Girls in Noida Sector 10 Noida (Call Girls) Delhi9990771857 Call Girls in Noida Sector 10 Noida (Call Girls) Delhi
9990771857 Call Girls in Noida Sector 10 Noida (Call Girls) Delhi
 
Call Girls in Model Town Delhi 💯Call Us 🔝8264348440🔝
Call Girls in Model Town Delhi 💯Call Us 🔝8264348440🔝Call Girls in Model Town Delhi 💯Call Us 🔝8264348440🔝
Call Girls in Model Town Delhi 💯Call Us 🔝8264348440🔝
 
Low Rate Call Girls in Tughlakabad Delhi Call 9990771857
Low Rate Call Girls in Tughlakabad Delhi Call 9990771857Low Rate Call Girls in Tughlakabad Delhi Call 9990771857
Low Rate Call Girls in Tughlakabad Delhi Call 9990771857
 
Call Girls in Pitampura Delhi 💯Call Us 🔝8264348440🔝
Call Girls in Pitampura Delhi 💯Call Us 🔝8264348440🔝Call Girls in Pitampura Delhi 💯Call Us 🔝8264348440🔝
Call Girls in Pitampura Delhi 💯Call Us 🔝8264348440🔝
 
Low Rate Call Girls in Triveni Complex Delhi Call 9873940964
Low Rate Call Girls in Triveni Complex Delhi Call 9873940964Low Rate Call Girls in Triveni Complex Delhi Call 9873940964
Low Rate Call Girls in Triveni Complex Delhi Call 9873940964
 

REBGV-Stats-Pkg-April-2022.pdf