SlideShare a Scribd company logo
1 of 9
Download to read offline
News Release
FOR IMMEDIATE RELEASE:
Summer sees home listing supply decline across Metro Vancouver
VANCOUVER, BC ā€“ September 2, 2021 ā€“ While home buyers have remained active in Metro
Vancouver* throughout the summer, the supply of homes for sale has declined steadily since
June.
The Real Estate Board of Greater Vancouver (REBGV) reports that residential home sales in the
region totalled 3,152 in August 2021, a 3.4 per cent increase from the 3,047 sales recorded in
August 2020, and a 5.2 per cent decrease from the 3,326 homes sold in July 2021.
Last monthā€™s sales were 20.4 per cent above the 10-year August sales average.
ā€œAugust was busier than expected, and listings activity isnā€™t keeping up with the pace of demand.
This is leaving the market under supplied.ā€ said Keith Stewart, REBGV economist.
There were 4,032 detached, attached and apartment properties newly listed for sale on the
Multiple Listing ServiceĀ® (MLSĀ®) in Metro Vancouver in August 2021. This represents a 30.6
per cent decrease compared to the 5,813 homes listed in August 2020 and a 7.9 per cent decrease
compared to July 2021 when 4,377 homes were listed.
The total number of homes currently listed for sale on the MLSĀ® system in Metro Vancouver is
9,005, a 29.7 per cent decrease compared to August 2020 (12,803) and an 8.6 per cent decrease
compared to July 2021 (9,850).
ā€œHousing supply is the biggest factor impacting the market right now. To help relieve pressure
on prices and improve peoplesā€™ home buying options, the market needs a more abundant supply
of homes for sale.ā€ Stewart said. ā€œHousing affordability has been a key issue in the federal
election. We encourage the political parties to focus on policy solutions that will help streamline
the creation of more diverse housing options for hopeful home buyers today and into the future.ā€
For all property types, the sales-to-active listings ratio for August 2021 is 35 per cent. By
property type, the ratio is 25.3 per cent for detached homes, 51.8 per cent for townhomes, and
39.2 per cent for apartments.
Generally, analysts say downward pressure on home prices occurs when the ratio dips below 12
per cent for a sustained period, while home prices often experience upward pressure when it
surpasses 20 per cent over several months.
ā€œWhen assessing the market, itā€™s important to understand that while year-over-year price
increases have reached double digits, most of the increases happened three or more months ago,ā€
Stewart said. ā€œTo better understand the latest home price trends in your preferred location and
home type, talk with your local REALTORĀ®.ā€
The MLSĀ® Home Price Index composite benchmark price for all residential properties in Metro
Vancouver is currently $1,176,600. This represents a 13.2 per cent increase over August 2020
and a 0.1 per cent increase compared to July 2021.
Sales of detached homes in August 2021 reached 945, a 13.7 per cent decrease from the 1,095
detached sales recorded in August 2020. The benchmark price for a detached home is
$1,807,100. This represents a 20.4 per cent increase from August 2020 and a 0.3 per cent
increase compared to July 2021.
Sales of apartment homes reached 1,631 in August 2021, a 22.4 per cent increase compared to
the 1,332 sales in August 2020. The benchmark price of an apartment property is $735,100. This
represents a 7.6 per cent increase from August 2020 and a 0.2 per cent decrease compared to July
2021.
Attached home sales in August 2021 totalled 576, a 7.1 per cent decrease compared to the 620
sales in August 2020. The benchmark price of an attached home is $952,600. This represents a
16.5 per cent increase from August 2020 and a 0.3 per cent increase compared to July 2021.
-30-
*Editorā€™s Note: Areas covered by the Real Estate Board of Greater Vancouver include: Burnaby, Coquitlam, Maple
Ridge, New Westminster, North Vancouver, Pitt Meadows, Port Coquitlam, Port Moody, Richmond, South Delta,
Squamish, Sunshine Coast, Vancouver, West Vancouver, and Whistler.
The real estate industry is a key economic driver in British Columbia. In 2020, 30,944 homes changed ownership in
the Boardā€™s area, generating $2.1 billion in economic spin-off activity and an estimated 14,728 jobs. The total dollar
value of residential sales transacted through the MLSĀ® system in Greater Vancouver totalled $33.7 billion in 2020.
The Real Estate Board of Greater Vancouver is an association representing more than 14,000 REALTORSĀ® and
their companies. The Board provides a variety of member services, including the Multiple Listing ServiceĀ®. For
more information on real estate, statistics, and buying or selling a home, contact a local REALTORĀ® or visit
www.rebgv.org.
For more information please contact:
Craig Munn
Director, Communication
Real Estate Board of Greater Vancouver
604.730.3146
cmunn@rebgv.org
Property Type Area
Benchmark
Price
Price
Index
1 Month
Change %
3 Month
Change %
6 Month
Change %
1 Year
Change %
3 Year
Change %
5 Year
Change %
10 Year
Change %
Residential / Composite Lower Mainland $1,152,800 321.1 0.5% 1.0% 10.3% 17.1% 14.1% 35.3% 105.2%
Greater Vancouver $1,176,600 309.7 0.1% 0.3% 8.2% 13.2% 9.5% 25.4% 90.6%
Bowen Island $1,430,800 310.2 1.7% 2.6% 17.5% 34.1% 45.3% 79.3% 130.8%
Burnaby East $1,081,300 308.3 0.6% 0.9% 9.4% 10.9% 9.2% 21.9% 92.6%
Burnaby North $1,114,800 300.3 0.7% 1.7% 7.6% 11.8% 5.6% 24.7% 89.8%
Burnaby South $1,052,900 298.9 0.9% 0.7% 7.4% 9.5% 2.1% 20.8% 78.8%
Coquitlam $1,093,400 325.0 -0.1% 0.5% 9.5% 16.2% 11.1% 37.0% 117.7%
Ladner $1,032,200 292.5 0.9% 0.5% 9.3% 20.4% 16.2% 20.0% 86.8%
Maple Ridge $1,002,100 319.1 0.5% 1.1% 15.0% 27.1% 24.8% 61.5% 134.6%
New Westminster $728,100 323.0 0.9% 1.7% 8.8% 10.7% 5.9% 40.8% 102.6%
North Vancouver $1,218,200 279.9 -0.7% -0.5% 5.9% 12.3% 11.1% 18.8% 93.3%
Pitt Meadows $915,100 334.4 0.5% 0.8% 11.5% 21.5% 15.9% 59.0% 138.3%
Port Coquitlam $924,300 316.4 -0.2% 0.1% 10.6% 19.0% 16.9% 45.1% 117.5%
Port Moody $1,061,100 298.4 0.7% 1.4% 9.9% 17.0% 10.1% 38.9% 115.1%
Richmond $1,081,700 323.0 0.2% 0.4% 7.3% 13.3% 7.7% 22.7% 84.2%
Squamish $1,012,600 313.9 -0.3% 0.1% 12.1% 22.5% 22.4% 54.4% 138.3%
Sunshine Coast $811,900 299.4 0.9% 1.0% 13.7% 30.0% 30.7% 71.4% 119.3%
Tsawwassen $1,158,700 293.5 1.1% 3.1% 8.4% 17.2% 13.3% 13.7% 87.7%
Vancouver East $1,200,400 356.7 0.1% -0.8% 6.7% 8.2% 6.6% 19.2% 97.7%
Vancouver West $1,366,800 285.4 -0.4% -0.3% 5.4% 5.9% 1.7% 8.5% 64.6%
West Vancouver $2,496,700 274.9 -1.5% -1.7% 2.9% 14.9% 5.4% -7.9% 64.5%
Whistler $1,286,200 287.6 -0.5% 0.6% 11.3% 24.9% 26.0% 70.0% 128.8%
Single Family Detached Lower Mainland $1,615,000 344.1 0.8% 0.7% 12.6% 25.3% 23.6% 28.7% 113.2%
Greater Vancouver $1,807,100 333.0 0.3% 0.4% 10.4% 20.4% 16.5% 14.9% 90.7%
Bowen Island $1,430,800 310.2 1.7% 2.6% 17.5% 34.1% 45.3% 79.3% 130.8%
Burnaby East $1,472,200 329.2 2.8% 0.2% 11.7% 17.1% 16.0% 16.8% 103.5%
Burnaby North $1,761,800 340.7 0.9% 2.9% 12.0% 19.3% 17.4% 10.3% 94.6%
Burnaby South $1,788,100 342.3 0.8% 1.3% 9.7% 15.0% 10.3% 5.1% 86.6%
Coquitlam $1,508,600 334.8 0.2% 0.6% 10.7% 22.7% 15.6% 22.7% 119.0%
Ladner $1,287,300 308.1 1.9% -0.4% 11.1% 28.1% 29.7% 21.2% 101.8%
Maple Ridge $1,138,700 324.4 0.8% 1.5% 17.1% 32.8% 30.9% 59.8% 143.5%
New Westminster $1,328,500 331.4 2.1% 1.4% 12.8% 20.9% 17.4% 21.1% 97.7%
North Vancouver $1,865,800 293.8 -1.6% -1.9% 4.6% 15.5% 15.1% 9.6% 101.5%
Pitt Meadows $1,199,500 338.0 0.5% 0.8% 12.4% 27.2% 27.4% 53.0% 144.9%
Port Coquitlam $1,249,300 333.1 0.7% -0.3% 10.0% 25.7% 23.9% 37.0% 126.8%
Port Moody $1,855,700 342.7 -0.4% 1.9% 12.1% 26.5% 21.4% 33.3% 124.3%
Richmond $1,920,400 368.2 0.5% -0.6% 10.1% 18.3% 10.3% 5.7% 76.0%
Squamish $1,363,100 334.1 0.2% -2.3% 14.8% 26.7% 34.7% 55.9% 156.2%
Sunshine Coast $847,800 297.0 1.7% 1.1% 15.0% 32.6% 37.2% 78.4% 118.4%
Tsawwassen $1,406,200 307.0 2.2% 3.4% 10.1% 22.7% 21.4% 14.2% 97.4%
Vancouver East $1,689,700 372.2 -0.2% -1.2% 7.9% 12.4% 11.7% 10.4% 104.4%
Vancouver West $3,462,200 350.2 -0.1% 2.3% 8.1% 12.2% 5.7% -4.5% 53.9%
West Vancouver $3,088,900 291.6 -1.1% -1.6% 3.9% 15.6% 9.1% -9.2% 68.7%
Whistler $2,478,900 312.9 0.6% -1.3% 18.0% 32.3% 44.7% 67.5% 146.8%
HOW TO READ THE TABLE:
ā€¢ Benchmark Price: Estimated sale price of a benchmark property. Benchmarks represent a typical property within each market.
ā€¢ Price Index: Index numbers estimate the percentage change in price on typical and constant quality properties over time. All figures are based on past sales.
ā€¢ x Month/Year Change %: Percentage change of index over a period of x month(s)/year(s) *
In January 2005, the indexes are set to 100.
Townhome properties are similar to Attached properties, a category that was used in the previous MLSLink HPI, but do not included duplexes.
The above info is deemed reliable, but is not guaranteed. All dollar amounts in CDN.
August 2021
*
* MLSĀ®, Multiple Listing ServiceĀ®, and all related graphics are trademarks of The Canadian Real Estate Association 1 of 18
Property Type Area
Benchmark
Price
Price
Index
1 Month
Change %
3 Month
Change %
6 Month
Change %
1 Year
Change %
3 Year
Change %
5 Year
Change %
10 Year
Change %
August 2021
*
Townhouse Lower Mainland $849,000 306.0 0.8% 2.9% 13.1% 19.5% 16.1% 47.3% 105.9%
Greater Vancouver $952,600 305.6 0.3% 1.7% 11.1% 16.5% 12.6% 37.9% 96.5%
Burnaby East $689,000 309.1 -1.6% -0.6% 5.7% 3.8% 8.0% 34.3% 94.3%
Burnaby North $828,900 309.4 -0.2% 1.5% 7.7% 13.2% 8.2% 40.4% 92.9%
Burnaby South $757,700 316.9 0.3% 1.4% 7.6% 9.1% 5.2% 31.5% 92.9%
Coquitlam $848,900 311.4 0.2% 1.8% 11.6% 17.9% 17.0% 48.5% 109.6%
Ladner $764,200 282.8 1.3% 1.0% 7.3% 14.7% 1.1% 23.0% 71.0%
Maple Ridge $686,900 318.9 -0.2% 1.3% 15.6% 24.1% 21.3% 63.1% 127.8%
New Westminster $845,400 322.9 1.4% 1.3% 9.6% 13.8% 10.1% 43.2% 99.7%
North Vancouver $1,140,100 281.9 1.3% 3.2% 10.2% 13.8% 16.1% 25.3% 95.8%
Pitt Meadows $762,900 330.1 1.3% 2.8% 17.2% 21.9% 14.3% 59.2% 132.3%
Port Coquitlam $797,700 302.0 0.3% 2.2% 14.4% 21.5% 19.5% 43.3% 110.3%
Port Moody $766,300 260.6 0.7% 1.8% 13.1% 15.1% 7.8% 39.8% 81.1%
Richmond $938,400 308.4 0.6% 2.9% 9.2% 15.6% 8.5% 29.3% 85.0%
Squamish $879,200 296.8 -1.1% 0.1% 12.2% 24.5% 18.1% 54.1% 145.1%
Sunshine Coast $601,400 288.1 -1.7% -0.6% 11.8% 29.5% 24.9% 48.4% 135.6%
Tsawwassen $850,300 279.9 1.6% 0.8% 6.4% 8.1% -8.4% 15.4% 66.6%
Vancouver East $1,021,300 324.8 2.7% 2.9% 12.2% 13.1% 9.4% 35.0% 89.9%
Vancouver West $1,286,600 300.8 -0.4% 0.9% 10.2% 10.7% 7.7% 20.3% 85.6%
Whistler $1,269,300 310.8 -1.9% 0.0% 11.5% 27.6% 25.0% 72.7% 165.4%
Apartment Lower Mainland $729,700 308.2 0.1% 0.4% 6.9% 9.3% 5.4% 45.6% 100.3%
Greater Vancouver $735,100 295.2 -0.2% -0.3% 5.5% 7.6% 3.8% 36.6% 91.3%
Burnaby East $730,800 290.9 0.3% 2.6% 9.3% 9.5% 2.7% 31.0% 79.9%
Burnaby North $721,700 282.7 0.7% 1.0% 5.5% 8.3% 0.4% 38.1% 91.7%
Burnaby South $684,800 280.6 1.1% 0.3% 6.0% 7.1% -1.9% 31.6% 73.7%
Coquitlam $586,600 321.9 -0.4% -0.2% 7.4% 10.9% 6.2% 58.2% 124.2%
Ladner $571,300 267.6 -2.1% 2.0% 7.3% 9.8% 3.7% 20.7% 66.8%
Maple Ridge $427,800 305.9 0.4% -0.5% 8.4% 17.0% 13.0% 72.5% 115.6%
New Westminster $567,100 321.3 0.6% 1.9% 7.8% 8.3% 3.0% 49.8% 105.7%
North Vancouver $649,600 264.3 -0.8% -0.7% 5.0% 8.8% 5.8% 31.8% 83.4%
Pitt Meadows $544,300 334.2 0.1% -0.7% 7.1% 16.4% 8.1% 68.1% 133.7%
Port Coquitlam $523,200 312.9 -1.1% -0.8% 8.7% 13.0% 10.9% 59.9% 115.3%
Port Moody $723,000 301.3 1.5% 1.2% 7.6% 13.8% 7.5% 51.6% 139.5%
Richmond $713,400 305.4 -0.2% -0.2% 4.4% 8.9% 6.1% 51.7% 101.1%
Squamish $565,500 306.7 0.1% 3.5% 9.0% 15.2% 10.9% 55.8% 103.4%
Sunshine Coast $511,200 309.4 -2.0% 1.1% 6.2% 13.9% 3.6% 43.5% 100.1%
Tsawwassen $637,400 274.9 -0.9% 3.8% 6.3% 10.0% 1.4% 19.8% 73.4%
Vancouver East $629,500 353.8 -0.5% -1.1% 5.0% 4.8% 2.6% 31.2% 94.9%
Vancouver West $825,000 267.7 -0.5% -1.3% 3.8% 3.2% 0.0% 18.3% 73.0%
West Vancouver $1,102,400 224.0 -3.5% -2.5% -1.1% 10.1% -8.0% 13.2% 57.7%
Whistler $591,200 254.1 -0.2% 2.6% 6.8% 18.6% 16.0% 69.9% 83.2%
HOW TO READ THE TABLE:
ā€¢ Benchmark Price: Estimated sale price of a benchmark property. Benchmarks represent a typical property within each market.
ā€¢ Price Index: Index numbers estimate the percentage change in price on typical and constant quality properties over time. All figures are based on past sales.
ā€¢ x Month/Year Change %: Percentage change of index over a period of x month(s)/year(s)
In January 2005, the indexes are set to 100. *
Townhome properties are similar to attached properties, a category that was used in the previous MLSLink HPI, but do not included duplexes.
Lower Mainland includes areas serviced by both Real Estate Board of Greater Vancouver & Fraser Valley Real Estate Board.
The above info is deemed reliable, but is not guaranteed. All dollar amounts in CDN.
* MLSĀ®, Multiple Listing ServiceĀ®, and all related graphics are trademarks of The Canadian Real Estate Association 2 of 18
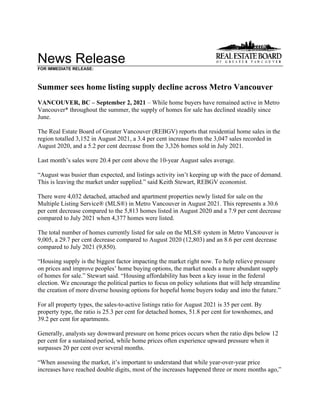
C:DATAMonthEndHpiexporthi_resgv-hpi2.tif
Greater
Vancouver
5
Year
Trend
60
110
160
210
260
310
360
Aug 2016
Oct 2016
Dec 2016
Feb 2017
Apr 2017
Jun 2017
Aug 2017
Oct 2017
Dec 2017
Feb 2018
Apr 2018
Jun 2018
Aug 2018
Oct 2018
Dec 2018
Feb 2019
Apr 2019
Jun 2019
Aug 2019
Oct 2019
Dec 2019
Feb 2020
Apr 2020
Jun 2020
Aug 2020
Oct 2020
Dec 2020
Feb 2021
Apr 2021
Jun 2021
Aug 2021
Price
Index
Residential
Detached
Townhouse
Apartment
Jan
2005
HPI
=
100
8
28
2021
MLS
Ā®
SALES
Facts
B
u
r
n
a
b
y
C
o
q
u
it
la
m
D
e
lt
a
-
S
o
u
th
Is
la
n
d
s
-
G
u
lf
M
a
p
le
R
id
g
e
/P
it
t
M
e
a
d
o
w
s
N
e
w
W
e
s
tm
in
s
t
e
r
N
o
r
th
V
a
n
c
o
u
v
e
r
P
o
r
t
C
o
q
u
it
la
m
P
o
r
t
M
o
o
d
y
/B
e
lc
a
r
r
a
R
ic
h
m
o
n
d
S
q
u
a
m
is
h
S
u
n
s
h
in
e
C
o
a
s
t
V
a
n
c
o
u
v
e
r
E
a
s
t
V
a
n
c
o
u
v
e
r
W
e
s
t
W
e
s
t
V
a
n
c
o
u
v
e
r
/H
o
w
e
S
o
u
n
d
W
h
is
tl
e
r
/P
e
m
b
e
r
to
n
Detached
72
99
63
4
117
21
72
36
18
117
19
67
102
75
43
20
945
Attached
82
48
20
1
51
23
42
23
8
106
17
11
40
79
5
20
576
Apartment
253
140
27
1
39
103
99
40
31
221
10
14
155
443
19
36
1,631
Detached
$1,825,000
$1,550,000
$1,287,000
n/a
$1,200,000
$1,605,000
$1,870,000
$1,301,500
n/a
$1,994,000
n/a
$864,834
$1,810,000
$3,284,000
$2,967,500
$3,250,000
Attached
$870,000
$931,500
$749,900
n/a
$731,000
$879,900
$1,329,950
$864,950
n/a
$950,000
n/a
n/a
$1,189,900
$1,520,000
n/a
$1,319,000
n/a
Apartment
$656,450
$605,000
$530,000
n/a
$458,000
$550,000
$670,000
$512,000
$667,000
$602,500
n/a
n/a
$599,950
$775,000
n/a
$617,500
Detached
98
102
47
15
127
29
72
39
21
94
14
77
144
93
54
24
1,050
Attached
90
48
20
1
57
20
39
24
47
98
13
7
57
57
8
24
610
Apartment
251
142
28
1
41
113
137
39
22
236
15
5
158
419
21
38
1,666
Detached
$1,817,500
$1,513,400
$1,300,000
n/a
$1,105,000
$1,360,000
$1,875,000
$1,260,000
$1,710,000
$1,743,000
n/a
$899,000
$1,688,500
$3,200,000
$2,900,000
$2,392,000
Attached
$961,000
$876,000
$797,400
n/a
$668,000
$896,200
$1,385,000
$854,500
$929,000
$938,500
n/a
n/a
$1,165,000
$1,390,000
n/a
$1,037,000
n/a
Apartment
$639,000
$592,500
$580,000
n/a
$458,000
$555,000
$699,800
$498,000
$705,000
$620,000
n/a
n/a
$630,000
$780,000
$985,000
$482,500
Detached
98
85
53
7
142
34
103
39
23
99
29
105
118
91
49
20
1,095
Attached
64
52
17
0
70
28
54
24
29
95
22
18
56
56
4
31
620
Apartment
197
106
23
0
41
99
92
39
33
140
17
11
155
342
11
26
1,332
Detached
$1,561,000
$1,297,500
$1,136,750
n/a
$929,960
$1,214,000
$1,710,000
$960,000
$1,348,750
$1,625,000
$1,095,000
$745,000
$1,616,000
$3,030,000
$2,675,000
$1,840,000
Attached
$780,900
$853,000
n/a
n/a
$550,000
$724,000
$1,078,250
$706,000
$735,000
$858,800
$720,000
n/a
$1,154,400
$1,342,500
n/a
$1,137,500
n/a
Apartment
$586,500
$521,000
$504,450
n/a
$374,900
$506,000
$624,000
$477,500
$591,500
$582,000
n/a
n/a
$636,000
$775,000
n/a
$459,950
Detached
855
969
558
70
1,309
259
883
418
201
1,121
212
589
1,302
841
502
178
10,267
Attached
783
487
193
5
618
164
504
227
217
982
178
91
555
634
64
211
5,913
Apartment
2,327
1,146
288
3
514
936
1,185
433
316
1,893
177
99
1,595
3,666
164
318
15,060
Detached
$1,778,000
$1,530,000
$1,325,000
$813,750
$1,150,000
$1,330,000
$1,910,000
$1,250,000
$1,700,000
$1,760,000
$1,403,000
$869,500
$1,750,000
$3,360,000
$3,035,000
$2,225,000
Attached
$901,250
$950,000
$809,900
n/a
$675,000
$829,500
$1,209,950
$807,500
$905,200
$938,000
$877,950
$525,000
$1,188,950
$1,450,000
$1,912,500
$1,150,000
n/a
Apartment
$633,400
$580,000
$570,000
n/a
$445,000
$548,300
$691,000
$496,500
$650,000
$599,000
$577,000
$499,000
$624,950
$775,000
$998,500
$581,250
Detached
458
540
330
38
783
155
541
229
129
546
138
431
725
535
302
100
5,980
Attached
336
334
113
3
451
102
269
175
127
536
110
55
302
352
25
140
3,430
Apartment
1,071
635
136
0
283
552
681
249
181
966
95
41
903
2,046
76
132
8,047
Detached
$1,487,825
$1,266,500
$1,095,000
$512,500
$899,524
$1,208,000
$1,650,000
$968,000
$1,358,500
$1,550,000
$1,116,815
$679,500
$1,530,000
$3,048,000
$2,468,000
$1,845,000
Attached
$790,000
$828,900
$716,000
n/a
$549,900
$719,950
$1,050,000
$690,000
$781,000
$838,800
$700,000
$479,950
$1,125,500
$1,300,000
$1,645,000
$1,050,000
n/a
Apartment
$585,000
$515,000
$510,000
n/a
$385,100
$509,950
$641,000
$448,000
$610,000
$550,000
$465,000
$398,500
$607,500
$755,000
$956,000
$454,950
Note:
Median
Selling
Prices
are
not
reported
for
areas
with
less
than
20
sales
or
for
the
Gulf
Islands
Number
of
Sales
August
2021
Number
of
Sales
Median
Selling
Price
Number
of
Sales
Median
Selling
Price
Number
of
Sales
Median
Selling
Price
July
2021
August
2020
Jan.
-
Aug.
2021
Jan.
-
Aug.
2020
Median
Selling
Price
Number
of
Sales
Median
Selling
Price
August
2021
Year-to-date
Year-to-date
8
28
2021
MLS
Ā®
LISTINGS
Facts
B
u
r
n
a
b
y
C
o
q
u
it
la
m
D
e
lt
a
-
S
o
u
th
Is
la
n
d
s
-
G
u
lf
M
a
p
le
R
id
g
e
/P
it
t
M
e
a
d
o
w
s
N
e
w
W
e
s
tm
in
s
t
e
r
N
o
r
th
V
a
n
c
o
u
v
e
r
P
o
r
t
C
o
q
u
it
la
m
P
o
r
t
M
o
o
d
y
/B
e
lc
a
r
r
a
R
ic
h
m
o
n
d
S
q
u
a
m
is
h
S
u
n
s
h
in
e
C
o
a
s
t
V
a
n
c
o
u
v
e
r
E
a
s
t
V
a
n
c
o
u
v
e
r
W
e
s
t
W
e
s
t
V
a
n
c
o
u
v
e
r
/H
o
w
e
S
o
u
n
d
W
h
is
tl
e
r
/P
e
m
b
e
r
to
n
Detached
110
93
53
12
114
23
74
40
32
165
14
66
136
182
101
21
1,236
Attached
102
47
23
0
62
15
45
22
9
107
9
9
75
90
6
17
638
Apartment
358
158
25
3
75
127
127
52
35
265
14
21
214
627
19
38
2,158
Detached
65%
106%
119%
33%
103%
91%
97%
90%
56%
71%
136%
102%
75%
41%
43%
95%
Attached
80%
102%
87%
n/a
82%
153%
93%
105%
89%
99%
189%
122%
53%
88%
83%
118%
n/a
Apartment
71%
89%
108%
33%
52%
81%
78%
77%
89%
83%
71%
67%
72%
71%
100%
95%
Detached
109
99
54
7
150
36
86
43
26
175
23
95
140
168
117
25
1,353
Attached
114
54
21
0
50
22
48
23
17
124
15
13
73
87
13
15
689
Apartment
362
186
21
0
66
143
162
41
37
308
7
15
264
654
27
42
2,335
Detached
90%
103%
87%
214%
85%
81%
84%
91%
81%
54%
61%
81%
103%
55%
46%
96%
Attached
79%
89%
95%
n/a
114%
91%
81%
104%
276%
79%
87%
54%
78%
66%
62%
160%
n/a
Apartment
69%
76%
133%
n/a
62%
79%
85%
95%
59%
77%
214%
33%
60%
64%
78%
90%
Detached
163
147
98
12
179
49
159
49
38
178
36
101
266
191
144
39
1,849
Attached
116
88
41
0
87
46
73
42
35
178
26
15
118
123
16
38
1,042
Apartment
441
170
40
0
70
186
256
75
44
312
21
12
342
877
31
45
2,922
Detached
60%
58%
54%
58%
79%
69%
65%
80%
61%
56%
81%
104%
44%
48%
34%
51%
Attached
55%
59%
41%
n/a
80%
61%
74%
57%
83%
53%
85%
120%
47%
46%
25%
82%
n/a
Apartment
45%
62%
58%
n/a
59%
53%
36%
52%
75%
45%
81%
92%
45%
39%
35%
58%
Detached
1,509
1,425
767
80
1,698
389
1,344
623
307
1,904
309
798
2,217
1,978
1,263
210
16,821
Attached
1,074
629
260
6
694
213
665
279
279
1,237
220
97
885
1,097
131
249
8,015
Apartment
3,277
1,537
318
5
633
1,338
1,698
616
400
2,780
184
133
2,405
6,351
273
352
22,300
Detached
57%
68%
73%
88%
77%
67%
66%
67%
65%
59%
69%
74%
59%
43%
40%
85%
Attached
73%
77%
74%
83%
89%
77%
76%
81%
78%
79%
81%
94%
63%
58%
49%
85%
n/a
Apartment
71%
75%
91%
60%
81%
70%
70%
70%
79%
68%
96%
74%
66%
58%
60%
90%
Detached
954
982
650
69
1,277
289
1,093
337
259
1,186
280
696
1,367
1,214
915
236
11,804
Attached
678
584
216
9
651
203
530
286
214
929
187
112
677
787
99
264
6,426
Apartment
2,352
1,272
303
7
545
1,048
1,521
433
343
1,984
200
83
1,905
5,028
293
308
17,625
Detached
48%
55%
51%
55%
61%
54%
49%
68%
50%
46%
49%
62%
53%
44%
33%
42%
Attached
50%
57%
52%
33%
69%
50%
51%
61%
59%
58%
59%
49%
45%
45%
25%
53%
n/a
Apartment
46%
50%
45%
0%
52%
53%
45%
58%
53%
49%
48%
49%
47%
41%
26%
43%
*
Year-to-date
listings
represent
a
cumulative
total
of
listings
rather
than
total
active
listings.
%
Sales
to
Listings
Number
of
Listings
%
Sales
to
Listings
July
2021
August
2020
Jan.
-
Aug.
2021
Jan.
-
Aug.
2020
%
Sales
to
Listings
Number
of
Listings
%
Sales
to
Listings
Number
of
Listings
August
2021
Number
of
Listings
%
Sales
to
Listings
Number
of
Listings
August
2021
Year-to-date*
Year-to-date*
Listing & Sales Activity Summary
Listings Sales
1 2 3 Col. 2 & 3 5 6 7 Col. 6 & 7 9 10 Col. 9 & 10
Aug Jul Aug Percentage Aug Jul Aug Percentage Jun 2020 - Jun 2021 - Percentage
2020 2021 2021 Variance 2020 2021 2021 Variance Aug 2020 Aug 2021 Variance
BURNABY % % %
DETACHED 163 109 110 0.9 98 98 72 -26.5 231 272 17.7
ATTACHED 116 114 102 -10.5 64 90 82 -8.9 135 271 100.7
APARTMENTS 441 362 358 -1.1 197 251 253 0.8 498 777 56.0
COQUITLAM
DETACHED 147 99 93 -6.1 85 102 99 -2.9 277 327 18.1
ATTACHED 88 54 47 -13.0 52 48 48 0.0 160 150 -6.3
APARTMENTS 170 186 158 -15.1 106 142 140 -1.4 307 430 40.1
DELTA
DETACHED 98 54 53 -1.9 53 47 63 34.0 170 176 3.5
ATTACHED 41 21 23 9.5 17 20 20 0.0 55 63 14.5
APARTMENTS 40 21 25 19.0 23 28 27 -3.6 63 86 36.5
MAPLE RIDGE/PITT MEADOWS
DETACHED 179 150 114 -24.0 142 127 117 -7.9 396 392 -1.0
ATTACHED 87 50 62 24.0 70 57 51 -10.5 225 174 -22.7
APARTMENTS 70 66 75 13.6 41 41 39 -4.9 133 148 11.3
NORTH VANCOUVER
DETACHED 159 86 74 -14.0 103 72 72 0.0 288 264 -8.3
ATTACHED 73 48 45 -6.3 54 39 42 7.7 144 146 1.4
APARTMENTS 256 162 127 -21.6 92 137 99 -27.7 321 371 15.6
NEW WESTMINSTER
DETACHED 49 36 23 -36.1 34 29 21 -27.6 77 79 2.6
ATTACHED 46 22 15 -31.8 28 20 23 15.0 60 62 3.3
APARTMENTS 186 143 127 -11.2 99 113 103 -8.8 283 322 13.8
PORT MOODY/BELCARRA
DETACHED 38 26 32 23.1 23 21 18 -14.3 74 67 -9.5
ATTACHED 35 17 9 -47.1 29 47 8 -83.0 69 86 24.6
APARTMENTS 44 37 35 -5.4 33 22 31 40.9 94 88 -6.4
PORT COQUITLAM
DETACHED 49 43 40 -7.0 39 39 36 -7.7 108 128 18.5
ATTACHED 42 23 22 -4.3 24 24 23 -4.2 90 78 -13.3
APARTMENTS 75 41 52 26.8 39 39 40 2.6 114 134 17.5
RICHMOND
DETACHED 178 175 165 -5.7 99 94 117 24.5 268 365 36.2
ATTACHED 178 124 107 -13.7 95 98 106 8.2 256 321 25.4
APARTMENTS 312 308 265 -14.0 140 236 221 -6.4 437 658 50.6
SUNSHINE COAST
DETACHED 101 95 66 -30.5 105 77 67 -13.0 281 205 -27.0
ATTACHED 15 13 9 -30.8 18 7 11 57.1 36 28 -22.2
APARTMENTS 12 15 21 40.0 11 5 14 180.0 23 27 17.4
SQUAMISH
DETACHED 36 23 14 -39.1 29 14 19 35.7 71 52 -26.8
ATTACHED 26 15 9 -40.0 22 13 17 30.8 65 59 -9.2
APARTMENTS 21 7 14 100.0 17 15 10 -33.3 54 44 -18.5
VANCOUVER EAST
DETACHED 266 140 136 -2.9 118 144 102 -29.2 364 401 10.2
ATTACHED 118 73 75 2.7 56 57 40 -29.8 145 171 17.9
APARTMENTS 342 264 214 -18.9 155 158 155 -1.9 441 534 21.1
VANCOUVER WEST
DETACHED 191 168 182 8.3 91 93 75 -19.4 244 283 16.0
ATTACHED 123 87 90 3.4 56 57 79 38.6 162 210 29.6
APARTMENTS 877 654 627 -4.1 342 419 443 5.7 961 1288 34.0
WHISTLER/PEMBERTON
DETACHED 39 25 21 -16.0 20 24 20 -16.7 65 66 1.5
ATTACHED 38 15 17 13.3 31 24 20 -16.7 86 71 -17.4
APARTMENTS 45 42 38 -9.5 26 38 36 -5.3 71 102 43.7
WEST VANCOUVER/HOWE SOUND
DETACHED 144 117 101 -13.7 49 54 43 -20.4 146 157 7.5
ATTACHED 16 13 6 -53.8 4 8 5 -37.5 10 20 100.0
APARTMENTS 31 27 19 -29.6 11 21 19 -9.5 37 59 59.5
GRAND TOTALS
DETACHED 1837 1346 1224 -9.1 1088 1035 941 -9.1 3060 3234 5.7
ATTACHED 1042 689 638 -7.4 620 609 575 -5.6 1698 1910 12.5
APARTMENTS 2922 2335 2155 -7.7 1332 1665 1630 -2.1 3837 5068 32.1
Residential
Average
Sale
Prices
-
January
1977
to
August
2021
0
500
1000
1500
2000
2500
1
9
7
7
1
9
7
8
1
9
7
9
1
9
8
0
1
9
8
1
1
9
8
2
1
9
8
3
1
9
8
4
1
9
8
5
1
9
8
6
1
9
8
7
1
9
8
8
1
9
8
9
1
9
9
0
1
9
9
1
1
9
9
2
1
9
9
3
1
9
9
4
1
9
9
5
1
9
9
6
1
9
9
7
1
9
9
8
1
9
9
9
2
0
0
0
2
0
0
1
2
0
0
2
2
0
0
3
2
0
0
4
2
0
0
5
2
0
0
6
2
0
0
7
2
0
0
8
2
0
0
9
2
0
1
0
2
0
1
1
2
0
1
2
2
0
1
3
2
0
1
4
2
0
1
5
2
0
1
6
2
0
1
7
2
0
1
8
2
0
1
9
2
0
2
0
2
0
2
1
DETACHED
CONDOMINIUM
ATTACHED
APARTMENTS
IN
THOUSANDS
($)
NOTE:
From
1977
-
1984
condominium
averages
were
not
separated
into
attached
&
apartment.
$1,057,061
$740,221
$1,982,380

More Related Content

What's hot

Rebgv stats-pkg-july-2019
Rebgv stats-pkg-july-2019Rebgv stats-pkg-july-2019
Rebgv stats-pkg-july-2019Vicky Aulakh
Ā 
Rebgv stats-pkg-may-2019
Rebgv stats-pkg-may-2019Rebgv stats-pkg-may-2019
Rebgv stats-pkg-may-2019Kathryn Huang
Ā 
Real Estate Board of Greater Vancouver Statistics Package - November 2021
Real Estate Board of Greater Vancouver Statistics Package - November 2021Real Estate Board of Greater Vancouver Statistics Package - November 2021
Real Estate Board of Greater Vancouver Statistics Package - November 2021VickyAulakh1
Ā 
REBGV Statistics Package August 2020
REBGV Statistics Package August 2020REBGV Statistics Package August 2020
REBGV Statistics Package August 2020Vicky Aulakh
Ā 
REBGV Statistics Package June 2020
REBGV Statistics Package June 2020REBGV Statistics Package June 2020
REBGV Statistics Package June 2020Vicky Aulakh
Ā 
Rebgv stats-pkg-june-2019
Rebgv stats-pkg-june-2019Rebgv stats-pkg-june-2019
Rebgv stats-pkg-june-2019Vicky Aulakh
Ā 
Real Estate Board of Greater Vancouver Statistics Package October 2021
Real Estate Board of Greater Vancouver Statistics Package October 2021Real Estate Board of Greater Vancouver Statistics Package October 2021
Real Estate Board of Greater Vancouver Statistics Package October 2021VickyAulakh1
Ā 
Real Estate Board of Greater Vancouver Statistics Package July 2021
Real Estate Board of Greater Vancouver Statistics Package July 2021Real Estate Board of Greater Vancouver Statistics Package July 2021
Real Estate Board of Greater Vancouver Statistics Package July 2021Vicky Aulakh
Ā 
Rebgv stats-pkg-february-2019
Rebgv stats-pkg-february-2019Rebgv stats-pkg-february-2019
Rebgv stats-pkg-february-2019Kathryn Huang
Ā 
REBGV Statistics Package April 2021
REBGV Statistics Package April 2021REBGV Statistics Package April 2021
REBGV Statistics Package April 2021Vicky Aulakh
Ā 
Rebgv stats-pkg-april-2020
Rebgv stats-pkg-april-2020Rebgv stats-pkg-april-2020
Rebgv stats-pkg-april-2020Vicky Aulakh
Ā 
Rebgv Stats Package September 2020
Rebgv Stats Package September 2020Rebgv Stats Package September 2020
Rebgv Stats Package September 2020Vicky Aulakh
Ā 
REBGV Stats Package February 2021
REBGV Stats Package February 2021REBGV Stats Package February 2021
REBGV Stats Package February 2021Vicky Aulakh
Ā 
Rebgv stats-pkg-november-2019-f
Rebgv stats-pkg-november-2019-fRebgv stats-pkg-november-2019-f
Rebgv stats-pkg-november-2019-fVicky Aulakh
Ā 
Metro Vancouver Statistics Report October 2021
Metro Vancouver Statistics Report October 2021Metro Vancouver Statistics Report October 2021
Metro Vancouver Statistics Report October 2021VickyAulakh1
Ā 
Real Estate Board of Greater Vancouver Statistics Package March 2021
Real Estate Board of Greater Vancouver Statistics Package March 2021Real Estate Board of Greater Vancouver Statistics Package March 2021
Real Estate Board of Greater Vancouver Statistics Package March 2021Vicky Aulakh
Ā 
REBGV Statistics package July 2020
REBGV Statistics package July 2020REBGV Statistics package July 2020
REBGV Statistics package July 2020Vicky Aulakh
Ā 
REBGV Statistics Package October 2020
REBGV Statistics Package October 2020REBGV Statistics Package October 2020
REBGV Statistics Package October 2020Vicky Aulakh
Ā 
Central Okanagan Statistics Package October 2021
Central Okanagan Statistics Package October 2021 Central Okanagan Statistics Package October 2021
Central Okanagan Statistics Package October 2021 VickyAulakh1
Ā 
Rebgv stats-pkg-december-2019
Rebgv stats-pkg-december-2019Rebgv stats-pkg-december-2019
Rebgv stats-pkg-december-2019Vicky Aulakh
Ā 

What's hot (20)

Rebgv stats-pkg-july-2019
Rebgv stats-pkg-july-2019Rebgv stats-pkg-july-2019
Rebgv stats-pkg-july-2019
Ā 
Rebgv stats-pkg-may-2019
Rebgv stats-pkg-may-2019Rebgv stats-pkg-may-2019
Rebgv stats-pkg-may-2019
Ā 
Real Estate Board of Greater Vancouver Statistics Package - November 2021
Real Estate Board of Greater Vancouver Statistics Package - November 2021Real Estate Board of Greater Vancouver Statistics Package - November 2021
Real Estate Board of Greater Vancouver Statistics Package - November 2021
Ā 
REBGV Statistics Package August 2020
REBGV Statistics Package August 2020REBGV Statistics Package August 2020
REBGV Statistics Package August 2020
Ā 
REBGV Statistics Package June 2020
REBGV Statistics Package June 2020REBGV Statistics Package June 2020
REBGV Statistics Package June 2020
Ā 
Rebgv stats-pkg-june-2019
Rebgv stats-pkg-june-2019Rebgv stats-pkg-june-2019
Rebgv stats-pkg-june-2019
Ā 
Real Estate Board of Greater Vancouver Statistics Package October 2021
Real Estate Board of Greater Vancouver Statistics Package October 2021Real Estate Board of Greater Vancouver Statistics Package October 2021
Real Estate Board of Greater Vancouver Statistics Package October 2021
Ā 
Real Estate Board of Greater Vancouver Statistics Package July 2021
Real Estate Board of Greater Vancouver Statistics Package July 2021Real Estate Board of Greater Vancouver Statistics Package July 2021
Real Estate Board of Greater Vancouver Statistics Package July 2021
Ā 
Rebgv stats-pkg-february-2019
Rebgv stats-pkg-february-2019Rebgv stats-pkg-february-2019
Rebgv stats-pkg-february-2019
Ā 
REBGV Statistics Package April 2021
REBGV Statistics Package April 2021REBGV Statistics Package April 2021
REBGV Statistics Package April 2021
Ā 
Rebgv stats-pkg-april-2020
Rebgv stats-pkg-april-2020Rebgv stats-pkg-april-2020
Rebgv stats-pkg-april-2020
Ā 
Rebgv Stats Package September 2020
Rebgv Stats Package September 2020Rebgv Stats Package September 2020
Rebgv Stats Package September 2020
Ā 
REBGV Stats Package February 2021
REBGV Stats Package February 2021REBGV Stats Package February 2021
REBGV Stats Package February 2021
Ā 
Rebgv stats-pkg-november-2019-f
Rebgv stats-pkg-november-2019-fRebgv stats-pkg-november-2019-f
Rebgv stats-pkg-november-2019-f
Ā 
Metro Vancouver Statistics Report October 2021
Metro Vancouver Statistics Report October 2021Metro Vancouver Statistics Report October 2021
Metro Vancouver Statistics Report October 2021
Ā 
Real Estate Board of Greater Vancouver Statistics Package March 2021
Real Estate Board of Greater Vancouver Statistics Package March 2021Real Estate Board of Greater Vancouver Statistics Package March 2021
Real Estate Board of Greater Vancouver Statistics Package March 2021
Ā 
REBGV Statistics package July 2020
REBGV Statistics package July 2020REBGV Statistics package July 2020
REBGV Statistics package July 2020
Ā 
REBGV Statistics Package October 2020
REBGV Statistics Package October 2020REBGV Statistics Package October 2020
REBGV Statistics Package October 2020
Ā 
Central Okanagan Statistics Package October 2021
Central Okanagan Statistics Package October 2021 Central Okanagan Statistics Package October 2021
Central Okanagan Statistics Package October 2021
Ā 
Rebgv stats-pkg-december-2019
Rebgv stats-pkg-december-2019Rebgv stats-pkg-december-2019
Rebgv stats-pkg-december-2019
Ā 

Similar to Real Estate Board of Greater Vancouver Statistics Package August 2021

Real Estate Board of Greater Vancouver - Statistics Package for July 2021
Real Estate Board of Greater Vancouver - Statistics Package for July 2021Real Estate Board of Greater Vancouver - Statistics Package for July 2021
Real Estate Board of Greater Vancouver - Statistics Package for July 2021Alexander Mackenzie, PMP
Ā 
2021 June REBGV Stats Package
2021 June REBGV Stats Package2021 June REBGV Stats Package
2021 June REBGV Stats PackageAlexanderMackenzie13
Ā 
Real Estate Board of Greater Vancouver Statistics Package November 2020
Real Estate Board of Greater Vancouver Statistics Package November 2020Real Estate Board of Greater Vancouver Statistics Package November 2020
Real Estate Board of Greater Vancouver Statistics Package November 2020Vicky Aulakh
Ā 
REBGV-Stats-Pkg-July-2022
REBGV-Stats-Pkg-July-2022REBGV-Stats-Pkg-July-2022
REBGV-Stats-Pkg-July-2022Vicky Aulakh
Ā 
Real Estate Board of Greater Vancouver Statistics Package February 2022
Real Estate Board of Greater Vancouver Statistics Package February 2022Real Estate Board of Greater Vancouver Statistics Package February 2022
Real Estate Board of Greater Vancouver Statistics Package February 2022Vicky Aulakh
Ā 
REBGV Statistic Package December 2020
REBGV Statistic Package December 2020REBGV Statistic Package December 2020
REBGV Statistic Package December 2020Vicky Aulakh
Ā 
Real Estate Board of Greater Vancouver Statistics Package January 2021
Real Estate Board of Greater Vancouver Statistics Package January 2021 Real Estate Board of Greater Vancouver Statistics Package January 2021
Real Estate Board of Greater Vancouver Statistics Package January 2021 Vicky Aulakh
Ā 
Supply response emerges in Metro Vancouverā€™s active housing market
Supply response emerges in Metro Vancouverā€™s active housing marketSupply response emerges in Metro Vancouverā€™s active housing market
Supply response emerges in Metro Vancouverā€™s active housing marketAlexanderMackenzie13
Ā 
Real Estate Board of Greater Vancouver - Stats Package May 2021
Real Estate Board of Greater Vancouver - Stats Package May 2021Real Estate Board of Greater Vancouver - Stats Package May 2021
Real Estate Board of Greater Vancouver - Stats Package May 2021AlexanderMackenzie13
Ā 
Rebgv stats-pkg-may-2021
Rebgv stats-pkg-may-2021Rebgv stats-pkg-may-2021
Rebgv stats-pkg-may-2021BC PRIME Realty
Ā 
Rebgv stats-pkg-february-2018
Rebgv stats-pkg-february-2018Rebgv stats-pkg-february-2018
Rebgv stats-pkg-february-2018Kathryn Huang
Ā 
March 2020 REBGV Statistics Package
March 2020 REBGV Statistics PackageMarch 2020 REBGV Statistics Package
March 2020 REBGV Statistics PackageMike Stewart
Ā 
March 2020-rebgv-stats-pkg
March 2020-rebgv-stats-pkgMarch 2020-rebgv-stats-pkg
March 2020-rebgv-stats-pkgMatt Scalena
Ā 
January 2016 rebgv stats mike stewart realtor Corrected Feb 5 2016
January 2016 rebgv stats mike stewart realtor Corrected Feb 5 2016January 2016 rebgv stats mike stewart realtor Corrected Feb 5 2016
January 2016 rebgv stats mike stewart realtor Corrected Feb 5 2016Mike Stewart
Ā 
October 2016 REBGV Statistics Package Vancouver BC Mike Stewart Realtor
October 2016 REBGV Statistics Package Vancouver BC Mike Stewart RealtorOctober 2016 REBGV Statistics Package Vancouver BC Mike Stewart Realtor
October 2016 REBGV Statistics Package Vancouver BC Mike Stewart RealtorMike Stewart
Ā 
REBGV Statistics Package November 2022
REBGV Statistics Package November 2022REBGV Statistics Package November 2022
REBGV Statistics Package November 2022VickyAulakh1
Ā 

Similar to Real Estate Board of Greater Vancouver Statistics Package August 2021 (18)

Real Estate Board of Greater Vancouver - Statistics Package for July 2021
Real Estate Board of Greater Vancouver - Statistics Package for July 2021Real Estate Board of Greater Vancouver - Statistics Package for July 2021
Real Estate Board of Greater Vancouver - Statistics Package for July 2021
Ā 
2021 June REBGV Stats Package
2021 June REBGV Stats Package2021 June REBGV Stats Package
2021 June REBGV Stats Package
Ā 
Rebgv stats-pkg-november-2020
Rebgv stats-pkg-november-2020Rebgv stats-pkg-november-2020
Rebgv stats-pkg-november-2020
Ā 
Real Estate Board of Greater Vancouver Statistics Package November 2020
Real Estate Board of Greater Vancouver Statistics Package November 2020Real Estate Board of Greater Vancouver Statistics Package November 2020
Real Estate Board of Greater Vancouver Statistics Package November 2020
Ā 
REBGV-Stats-Pkg-July-2022
REBGV-Stats-Pkg-July-2022REBGV-Stats-Pkg-July-2022
REBGV-Stats-Pkg-July-2022
Ā 
Real Estate Board of Greater Vancouver Statistics Package February 2022
Real Estate Board of Greater Vancouver Statistics Package February 2022Real Estate Board of Greater Vancouver Statistics Package February 2022
Real Estate Board of Greater Vancouver Statistics Package February 2022
Ā 
REBGV Statistic Package December 2020
REBGV Statistic Package December 2020REBGV Statistic Package December 2020
REBGV Statistic Package December 2020
Ā 
Real Estate Board of Greater Vancouver Statistics Package January 2021
Real Estate Board of Greater Vancouver Statistics Package January 2021 Real Estate Board of Greater Vancouver Statistics Package January 2021
Real Estate Board of Greater Vancouver Statistics Package January 2021
Ā 
Supply response emerges in Metro Vancouverā€™s active housing market
Supply response emerges in Metro Vancouverā€™s active housing marketSupply response emerges in Metro Vancouverā€™s active housing market
Supply response emerges in Metro Vancouverā€™s active housing market
Ā 
Real Estate Board of Greater Vancouver - Stats Package May 2021
Real Estate Board of Greater Vancouver - Stats Package May 2021Real Estate Board of Greater Vancouver - Stats Package May 2021
Real Estate Board of Greater Vancouver - Stats Package May 2021
Ā 
Rebgv stats-pkg-may-2021
Rebgv stats-pkg-may-2021Rebgv stats-pkg-may-2021
Rebgv stats-pkg-may-2021
Ā 
Rebgv stats-pkg-february-2018
Rebgv stats-pkg-february-2018Rebgv stats-pkg-february-2018
Rebgv stats-pkg-february-2018
Ā 
Rebgv stats-pkg-october-2020
Rebgv stats-pkg-october-2020Rebgv stats-pkg-october-2020
Rebgv stats-pkg-october-2020
Ā 
March 2020 REBGV Statistics Package
March 2020 REBGV Statistics PackageMarch 2020 REBGV Statistics Package
March 2020 REBGV Statistics Package
Ā 
March 2020-rebgv-stats-pkg
March 2020-rebgv-stats-pkgMarch 2020-rebgv-stats-pkg
March 2020-rebgv-stats-pkg
Ā 
January 2016 rebgv stats mike stewart realtor Corrected Feb 5 2016
January 2016 rebgv stats mike stewart realtor Corrected Feb 5 2016January 2016 rebgv stats mike stewart realtor Corrected Feb 5 2016
January 2016 rebgv stats mike stewart realtor Corrected Feb 5 2016
Ā 
October 2016 REBGV Statistics Package Vancouver BC Mike Stewart Realtor
October 2016 REBGV Statistics Package Vancouver BC Mike Stewart RealtorOctober 2016 REBGV Statistics Package Vancouver BC Mike Stewart Realtor
October 2016 REBGV Statistics Package Vancouver BC Mike Stewart Realtor
Ā 
REBGV Statistics Package November 2022
REBGV Statistics Package November 2022REBGV Statistics Package November 2022
REBGV Statistics Package November 2022
Ā 

More from Vicky Aulakh

Okanagan Statistics May2023.pdf
Okanagan Statistics May2023.pdfOkanagan Statistics May2023.pdf
Okanagan Statistics May2023.pdfVicky Aulakh
Ā 
FVREB May 2023 Statistics Package.pdf
FVREB May 2023 Statistics Package.pdfFVREB May 2023 Statistics Package.pdf
FVREB May 2023 Statistics Package.pdfVicky Aulakh
Ā 
Metro Vancouver Stats.pdf
Metro Vancouver Stats.pdfMetro Vancouver Stats.pdf
Metro Vancouver Stats.pdfVicky Aulakh
Ā 
FVREB July 2022
FVREB July 2022FVREB July 2022
FVREB July 2022Vicky Aulakh
Ā 
VREB July 2022
VREB July 2022VREB July 2022
VREB July 2022Vicky Aulakh
Ā 
BCRE June 2022
BCRE June 2022BCRE June 2022
BCRE June 2022Vicky Aulakh
Ā 
Okanagan Stats June 2022
Okanagan Stats June 2022Okanagan Stats June 2022
Okanagan Stats June 2022Vicky Aulakh
Ā 
Okanagan Stats May 2022
Okanagan Stats May 2022Okanagan Stats May 2022
Okanagan Stats May 2022Vicky Aulakh
Ā 
VREB June 2022 Stats
VREB June 2022 StatsVREB June 2022 Stats
VREB June 2022 StatsVicky Aulakh
Ā 
FVREB June 2022 Stats
FVREB June 2022 StatsFVREB June 2022 Stats
FVREB June 2022 StatsVicky Aulakh
Ā 
FVREB May 2022
FVREB May 2022FVREB May 2022
FVREB May 2022Vicky Aulakh
Ā 
REBGV Statistics Package May 2022
REBGV Statistics Package May 2022REBGV Statistics Package May 2022
REBGV Statistics Package May 2022Vicky Aulakh
Ā 
VREB May 2022 Statistics Package.pdf
VREB May 2022 Statistics Package.pdfVREB May 2022 Statistics Package.pdf
VREB May 2022 Statistics Package.pdfVicky Aulakh
Ā 
The Okanagan Real Estate April 2022 Statistics
The Okanagan Real Estate April 2022 StatisticsThe Okanagan Real Estate April 2022 Statistics
The Okanagan Real Estate April 2022 StatisticsVicky Aulakh
Ā 
FVREB April 2022 Stats Package .pdf
FVREB April 2022 Stats Package .pdfFVREB April 2022 Stats Package .pdf
FVREB April 2022 Stats Package .pdfVicky Aulakh
Ā 
VREB April 2022 Stats Package .pdf
VREB April 2022 Stats Package .pdfVREB April 2022 Stats Package .pdf
VREB April 2022 Stats Package .pdfVicky Aulakh
Ā 
REBGV-Stats-Pkg-April-2022.pdf
REBGV-Stats-Pkg-April-2022.pdfREBGV-Stats-Pkg-April-2022.pdf
REBGV-Stats-Pkg-April-2022.pdfVicky Aulakh
Ā 
March 2022 Okanagan Statistics
March 2022 Okanagan StatisticsMarch 2022 Okanagan Statistics
March 2022 Okanagan StatisticsVicky Aulakh
Ā 
FVREB Statistics Package March 2022
FVREB Statistics Package March 2022FVREB Statistics Package March 2022
FVREB Statistics Package March 2022Vicky Aulakh
Ā 

More from Vicky Aulakh (20)

Okanagan Statistics May2023.pdf
Okanagan Statistics May2023.pdfOkanagan Statistics May2023.pdf
Okanagan Statistics May2023.pdf
Ā 
FVREB May 2023 Statistics Package.pdf
FVREB May 2023 Statistics Package.pdfFVREB May 2023 Statistics Package.pdf
FVREB May 2023 Statistics Package.pdf
Ā 
Metro Vancouver Stats.pdf
Metro Vancouver Stats.pdfMetro Vancouver Stats.pdf
Metro Vancouver Stats.pdf
Ā 
FVREB July 2022
FVREB July 2022FVREB July 2022
FVREB July 2022
Ā 
VREB July 2022
VREB July 2022VREB July 2022
VREB July 2022
Ā 
BCRE June 2022
BCRE June 2022BCRE June 2022
BCRE June 2022
Ā 
Okanagan Stats June 2022
Okanagan Stats June 2022Okanagan Stats June 2022
Okanagan Stats June 2022
Ā 
Okanagan Stats May 2022
Okanagan Stats May 2022Okanagan Stats May 2022
Okanagan Stats May 2022
Ā 
VREB June 2022 Stats
VREB June 2022 StatsVREB June 2022 Stats
VREB June 2022 Stats
Ā 
FVREB June 2022 Stats
FVREB June 2022 StatsFVREB June 2022 Stats
FVREB June 2022 Stats
Ā 
FVREB May 2022
FVREB May 2022FVREB May 2022
FVREB May 2022
Ā 
REBGV Statistics Package May 2022
REBGV Statistics Package May 2022REBGV Statistics Package May 2022
REBGV Statistics Package May 2022
Ā 
VREB May 2022 Statistics Package.pdf
VREB May 2022 Statistics Package.pdfVREB May 2022 Statistics Package.pdf
VREB May 2022 Statistics Package.pdf
Ā 
The Okanagan Real Estate April 2022 Statistics
The Okanagan Real Estate April 2022 StatisticsThe Okanagan Real Estate April 2022 Statistics
The Okanagan Real Estate April 2022 Statistics
Ā 
FVREB April 2022 Stats Package .pdf
FVREB April 2022 Stats Package .pdfFVREB April 2022 Stats Package .pdf
FVREB April 2022 Stats Package .pdf
Ā 
VREB April 2022 Stats Package .pdf
VREB April 2022 Stats Package .pdfVREB April 2022 Stats Package .pdf
VREB April 2022 Stats Package .pdf
Ā 
REBGV-Stats-Pkg-April-2022.pdf
REBGV-Stats-Pkg-April-2022.pdfREBGV-Stats-Pkg-April-2022.pdf
REBGV-Stats-Pkg-April-2022.pdf
Ā 
BCREA.pdf
BCREA.pdfBCREA.pdf
BCREA.pdf
Ā 
March 2022 Okanagan Statistics
March 2022 Okanagan StatisticsMarch 2022 Okanagan Statistics
March 2022 Okanagan Statistics
Ā 
FVREB Statistics Package March 2022
FVREB Statistics Package March 2022FVREB Statistics Package March 2022
FVREB Statistics Package March 2022
Ā 

Recently uploaded

Low Rate Call Girls in Triveni Complex Delhi Call 9990771857
Low Rate Call Girls in Triveni Complex Delhi Call 9990771857Low Rate Call Girls in Triveni Complex Delhi Call 9990771857
Low Rate Call Girls in Triveni Complex Delhi Call 9990771857delhimodel235
Ā 
9990771857 Call Girls in Noida Sector 06 Noida (Call Girls) Delhi
9990771857 Call Girls in Noida Sector 06 Noida (Call Girls) Delhi9990771857 Call Girls in Noida Sector 06 Noida (Call Girls) Delhi
9990771857 Call Girls in Noida Sector 06 Noida (Call Girls) Delhidelhimodel235
Ā 
Low Rate Call Girls in Akshardham Delhi Call 9990771857
Low Rate Call Girls in Akshardham   Delhi Call 9990771857Low Rate Call Girls in Akshardham   Delhi Call 9990771857
Low Rate Call Girls in Akshardham Delhi Call 9990771857delhimodel235
Ā 
Call Girls in Noida Sector 12 Noida šŸ’ÆCall Us šŸ” 9582086666 šŸ” South Delhi Escor...
Call Girls in Noida Sector 12 Noida šŸ’ÆCall Us šŸ” 9582086666 šŸ” South Delhi Escor...Call Girls in Noida Sector 12 Noida šŸ’ÆCall Us šŸ” 9582086666 šŸ” South Delhi Escor...
Call Girls in Noida Sector 12 Noida šŸ’ÆCall Us šŸ” 9582086666 šŸ” South Delhi Escor...delhimodel235
Ā 
Call Girls In Madipur Metro Delhiź§ +91)8447779280ź§‚Low Rate 2 short 2000 full ...
Call Girls In Madipur Metro Delhiź§ +91)8447779280ź§‚Low Rate 2 short 2000 full ...Call Girls In Madipur Metro Delhiź§ +91)8447779280ź§‚Low Rate 2 short 2000 full ...
Call Girls In Madipur Metro Delhiź§ +91)8447779280ź§‚Low Rate 2 short 2000 full ...asmaqueen5
Ā 
Call Girls in Nehru Place Delhi šŸ’ÆCall Us šŸ”8264348440šŸ”
Call Girls in Nehru Place Delhi šŸ’ÆCall Us šŸ”8264348440šŸ”Call Girls in Nehru Place Delhi šŸ’ÆCall Us šŸ”8264348440šŸ”
Call Girls in Nehru Place Delhi šŸ’ÆCall Us šŸ”8264348440šŸ”soniya singh
Ā 
9990771857 Call Girls in Noida Sector 11 Noida (Call Girls) Delhi
9990771857 Call Girls in Noida Sector 11 Noida (Call Girls) Delhi9990771857 Call Girls in Noida Sector 11 Noida (Call Girls) Delhi
9990771857 Call Girls in Noida Sector 11 Noida (Call Girls) Delhidelhimodel235
Ā 
Purva Palm Hills Devanahalli, Bangalore E- Brochure.pdf
Purva Palm Hills Devanahalli, Bangalore E- Brochure.pdfPurva Palm Hills Devanahalli, Bangalore E- Brochure.pdf
Purva Palm Hills Devanahalli, Bangalore E- Brochure.pdffaheemali990101
Ā 
9990771857 Call Girls in Noida Sector 34 Noida (Call Girls) Delhi
9990771857 Call Girls in Noida Sector 34 Noida (Call Girls) Delhi9990771857 Call Girls in Noida Sector 34 Noida (Call Girls) Delhi
9990771857 Call Girls in Noida Sector 34 Noida (Call Girls) Delhidelhimodel235
Ā 
Building Dreams: Newman Leech's Visionary Approach to Real Estate Investment
Building Dreams: Newman Leech's Visionary Approach to Real Estate InvestmentBuilding Dreams: Newman Leech's Visionary Approach to Real Estate Investment
Building Dreams: Newman Leech's Visionary Approach to Real Estate InvestmentNewman George Leech
Ā 
Call Girls in Janakpuri ā†«8447779280ā†«Short 1500 Night 6000-Escorts Service In ...
Call Girls in Janakpuri ā†«8447779280ā†«Short 1500 Night 6000-Escorts Service In ...Call Girls in Janakpuri ā†«8447779280ā†«Short 1500 Night 6000-Escorts Service In ...
Call Girls in Janakpuri ā†«8447779280ā†«Short 1500 Night 6000-Escorts Service In ...asmaqueen5
Ā 
SSPL The Strand Abodes Kharadi Pune Brochure.pdf
SSPL The Strand Abodes Kharadi Pune Brochure.pdfSSPL The Strand Abodes Kharadi Pune Brochure.pdf
SSPL The Strand Abodes Kharadi Pune Brochure.pdfabbu831446
Ā 
Call Girls in Inderpuri Delhi šŸ’ÆCall Us šŸ”8264348440šŸ”
Call Girls in Inderpuri Delhi šŸ’ÆCall Us šŸ”8264348440šŸ”Call Girls in Inderpuri Delhi šŸ’ÆCall Us šŸ”8264348440šŸ”
Call Girls in Inderpuri Delhi šŸ’ÆCall Us šŸ”8264348440šŸ”soniya singh
Ā 
How to Build Multifamily and Laneway Suites in Toronto!! (feat. Expert Archi...
How to Build Multifamily and Laneway Suites  in Toronto!! (feat. Expert Archi...How to Build Multifamily and Laneway Suites  in Toronto!! (feat. Expert Archi...
How to Build Multifamily and Laneway Suites in Toronto!! (feat. Expert Archi...Volition Properties
Ā 
Call Girls Janta Market {Delhi//8447779280)) ā‚¹ā†¬Short 2000 Full Night 5500 ā†«Es...
Call Girls Janta Market {Delhi//8447779280)) ā‚¹ā†¬Short 2000 Full Night 5500 ā†«Es...Call Girls Janta Market {Delhi//8447779280)) ā‚¹ā†¬Short 2000 Full Night 5500 ā†«Es...
Call Girls Janta Market {Delhi//8447779280)) ā‚¹ā†¬Short 2000 Full Night 5500 ā†«Es...asmaqueen5
Ā 
Low Rate Call Girls in Trilokpuri Delhi Call 9990771857
Low Rate Call Girls in Trilokpuri Delhi Call 9990771857Low Rate Call Girls in Trilokpuri Delhi Call 9990771857
Low Rate Call Girls in Trilokpuri Delhi Call 9990771857delhimodel235
Ā 
Call Girls in Kashmiri Gate Delhi šŸ’ÆCall Us šŸ”8264348440šŸ”
Call Girls in Kashmiri Gate Delhi šŸ’ÆCall Us šŸ”8264348440šŸ”Call Girls in Kashmiri Gate Delhi šŸ’ÆCall Us šŸ”8264348440šŸ”
Call Girls in Kashmiri Gate Delhi šŸ’ÆCall Us šŸ”8264348440šŸ”soniya singh
Ā 
Nanke Area Estate commercial ( Dir. Kat Kuo)
Nanke Area Estate commercial ( Dir. Kat Kuo)Nanke Area Estate commercial ( Dir. Kat Kuo)
Nanke Area Estate commercial ( Dir. Kat Kuo)jessica288382
Ā 
83770-87607 ŪžCall Girls In Near The Park Hotel (Cp) Delhi
83770-87607 ŪžCall Girls In Near The Park Hotel (Cp) Delhi83770-87607 ŪžCall Girls In Near The Park Hotel (Cp) Delhi
83770-87607 ŪžCall Girls In Near The Park Hotel (Cp) Delhidollysharma2066
Ā 
Call Girls in Pitampura Delhi šŸ’ÆCall Us šŸ”8264348440šŸ”
Call Girls in Pitampura Delhi šŸ’ÆCall Us šŸ”8264348440šŸ”Call Girls in Pitampura Delhi šŸ’ÆCall Us šŸ”8264348440šŸ”
Call Girls in Pitampura Delhi šŸ’ÆCall Us šŸ”8264348440šŸ”soniya singh
Ā 

Recently uploaded (20)

Low Rate Call Girls in Triveni Complex Delhi Call 9990771857
Low Rate Call Girls in Triveni Complex Delhi Call 9990771857Low Rate Call Girls in Triveni Complex Delhi Call 9990771857
Low Rate Call Girls in Triveni Complex Delhi Call 9990771857
Ā 
9990771857 Call Girls in Noida Sector 06 Noida (Call Girls) Delhi
9990771857 Call Girls in Noida Sector 06 Noida (Call Girls) Delhi9990771857 Call Girls in Noida Sector 06 Noida (Call Girls) Delhi
9990771857 Call Girls in Noida Sector 06 Noida (Call Girls) Delhi
Ā 
Low Rate Call Girls in Akshardham Delhi Call 9990771857
Low Rate Call Girls in Akshardham   Delhi Call 9990771857Low Rate Call Girls in Akshardham   Delhi Call 9990771857
Low Rate Call Girls in Akshardham Delhi Call 9990771857
Ā 
Call Girls in Noida Sector 12 Noida šŸ’ÆCall Us šŸ” 9582086666 šŸ” South Delhi Escor...
Call Girls in Noida Sector 12 Noida šŸ’ÆCall Us šŸ” 9582086666 šŸ” South Delhi Escor...Call Girls in Noida Sector 12 Noida šŸ’ÆCall Us šŸ” 9582086666 šŸ” South Delhi Escor...
Call Girls in Noida Sector 12 Noida šŸ’ÆCall Us šŸ” 9582086666 šŸ” South Delhi Escor...
Ā 
Call Girls In Madipur Metro Delhiź§ +91)8447779280ź§‚Low Rate 2 short 2000 full ...
Call Girls In Madipur Metro Delhiź§ +91)8447779280ź§‚Low Rate 2 short 2000 full ...Call Girls In Madipur Metro Delhiź§ +91)8447779280ź§‚Low Rate 2 short 2000 full ...
Call Girls In Madipur Metro Delhiź§ +91)8447779280ź§‚Low Rate 2 short 2000 full ...
Ā 
Call Girls in Nehru Place Delhi šŸ’ÆCall Us šŸ”8264348440šŸ”
Call Girls in Nehru Place Delhi šŸ’ÆCall Us šŸ”8264348440šŸ”Call Girls in Nehru Place Delhi šŸ’ÆCall Us šŸ”8264348440šŸ”
Call Girls in Nehru Place Delhi šŸ’ÆCall Us šŸ”8264348440šŸ”
Ā 
9990771857 Call Girls in Noida Sector 11 Noida (Call Girls) Delhi
9990771857 Call Girls in Noida Sector 11 Noida (Call Girls) Delhi9990771857 Call Girls in Noida Sector 11 Noida (Call Girls) Delhi
9990771857 Call Girls in Noida Sector 11 Noida (Call Girls) Delhi
Ā 
Purva Palm Hills Devanahalli, Bangalore E- Brochure.pdf
Purva Palm Hills Devanahalli, Bangalore E- Brochure.pdfPurva Palm Hills Devanahalli, Bangalore E- Brochure.pdf
Purva Palm Hills Devanahalli, Bangalore E- Brochure.pdf
Ā 
9990771857 Call Girls in Noida Sector 34 Noida (Call Girls) Delhi
9990771857 Call Girls in Noida Sector 34 Noida (Call Girls) Delhi9990771857 Call Girls in Noida Sector 34 Noida (Call Girls) Delhi
9990771857 Call Girls in Noida Sector 34 Noida (Call Girls) Delhi
Ā 
Building Dreams: Newman Leech's Visionary Approach to Real Estate Investment
Building Dreams: Newman Leech's Visionary Approach to Real Estate InvestmentBuilding Dreams: Newman Leech's Visionary Approach to Real Estate Investment
Building Dreams: Newman Leech's Visionary Approach to Real Estate Investment
Ā 
Call Girls in Janakpuri ā†«8447779280ā†«Short 1500 Night 6000-Escorts Service In ...
Call Girls in Janakpuri ā†«8447779280ā†«Short 1500 Night 6000-Escorts Service In ...Call Girls in Janakpuri ā†«8447779280ā†«Short 1500 Night 6000-Escorts Service In ...
Call Girls in Janakpuri ā†«8447779280ā†«Short 1500 Night 6000-Escorts Service In ...
Ā 
SSPL The Strand Abodes Kharadi Pune Brochure.pdf
SSPL The Strand Abodes Kharadi Pune Brochure.pdfSSPL The Strand Abodes Kharadi Pune Brochure.pdf
SSPL The Strand Abodes Kharadi Pune Brochure.pdf
Ā 
Call Girls in Inderpuri Delhi šŸ’ÆCall Us šŸ”8264348440šŸ”
Call Girls in Inderpuri Delhi šŸ’ÆCall Us šŸ”8264348440šŸ”Call Girls in Inderpuri Delhi šŸ’ÆCall Us šŸ”8264348440šŸ”
Call Girls in Inderpuri Delhi šŸ’ÆCall Us šŸ”8264348440šŸ”
Ā 
How to Build Multifamily and Laneway Suites in Toronto!! (feat. Expert Archi...
How to Build Multifamily and Laneway Suites  in Toronto!! (feat. Expert Archi...How to Build Multifamily and Laneway Suites  in Toronto!! (feat. Expert Archi...
How to Build Multifamily and Laneway Suites in Toronto!! (feat. Expert Archi...
Ā 
Call Girls Janta Market {Delhi//8447779280)) ā‚¹ā†¬Short 2000 Full Night 5500 ā†«Es...
Call Girls Janta Market {Delhi//8447779280)) ā‚¹ā†¬Short 2000 Full Night 5500 ā†«Es...Call Girls Janta Market {Delhi//8447779280)) ā‚¹ā†¬Short 2000 Full Night 5500 ā†«Es...
Call Girls Janta Market {Delhi//8447779280)) ā‚¹ā†¬Short 2000 Full Night 5500 ā†«Es...
Ā 
Low Rate Call Girls in Trilokpuri Delhi Call 9990771857
Low Rate Call Girls in Trilokpuri Delhi Call 9990771857Low Rate Call Girls in Trilokpuri Delhi Call 9990771857
Low Rate Call Girls in Trilokpuri Delhi Call 9990771857
Ā 
Call Girls in Kashmiri Gate Delhi šŸ’ÆCall Us šŸ”8264348440šŸ”
Call Girls in Kashmiri Gate Delhi šŸ’ÆCall Us šŸ”8264348440šŸ”Call Girls in Kashmiri Gate Delhi šŸ’ÆCall Us šŸ”8264348440šŸ”
Call Girls in Kashmiri Gate Delhi šŸ’ÆCall Us šŸ”8264348440šŸ”
Ā 
Nanke Area Estate commercial ( Dir. Kat Kuo)
Nanke Area Estate commercial ( Dir. Kat Kuo)Nanke Area Estate commercial ( Dir. Kat Kuo)
Nanke Area Estate commercial ( Dir. Kat Kuo)
Ā 
83770-87607 ŪžCall Girls In Near The Park Hotel (Cp) Delhi
83770-87607 ŪžCall Girls In Near The Park Hotel (Cp) Delhi83770-87607 ŪžCall Girls In Near The Park Hotel (Cp) Delhi
83770-87607 ŪžCall Girls In Near The Park Hotel (Cp) Delhi
Ā 
Call Girls in Pitampura Delhi šŸ’ÆCall Us šŸ”8264348440šŸ”
Call Girls in Pitampura Delhi šŸ’ÆCall Us šŸ”8264348440šŸ”Call Girls in Pitampura Delhi šŸ’ÆCall Us šŸ”8264348440šŸ”
Call Girls in Pitampura Delhi šŸ’ÆCall Us šŸ”8264348440šŸ”
Ā 

Real Estate Board of Greater Vancouver Statistics Package August 2021