
Recommended
Recommended
More Related Content
What's hot
What's hot (20)
Similar to Real Estate Board of Greater Vancouver Statistics Package October 2021
Similar to Real Estate Board of Greater Vancouver Statistics Package October 2021 (18)
More from VickyAulakh1
More from VickyAulakh1 (20)
Recently uploaded
Recently uploaded (20)
Real Estate Board of Greater Vancouver Statistics Package October 2021
- 1. News Release FOR IMMEDIATE RELEASE: Metro Vancouver home buyers compete for fewer home listings in October VANCOUVER, BC – November 2, 2021 – Home sale activity in Metro Vancouver* remained above historical averages in October while the overall supply of homes for sale dipped to levels not seen in three years. The Real Estate Board of Greater Vancouver (REBGV) reports that residential home sales in the region totalled 3,494 in October 2021, a 5.2 per cent decrease from the 3,687 sales recorded in October 2020, and an 11 per cent increase from the 3,149 homes sold in September 2021. Last month’s sales were 22.4 per cent above the 10-year October sales average. “Home sale activity continues to outpace what’s typical for this time of year and the pool of homes available for sale is in decline. This dynamic between supply and demand is causing home prices to continue to edge up across the region,” Keith Stewart, REBGV economist said. There were 4,049 detached, attached and apartment properties newly listed for sale on the Multiple Listing Service® (MLS®) in Metro Vancouver in October 2021. This represents a 27.3 per cent decrease compared to the 5,571 homes listed in October 2020 and a 21.7 per cent decrease compared to September 2021 when 5,171 homes were listed. The total number of homes currently listed for sale on the MLS® system in Metro Vancouver is 8,034, a 35.3 per cent decrease compared to October 2020 (12,416) and a 13 per cent decrease compared to September 2021 (9,236). “Rising fixed mortgage rates should eventually help ease demand, but for now sales remain strong and buyers with rate holds will remain motivated to find a property for the rest of the year,” Stewart said. For all property types, the sales-to-active listings ratio for October 2021 is 43.5 per cent. By property type, the ratio is 33.6 per cent for detached homes, 64.4 per cent for townhomes, and 46.7 per cent for apartments. Generally, analysts say downward pressure on home prices occurs when the ratio dips below 12 per cent for a sustained period, while home prices often experience upward pressure when it surpasses 20 per cent over several months. The MLS® Home Price Index composite benchmark price for all residential homes in Metro Vancouver is $1,199,400. This represents a 14.7 per cent increase over October 2020 and a 1.1 per cent increase compared to September 2021.
- 2. Sales of detached homes in October 2021 reached 1,090, an 18.4 per cent decrease from the 1,335 detached sales recorded in October 2020. The benchmark price for a detached home is $1,850,500. This represents a 20.5 per cent increase from October 2020 and a 1.2 per cent increase compared to September 2021. Sales of apartment homes reached 1,801 in October 2021, a 14.7 per cent increase compared to the 1,570 sales in October 2020. The benchmark price of an apartment home is $746,400. This represents a 9.5 per cent increase from October 2020 and a 1.1 per cent increase compared to September 2021. Attached home sales in October 2021 totalled 603, a 22.9 per cent decrease compared to the 782 sales in October 2020. The benchmark price of an attached home is $975,000. This represents an 18.5 per cent increase from October 2020 and a 1.2 per cent increase compared to September 2021. -30- *Editor’s Note: Areas covered by the Real Estate Board of Greater Vancouver include: Burnaby, Coquitlam, Maple Ridge, New Westminster, North Vancouver, Pitt Meadows, Port Coquitlam, Port Moody, Richmond, South Delta, Squamish, Sunshine Coast, Vancouver, West Vancouver, and Whistler. The real estate industry is a key economic driver in British Columbia. In 2020, 30,944 homes changed ownership in the Board’s area, generating $2.1 billion in economic spin-off activity and an estimated 14,728 jobs. The total dollar value of residential sales transacted through the MLS® system in Greater Vancouver totalled $33.7 billion in 2020. The Real Estate Board of Greater Vancouver is an association representing more than 14,000 REALTORS® and their companies. The Board provides a variety of member services, including the Multiple Listing Service®. For more information on real estate, statistics, and buying or selling a home, contact a local REALTOR® or visit www.rebgv.org. For more information please contact: Craig Munn Director, Communication Real Estate Board of Greater Vancouver 604.730.3146 cmunn@rebgv.org
- 3. Property Type Area Benchmark Price Price Index 1 Month Change % 3 Month Change % 6 Month Change % 1 Year Change % 3 Year Change % 5 Year Change % 10 Year Change % Residential / Composite Lower Mainland $1,183,600 329.7 1.5% 3.2% 5.6% 19.2% 19.8% 41.1% 111.8% Greater Vancouver $1,199,400 315.7 1.1% 2.0% 3.8% 14.7% 14.1% 30.4% 95.6% Bowen Island $1,449,700 314.3 1.7% 3.0% 6.6% 27.2% 49.7% 82.8% 142.9% Burnaby East $1,099,600 313.5 1.3% 2.3% 4.2% 10.8% 9.5% 27.0% 96.2% Burnaby North $1,122,900 302.5 0.8% 1.4% 3.8% 11.7% 9.3% 27.0% 91.5% Burnaby South $1,057,200 300.1 0.3% 1.3% 2.6% 9.2% 4.4% 23.3% 80.6% Coquitlam $1,122,700 333.7 1.6% 2.6% 4.8% 17.6% 18.8% 43.2% 124.7% Ladner $1,074,900 304.6 2.6% 5.1% 6.2% 23.3% 24.4% 29.9% 93.4% Maple Ridge $1,040,100 331.2 2.0% 4.3% 7.4% 29.3% 32.3% 67.0% 150.2% New Westminster $734,200 325.7 0.6% 1.8% 4.7% 10.8% 6.5% 43.9% 104.6% North Vancouver $1,245,600 286.2 0.5% 1.6% 3.3% 12.6% 16.4% 24.9% 97.0% Pitt Meadows $943,100 344.6 1.9% 3.6% 6.3% 22.9% 22.6% 61.9% 145.8% Port Coquitlam $949,700 325.1 1.7% 2.6% 4.0% 20.2% 23.9% 51.8% 126.2% Port Moody $1,070,000 300.9 0.4% 1.6% 3.0% 16.2% 13.3% 41.2% 122.6% Richmond $1,105,100 330.0 0.7% 2.4% 4.0% 14.7% 11.9% 26.7% 88.7% Squamish $1,081,600 335.3 5.5% 6.5% 9.4% 26.8% 34.7% 66.7% 170.2% Sunshine Coast $852,600 314.4 2.5% 5.9% 8.2% 31.1% 42.8% 77.6% 145.4% Tsawwassen $1,196,600 303.1 3.1% 4.4% 7.4% 20.7% 20.5% 24.7% 95.5% Vancouver East $1,216,600 361.5 0.6% 1.4% 1.8% 11.0% 11.2% 25.1% 100.4% Vancouver West $1,365,300 285.1 0.4% -0.5% 0.5% 7.1% 3.1% 10.7% 65.5% West Vancouver $2,576,600 283.7 0.8% 1.7% 3.9% 13.7% 12.0% -0.9% 69.6% Whistler $1,377,500 308.0 5.3% 6.5% 10.1% 29.6% 40.3% 83.0% 168.5% Single Family Detached Lower Mainland $1,669,400 355.7 1.8% 4.2% 6.2% 26.4% 30.7% 36.8% 120.1% Greater Vancouver $1,850,500 341.0 1.2% 2.7% 4.5% 20.5% 22.0% 21.6% 95.4% Bowen Island $1,449,700 314.3 1.7% 3.0% 6.6% 27.1% 49.7% 82.8% 142.9% Burnaby East $1,501,700 335.8 0.8% 4.9% 4.6% 17.2% 20.1% 27.1% 109.7% Burnaby North $1,743,700 337.2 -0.2% -0.2% 2.0% 16.1% 17.2% 12.6% 93.2% Burnaby South $1,816,300 347.7 0.2% 2.4% 5.1% 16.1% 11.5% 9.6% 87.7% Coquitlam $1,538,700 341.5 1.5% 2.2% 4.1% 21.9% 22.9% 28.6% 123.3% Ladner $1,341,200 321.0 2.0% 6.2% 5.6% 28.7% 40.2% 32.3% 108.3% Maple Ridge $1,176,600 335.2 2.3% 4.1% 7.1% 33.1% 37.9% 64.6% 156.7% New Westminster $1,364,600 340.4 1.3% 4.9% 6.0% 21.1% 21.7% 32.2% 106.3% North Vancouver $1,939,500 305.4 1.4% 2.3% 3.1% 16.5% 23.4% 16.9% 106.5% Pitt Meadows $1,268,000 357.3 4.6% 6.2% 8.7% 30.1% 39.6% 60.0% 152.9% Port Coquitlam $1,289,000 343.7 1.9% 3.9% 3.2% 24.6% 32.1% 46.4% 136.4% Port Moody $1,878,400 346.9 1.0% 0.8% 3.6% 23.9% 26.1% 36.4% 134.4% Richmond $1,950,600 374.0 0.0% 2.1% 3.3% 17.2% 15.0% 10.4% 80.1% Squamish $1,436,100 352.0 5.1% 5.6% 6.4% 26.8% 43.7% 69.3% 174.8% Sunshine Coast $882,900 309.3 1.7% 5.9% 7.4% 31.4% 47.7% 82.5% 138.7% Tsawwassen $1,460,700 318.9 3.6% 6.2% 8.7% 26.3% 29.5% 28.0% 106.8% Vancouver East $1,717,400 378.3 0.6% 1.5% 2.1% 13.9% 16.9% 19.4% 106.4% Vancouver West $3,450,400 349.0 -1.3% -0.5% 2.6% 10.7% 4.7% -2.3% 51.4% West Vancouver $3,201,200 302.2 1.9% 2.5% 5.9% 16.7% 16.1% -2.2% 76.7% Whistler $2,626,200 331.5 6.2% 6.6% 8.7% 32.0% 54.9% 80.2% 166.1% HOW TO READ THE TABLE: • Benchmark Price: Estimated sale price of a benchmark property. Benchmarks represent a typical property within each market. • Price Index: Index numbers estimate the percentage change in price on typical and constant quality properties over time. All figures are based on past sales. • x Month/Year Change %: Percentage change of index over a period of x month(s)/year(s) * In January 2005, the indexes are set to 100. Townhome properties are similar to Attached properties, a category that was used in the previous MLSLink HPI, but do not included duplexes. The above info is deemed reliable, but is not guaranteed. All dollar amounts in CDN. October 2021 * * MLS®, Multiple Listing Service®, and all related graphics are trademarks of The Canadian Real Estate Association 1 of 18
- 4. Property Type Area Benchmark Price Price Index 1 Month Change % 3 Month Change % 6 Month Change % 1 Year Change % 3 Year Change % 5 Year Change % 10 Year Change % October 2021 * Townhouse Lower Mainland $873,200 314.7 1.5% 3.7% 8.2% 22.0% 22.0% 52.0% 112.6% Greater Vancouver $975,000 312.8 1.2% 2.7% 6.0% 18.5% 17.3% 43.1% 102.2% Burnaby East $693,200 311.0 1.0% -1.0% 1.7% 2.6% 2.2% 36.6% 94.9% Burnaby North $841,500 314.1 1.0% 1.3% 5.5% 12.7% 10.6% 40.6% 93.8% Burnaby South $763,700 319.4 1.7% 1.0% 3.5% 8.8% 7.7% 34.4% 91.0% Coquitlam $878,100 322.1 1.7% 3.6% 6.8% 20.9% 23.7% 55.4% 121.8% Ladner $799,000 295.7 3.2% 5.9% 6.3% 20.3% 8.2% 33.0% 77.9% Maple Ridge $712,300 330.7 1.3% 3.5% 7.2% 28.6% 28.8% 70.0% 147.2% New Westminster $864,300 330.1 1.9% 3.6% 7.3% 16.7% 13.8% 48.9% 105.4% North Vancouver $1,175,300 290.6 1.9% 4.4% 8.0% 16.7% 21.2% 38.5% 98.2% Pitt Meadows $751,300 325.1 -1.0% -0.2% 4.7% 21.4% 13.5% 58.4% 137.1% Port Coquitlam $812,800 307.7 -0.2% 2.2% 4.9% 22.7% 25.7% 47.0% 115.6% Port Moody $761,900 259.1 -0.3% 0.1% 3.0% 14.8% 9.2% 42.9% 86.8% Richmond $961,200 315.9 1.1% 3.1% 7.0% 16.6% 12.4% 35.1% 87.7% Squamish $903,400 305.0 2.6% 1.6% 6.0% 25.6% 22.5% 57.8% 153.1% Sunshine Coast $617,700 295.9 2.2% 1.0% 5.8% 30.2% 27.1% 53.9% 144.3% Tsawwassen $879,500 289.5 2.7% 5.0% 4.6% 14.3% -3.9% 20.8% 71.6% Vancouver East $1,053,700 335.1 0.6% 5.9% 5.1% 16.8% 20.2% 36.6% 101.4% Vancouver West $1,300,300 304.0 0.6% 0.7% 4.6% 12.3% 12.0% 22.7% 88.6% Whistler $1,308,100 320.3 1.7% 1.1% 6.1% 27.5% 28.7% 78.3% 180.2% Apartment Lower Mainland $744,200 314.3 1.3% 2.1% 3.9% 11.9% 9.9% 48.3% 107.0% Greater Vancouver $746,400 299.7 1.0% 1.3% 2.5% 9.5% 7.7% 39.2% 96.9% Burnaby East $740,100 294.6 1.5% 1.6% 5.0% 9.4% 5.4% 32.0% 83.4% Burnaby North $733,200 287.2 1.1% 2.3% 4.4% 9.8% 6.1% 40.5% 95.8% Burnaby South $683,600 280.1 0.1% 0.9% 1.4% 6.3% 0.8% 32.7% 77.8% Coquitlam $603,200 331.0 1.6% 2.4% 4.6% 12.9% 14.0% 63.1% 131.1% Ladner $591,600 277.1 3.0% 1.4% 7.3% 14.1% 9.5% 26.1% 73.4% Maple Ridge $451,100 322.6 2.3% 5.9% 8.1% 21.2% 22.1% 77.3% 132.4% New Westminster $568,000 321.8 0.2% 0.8% 4.0% 7.8% 2.6% 48.8% 105.1% North Vancouver $654,300 266.2 -0.9% -0.1% 1.6% 7.6% 8.9% 34.6% 87.7% Pitt Meadows $565,500 347.2 1.7% 4.0% 5.1% 18.1% 16.0% 68.5% 144.3% Port Coquitlam $537,800 321.6 2.6% 1.7% 3.8% 15.3% 17.4% 64.2% 125.8% Port Moody $732,800 305.4 0.4% 2.9% 3.5% 13.1% 10.8% 53.0% 145.1% Richmond $731,100 313.0 0.9% 2.3% 3.1% 11.8% 10.0% 51.4% 107.7% Squamish $633,700 343.7 7.9% 12.2% 16.5% 27.0% 34.2% 72.5% 191.0% Sunshine Coast $574,300 347.6 7.7% 10.1% 14.0% 27.6% 28.0% 61.3% 184.9% Tsawwassen $648,800 279.8 2.2% 0.9% 5.9% 12.4% 6.8% 23.4% 78.4% Vancouver East $633,400 356.0 0.6% 0.2% 0.6% 7.7% 5.3% 32.9% 96.7% Vancouver West $823,200 267.1 0.8% -0.7% -0.8% 5.0% 1.7% 19.8% 75.7% West Vancouver $1,124,100 228.4 -3.3% -1.6% -3.1% 2.7% -2.7% 19.3% 53.8% Whistler $662,200 284.6 8.3% 11.8% 15.8% 31.7% 41.9% 89.1% 166.2% HOW TO READ THE TABLE: • Benchmark Price: Estimated sale price of a benchmark property. Benchmarks represent a typical property within each market. • Price Index: Index numbers estimate the percentage change in price on typical and constant quality properties over time. All figures are based on past sales. • x Month/Year Change %: Percentage change of index over a period of x month(s)/year(s) In January 2005, the indexes are set to 100. * Townhome properties are similar to attached properties, a category that was used in the previous MLSLink HPI, but do not included duplexes. Lower Mainland includes areas serviced by both Real Estate Board of Greater Vancouver & Fraser Valley Real Estate Board. The above info is deemed reliable, but is not guaranteed. All dollar amounts in CDN. * MLS®, Multiple Listing Service®, and all related graphics are trademarks of The Canadian Real Estate Association 2 of 18
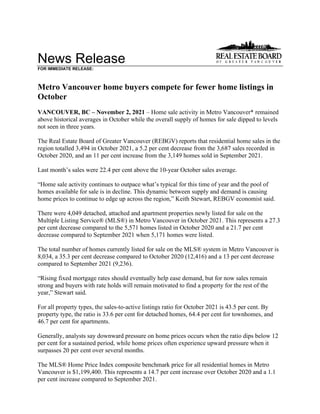
- 5. C:DATAMonthEndHpiexporthi_resgv-hpi2.tif Greater Vancouver 5 Year Trend 60 110 160 210 260 310 360 Oct 2016 Dec 2016 Feb 2017 Apr 2017 Jun 2017 Aug 2017 Oct 2017 Dec 2017 Feb 2018 Apr 2018 Jun 2018 Aug 2018 Oct 2018 Dec 2018 Feb 2019 Apr 2019 Jun 2019 Aug 2019 Oct 2019 Dec 2019 Feb 2020 Apr 2020 Jun 2020 Aug 2020 Oct 2020 Dec 2020 Feb 2021 Apr 2021 Jun 2021 Aug 2021 Oct 2021 Price Index Residential Detached Townhouse Apartment Jan 2005 HPI = 100
- 8. Listing & Sales Activity Summary Listings Sales 1 2 3 Col. 2 & 3 5 6 7 Col. 6 & 7 9 10 Col. 9 & 10 Oct Sep Oct Percentage Oct Sep Oct Percentage Aug 2020 - Aug 2021 - Percentage 2020 2021 2021 Variance 2020 2021 2021 Variance Oct 2020 Oct 2021 Variance BURNABY % % % DETACHED 164 130 104 -20.0 98 75 97 29.3 297 244 -17.8 ATTACHED 98 95 70 -26.3 82 85 73 -14.1 227 240 5.7 APARTMENTS 380 384 270 -29.7 214 248 291 17.3 632 792 25.3 COQUITLAM DETACHED 140 127 82 -35.4 129 74 100 35.1 341 273 -19.9 ATTACHED 83 50 29 -42.0 89 37 39 5.4 211 124 -41.2 APARTMENTS 223 176 165 -6.3 129 133 163 22.6 344 436 26.7 DELTA DETACHED 75 59 59 0.0 88 49 51 4.1 217 163 -24.9 ATTACHED 28 30 24 -20.0 18 23 27 17.4 60 70 16.7 APARTMENTS 32 28 22 -21.4 25 22 24 9.1 77 73 -5.2 MAPLE RIDGE/PITT MEADOWS DETACHED 173 143 119 -16.8 170 109 122 11.9 476 348 -26.9 ATTACHED 76 42 40 -4.8 87 51 38 -25.5 244 140 -42.6 APARTMENTS 80 82 41 -50.0 57 60 58 -3.3 146 157 7.5 NORTH VANCOUVER DETACHED 147 144 94 -34.7 128 80 94 17.5 364 246 -32.4 ATTACHED 67 46 54 17.4 62 35 30 -14.3 164 107 -34.8 APARTMENTS 228 224 142 -36.6 142 115 136 18.3 374 350 -6.4 NEW WESTMINSTER DETACHED 50 40 18 -55.0 36 14 29 107.1 99 64 -35.4 ATTACHED 37 24 28 16.7 21 11 17 54.5 85 51 -40.0 APARTMENTS 181 171 124 -27.5 111 104 118 13.5 316 325 2.8 PORT MOODY/BELCARRA DETACHED 36 30 18 -40.0 25 24 21 -12.5 70 63 -10.0 ATTACHED 26 19 12 -36.8 31 14 19 35.7 92 41 -55.4 APARTMENTS 60 43 38 -11.6 36 31 32 3.2 103 94 -8.7 PORT COQUITLAM DETACHED 40 34 42 23.5 36 38 37 -2.6 121 111 -8.3 ATTACHED 35 40 23 -42.5 38 21 31 47.6 91 75 -17.6 APARTMENTS 98 69 66 -4.3 46 37 50 35.1 123 127 3.3 RICHMOND DETACHED 180 184 141 -23.4 107 106 116 9.4 318 339 6.6 ATTACHED 132 107 117 9.3 95 96 117 21.9 286 319 11.5 APARTMENTS 307 328 278 -15.2 178 230 243 5.7 520 694 33.5 SUNSHINE COAST DETACHED 75 66 58 -12.1 104 70 63 -10.0 301 200 -33.6 ATTACHED 19 12 10 -16.7 20 6 10 66.7 58 27 -53.4 APARTMENTS 18 11 6 -45.5 14 9 10 11.1 38 33 -13.2 SQUAMISH DETACHED 39 31 28 -9.7 38 20 24 20.0 94 63 -33.0 ATTACHED 34 23 18 -21.7 32 20 20 0.0 83 57 -31.3 APARTMENTS 21 25 28 12.0 21 11 25 127.3 54 46 -14.8 VANCOUVER EAST DETACHED 234 185 158 -14.6 151 138 137 -0.7 440 377 -14.3 ATTACHED 119 141 87 -38.3 66 75 76 1.3 196 191 -2.6 APARTMENTS 332 296 233 -21.3 174 153 178 16.3 526 486 -7.6 VANCOUVER WEST DETACHED 196 220 158 -28.2 111 82 108 31.7 306 265 -13.4 ATTACHED 133 116 124 6.9 70 66 68 3.0 181 213 17.7 APARTMENTS 850 892 689 -22.8 365 416 417 0.2 1084 1276 17.7 WHISTLER/PEMBERTON DETACHED 30 25 13 -48.0 32 24 19 -20.8 90 63 -30.0 ATTACHED 38 29 15 -48.3 63 27 29 7.4 131 76 -42.0 APARTMENTS 42 28 34 21.4 36 30 36 20.0 106 102 -3.8 WEST VANCOUVER/HOWE SOUND DETACHED 142 162 126 -22.2 74 41 60 46.3 187 144 -23.0 ATTACHED 23 11 14 27.3 7 10 9 -10.0 22 24 9.1 APARTMENTS 39 32 22 -31.3 22 20 19 -5.0 55 58 5.5 GRAND TOTALS DETACHED 1721 1580 1218 -22.9 1327 944 1078 14.2 3721 2963 -20.4 ATTACHED 948 785 665 -15.3 781 577 603 4.5 2131 1755 -17.6 APARTMENTS 2891 2789 2158 -22.6 1570 1619 1800 11.2 4498 5049 12.2