SlideShare a Scribd company logo
1 of 9
Download to read offline
News Release
FOR IMMEDIATE RELEASE:
More supply and less demand seen across Metro Vancouver housing
market
VANCOUVER, BC – October 2, 2018 – The supply of homes for sale continued to increase
across the Metro Vancouver* housing market in September while home buyer demand remained
below typical levels for this time of year.
The Real Estate Board of Greater Vancouver (REBGV) reports that residential property sales in
the region totalled 1,595 in September 2018, a 43.5 per cent decrease from the 2,821 sales
recorded in September 2017, and a 17.3 per cent decrease compared to August 2018 when 1,929
homes sold.
Last month’s sales were 36.1 per cent below the 10-year September sales average.
“Fewer home sales are allowing listings to accumulate and prices to ease across the Metro
Vancouver housing market,” Ashley Smith, REBGV president-elect said. “There’s more
selection for home buyers to choose from today. Since spring, home listing totals have risen to
levels we haven’t seen in our market in four years.”
There were 5,279 detached, attached and apartment properties newly listed for sale on the
Multiple Listing Service® (MLS®) in Metro Vancouver in September 2018. This represents a
1.8 per cent decrease compared to the 5,375 homes listed in September 2017 and a 36 per cent
increase compared to August 2018 when 3,881 homes were listed.
The total number of properties currently listed for sale on the MLS® system in Metro Vancouver
is 13,084, a 38.2 per cent increase compared to September 2017 (9,466) and a 10.7 per cent
increase compared to August 2018 (11,824).
For all property types, the sales-to-active listings ratio for September 2018 is 12.2 per cent. By
property type, the ratio is 7.8 per cent for detached homes, 14 per cent for townhomes, and 17.6
per cent for condominiums.
Generally, analysts say that downward pressure on home prices occurs when the ratio dips below
the 12 per cent mark for a sustained period, while home prices often experience upward pressure
when it surpasses 20 per cent over several months.
“Metro Vancouver’s housing market has changed pace compared to the last few years. Our
townhome and apartment markets are sitting in balanced market territory and our detached home
market remains in a clear buyers’ market,” Smith said. “It’s important for both home buyers and
sellers to work with their Realtor to understand what these trends means to them.”
The MLS® Home Price Index composite benchmark price for all residential properties in Metro
Vancouver is currently $1,070,600. This represents a 2.2 per cent increase over September 2017
and a 3.1 per cent decrease over the last three months.
Sales of detached properties in September 2018 reached 508, a 40.4 per cent decrease from the
852 detached sales recorded in September 2017. The benchmark price for detached properties is
$1,540,900. This represents a 4.5 per cent decrease from September 2017 and a 3.4 per cent
decrease over the last three months.
Sales of apartment properties reached 812 in September 2018, a 44 per cent decrease compared
to the 1,451 sales in September 2017. The benchmark price of an apartment property is
$687,300. This represents a 7.4 per cent increase from September 2017 and a 3.1 per cent
decrease over the last three months.
Attached property sales in September 2018 totalled 275, a 46.9 per cent decrease compared to
the 518 sales in September 2017. The benchmark price of an attached unit is $837,600. This
represents a 6.4 per cent increase from September 2017 and a two per cent decrease over the last
three months.
-30-
*Editor’s Note: Areas covered by the Real Estate Board of Greater Vancouver include: Whistler, Sunshine Coast,
Squamish, West Vancouver, North Vancouver, Vancouver, Burnaby, New Westminster, Richmond, Port Moody,
Port Coquitlam, Coquitlam, Pitt Meadows, Maple Ridge, and South Delta.
The real estate industry is a key economic driver in British Columbia. In 2017, 35,993 homes changed ownership in
the Board’s area, generating $2.4 billion in economic spin-off activity and an estimated 17,600 jobs. The total dollar
value of residential sales transacted through the MLS® system in Greater Vancouver totalled $37 billion in 2017.
The Real Estate Board of Greater Vancouver is an association representing more than 14,000 REALTORS® and
their companies. The Board provides a variety of member services, including the Multiple Listing Service®. For
more information on real estate, statistics, and buying or selling a home, contact a local REALTOR® or visit
www.rebgv.org.
For more information please contact:
Craig Munn
Manager, Communication
Real Estate Board of Greater Vancouver
604.730.3146
cmunn@rebgv.org
Property Type Area
Benchmark
Price
Price
Index
1 Month
Change %
3 Month
Change %
6 Month
Change %
1 Year
Change %
3 Year
Change %
5 Year
Change %
10 Year
Change %
Residential / Composite Lower Mainland $1,003,500 275.5 -1.2% -3.0% -1.6% 4.3% 52.2% 78.5% 93.1%
Greater Vancouver $1,070,600 277.2 -1.2% -3.1% -2.2% 2.2% 45.5% 74.4% 93.2%
Bowen Island $974,600 211.3 -1.0% -5.7% -0.4% 1.5% 51.5% 68.9% 53.0%
Burnaby East $1,005,500 278.9 -0.9% -4.3% -1.9% 3.3% 44.9% 72.7% 96.4%
Burnaby North $928,300 280.3 -0.6% -1.9% -0.5% 4.8% 51.0% 76.3% 94.9%
Burnaby South $1,023,200 289.0 -1.4% -4.5% -2.8% 2.6% 49.9% 77.6% 102.4%
Coquitlam $960,100 284.8 -1.9% -2.5% 0.1% 6.0% 56.1% 92.0% 103.6%
Ladner $881,400 247.4 -1.1% 0.9% 1.0% 3.1% 34.8% 64.5% 80.2%
Maple Ridge $790,700 251.8 -1.2% -2.8% -0.3% 8.4% 69.3% 88.1% 80.6%
New Westminster $692,300 304.2 -1.0% -3.0% 0.2% 9.4% 67.9% 89.3% 104.0%
North Vancouver $1,083,100 246.9 -1.0% -3.1% -3.4% 0.4% 41.8% 67.3% 80.4%
Pitt Meadows $782,100 284.3 -1.4% -2.9% 0.6% 11.0% 75.6% 96.3% 101.8%
Port Coquitlam $772,100 264.3 -2.4% -5.1% -3.6% 4.6% 58.4% 86.5% 83.9%
Port Moody $958,000 264.8 -1.0% -3.7% 0.1% 7.0% 56.8% 87.4% 91.3%
Richmond $1,031,200 297.1 0.1% -1.4% -0.8% 3.8% 47.3% 77.4% 103.9%
Squamish $781,900 245.4 -1.8% -4.8% 0.0% 4.9% 63.8% 99.4% 81.6%
Sunshine Coast $603,400 211.4 -3.0% -4.3% -1.1% 3.4% 56.8% 75.9% 53.0%
Tsawwassen $1,016,200 255.2 1.0% 0.8% -0.2% 1.9% 36.2% 70.8% 86.3%
Vancouver East $1,094,900 320.6 -0.5% -1.5% -2.0% 1.3% 44.9% 80.5% 113.3%
Vancouver West $1,308,400 275.9 -2.1% -4.6% -5.1% -3.5% 33.0% 61.7% 89.9%
West Vancouver $2,398,000 257.8 -1.0% -5.6% -9.7% -8.7% 16.9% 49.5% 82.3%
Whistler $945,700 204.8 -2.6% -4.3% -0.3% 5.4% 69.3% 101.4% 52.7%
Single Family Detached Lower Mainland $1,294,700 274.8 -1.6% -3.4% -3.1% -2.3% 38.2% 70.7% 97.7%
Greater Vancouver $1,540,900 283.7 -1.3% -3.4% -4.0% -4.5% 30.3% 66.4% 101.2%
Bowen Island $974,600 211.3 -1.0% -5.7% -0.4% 1.5% 51.5% 68.9% 53.0%
Burnaby East $1,248,100 279.1 -1.7% -6.9% -4.6% -2.1% 31.7% 67.1% 106.1%
Burnaby North $1,498,100 289.7 -0.2% -2.7% -3.0% -6.2% 23.6% 59.2% 107.7%
Burnaby South $1,589,600 304.3 -1.9% -7.2% -5.0% -8.0% 28.5% 63.6% 118.0%
Coquitlam $1,285,100 285.2 -1.6% -2.2% -0.4% 0.4% 42.3% 82.2% 108.0%
Ladner $1,006,400 242.6 -0.4% 0.8% -0.2% -0.9% 28.5% 61.2% 81.6%
Maple Ridge $864,500 246.3 -0.6% -1.8% 1.4% 6.4% 64.5% 87.7% 82.6%
New Westminster $1,117,600 278.8 -1.3% -6.0% -5.0% -1.8% 34.2% 67.2% 104.4%
North Vancouver $1,620,300 253.4 -1.8% -3.8% -6.0% -5.4% 32.5% 68.1% 89.0%
Pitt Meadows $928,000 261.5 -1.4% -3.0% -0.6% 4.0% 57.8% 83.4% 97.4%
Port Coquitlam $984,500 262.5 -2.3% -4.4% -4.2% -1.1% 41.1% 78.7% 89.4%
Port Moody $1,504,300 277.8 -1.6% -3.1% 1.3% 0.5% 42.6% 76.8% 99.7%
Richmond $1,662,600 322.1 -0.4% -2.6% -6.1% -5.4% 32.0% 71.1% 117.5%
Squamish $985,100 249.0 -1.5% -6.2% -1.8% 2.4% 56.7% 100.6% 85.8%
Sunshine Coast $600,300 210.3 -2.8% -4.4% -0.9% 3.4% 56.8% 76.1% 52.3%
Tsawwassen $1,266,500 272.7 1.3% 1.5% -0.6% -0.3% 36.3% 77.3% 102.0%
Vancouver East $1,502,900 332.2 -1.7% -2.5% -3.2% -4.0% 29.5% 76.9% 132.6%
Vancouver West $3,254,200 334.1 -0.7% -4.1% -5.6% -10.9% 18.6% 55.5% 117.7%
West Vancouver $2,777,500 262.2 -1.9% -5.7% -10.8% -11.4% 12.0% 47.3% 85.2%
Whistler $1,743,300 222.7 -2.2% -2.3% -1.3% 4.9% 56.5% 85.7% 65.2%
HOW TO READ THE TABLE:
• Benchmark Price: Estimated sale price of a benchmark property. Benchmarks represent a typical property within each market.
• Price Index: Index numbers estimate the percentage change in price on typical and constant quality properties over time. All figures are based on past sales.
• x Month/Year Change %: Percentage change of index over a period of x month(s)/year(s) *
In January 2005, the indexes are set to 100.
Townhome properties are similar to Attached properties, a category that was used in the previous MLSLink HPI, but do not included duplexes.
The above info is deemed reliable, but is not guaranteed. All dollar amounts in CDN.
September 2018*
* MLS®, Multiple Listing Service®, and all related graphics are trademarks of The Canadian Real Estate Association 1 of 15
Property Type Area
Benchmark
Price
Price
Index
1 Month
Change %
3 Month
Change %
6 Month
Change %
1 Year
Change %
3 Year
Change %
5 Year
Change %
10 Year
Change %
September 2018*
Townhouse Lower Mainland $707,300 255.1 -0.7% -2.1% 0.5% 7.5% 61.0% 77.4% 80.2%
Greater Vancouver $837,600 266.6 -1.0% -2.0% 0.5% 6.4% 55.7% 76.4% 86.6%
Burnaby East $718,800 265.5 0.8% 0.2% 4.2% 12.9% 61.4% 74.3% 83.7%
Burnaby North $768,600 286.9 0.3% -1.1% 2.0% 9.5% 60.1% 78.8% 93.7%
Burnaby South $822,700 283.4 -2.2% -3.9% -0.5% 10.0% 58.7% 81.4% 96.7%
Coquitlam $686,200 251.8 -0.6% -3.7% -0.5% 6.3% 53.2% 78.8% 83.5%
Ladner $786,300 274.2 -3.9% 1.1% 0.8% 5.9% 49.9% 75.2% 88.7%
Maple Ridge $558,800 259.4 -1.3% -2.7% -2.8% 8.6% 74.0% 88.9% 81.9%
New Westminster $729,900 288.6 -1.6% 0.9% 3.0% 9.2% 60.5% 81.3% 96.5%
North Vancouver $1,021,900 248.3 -0.8% -2.7% 1.6% 5.9% 49.1% 74.2% 85.0%
Pitt Meadows $657,300 284.4 -1.6% -1.0% 4.9% 14.7% 82.2% 108.0% 100.6%
Port Coquitlam $660,400 250.0 -1.1% -4.0% -1.7% 4.0% 61.0% 78.4% 77.8%
Port Moody $676,100 228.5 -1.7% -1.4% 2.5% 11.7% 45.9% 68.9% 61.1%
Richmond $862,400 283.4 -0.4% 0.9% 3.8% 7.6% 53.2% 75.4% 97.2%
Squamish $726,700 247.8 2.5% 0.6% 4.4% 9.4% 67.1% 96.0% 81.8%
Tsawwassen $770,500 287.0 -2.9% 0.5% 2.1% 4.5% 54.8% 79.2% 97.5%
Vancouver East $873,400 286.7 -2.3% -5.4% -3.8% 2.6% 50.2% 65.1% 85.3%
Vancouver West $1,229,300 271.5 -3.0% -5.7% -3.3% -2.8% 47.1% 68.5% 89.2%
Whistler $956,000 239.1 1.5% 0.9% 3.9% 13.4% 75.2% 102.1% 75.4%
Apartment Lower Mainland $674,700 285.1 -1.1% -3.0% -1.0% 11.0% 71.0% 89.4% 92.5%
Greater Vancouver $687,300 275.8 -1.2% -3.1% -1.5% 7.4% 62.7% 83.4% 88.8%
Burnaby East $767,600 294.5 -1.9% -4.4% -4.8% 3.7% 61.5% 76.9% 87.3%
Burnaby North $644,600 275.2 -1.0% -1.7% 0.5% 11.8% 77.1% 91.4% 89.0%
Burnaby South $709,800 285.0 -1.1% -3.7% -2.4% 6.8% 65.2% 86.8% 97.4%
Coquitlam $537,600 295.0 -2.7% -2.6% 0.2% 11.4% 80.1% 111.5% 102.3%
Ladner $470,300 222.9 -0.1% -0.1% 2.4% 11.2% 35.3% 56.9% 57.9%
Maple Ridge $364,100 260.0 -2.7% -5.9% -2.5% 14.5% 81.4% 83.4% 67.3%
New Westminster $551,400 312.4 -0.9% -2.8% 0.9% 12.4% 82.4% 96.8% 103.5%
North Vancouver $595,700 239.0 -0.1% -2.6% -2.3% 6.0% 55.1% 65.2% 69.7%
Pitt Meadows $519,800 306.5 -1.4% -4.5% -2.5% 14.1% 89.8% 99.9% 97.2%
Port Coquitlam $457,300 273.5 -3.0% -6.5% -4.4% 10.4% 79.5% 101.4% 79.1%
Port Moody $666,400 277.7 -0.4% -4.7% -1.3% 10.8% 80.8% 108.2% 106.2%
Richmond $690,600 288.3 0.7% -1.3% 2.2% 12.8% 72.0% 90.8% 98.8%
Squamish $482,700 232.5 -6.0% -9.0% -1.7% 3.4% 72.5% 113.9% 71.6%
Tsawwassen $501,100 211.3 0.6% -0.8% 2.1% 11.0% 40.7% 59.0% 49.6%
Vancouver East $575,700 317.6 1.1% 0.3% -0.3% 7.5% 70.2% 91.8% 99.2%
Vancouver West $804,100 260.9 -2.5% -4.6% -4.8% 1.0% 44.9% 69.2% 82.6%
West Vancouver $1,213,900 245.9 2.0% -5.6% -5.1% 5.2% 53.2% 62.8% 74.5%
Whistler $521,000 170.8 -6.4% -10.1% -2.7% -1.0% 87.5% 159.2% 30.0%
HOW TO READ THE TABLE:
• Benchmark Price: Estimated sale price of a benchmark property. Benchmarks represent a typical property within each market.
• Price Index: Index numbers estimate the percentage change in price on typical and constant quality properties over time. All figures are based on past sales.
• x Month/Year Change %: Percentage change of index over a period of x month(s)/year(s)
In January 2005, the indexes are set to 100. *
Townhome properties are similar to attached properties, a category that was used in the previous MLSLink HPI, but do not included duplexes.
Lower Mainland includes areas serviced by both Real Estate Board of Greater Vancouver & Fraser Valley Real Estate Board.
The above info is deemed reliable, but is not guaranteed. All dollar amounts in CDN.
* MLS®, Multiple Listing Service®, and all related graphics are trademarks of The Canadian Real Estate Association 2 of 15
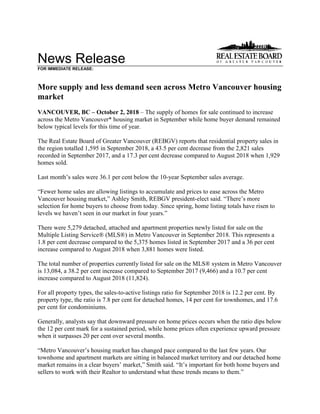
C:DATAMonthEndHpiexporthi_resgv-hpi2.tifGreaterVancouver
5YearTrend
60
110
160
210
260
310
Sep 2013
Nov 2013
Jan 2014
Mar 2014
May 2014
Jul 2014
Sep 2014
Nov 2014
Jan 2015
Mar 2015
May 2015
Jul 2015
Sep 2015
Nov 2015
Jan 2016
Mar 2016
May 2016
Jul 2016
Sep 2016
Nov 2016
Jan 2017
Mar 2017
May 2017
Jul 2017
Sep 2017
Nov 2017
Jan 2018
Mar 2018
May 2018
Jul 2018
Sep 2018
Price
Index
ResidentialDetachedTownhouseApartment
Jan2005HPI=100
9252018MLS®
SALESFacts
Burnaby
Coquitlam
Delta-South
Islands-Gulf
MapleRidge/PittMeadows
NewWestminster
NorthVancouver
PortCoquitlam
PortMoody/Belcarra
Richmond
Squamish
SunshineCoast
VancouverEast
VancouverWest
WestVancouver/HoweSound
Whistler/Pemberton
Detached394924646144123962113772382512508
Attached36261402632114836352733221275
Apartment100551703064563517968395208721812
Detached$1,747,500$1,230,000$1,025,000n/a$810,000n/a$1,690,000$1,025,000n/a$1,539,989n/a$660,000$1,550,000$2,900,000$2,750,000n/a
Attached$784,000$887,950n/an/a$548,050n/a$1,020,000n/an/a$882,500n/an/a$950,000$1,332,000n/a$1,152,000n/a
Apartment$582,500$549,000n/an/a$383,500$509,000$597,000$450,000n/a$556,000n/an/a$592,000$790,000n/a$456,500
Detached4060291074143118555225458582712567
Attached373710040730186571362238412337
Apartment1198590306470361815416211127514221,025
Detached$1,600,000$1,305,000$1,040,000n/a$854,000n/a$1,512,500n/an/a$1,580,000$1,082,500$719,500$1,530,800$2,900,000$2,500,000n/a
Attached$867,000$828,900n/an/a$551,000n/a$932,450n/an/a$850,000n/an/a$950,000$1,446,500n/an/an/a
Apartment$575,500$525,000n/an/a$393,750$520,000$639,000$440,000n/a$557,500n/an/a$617,500$798,500n/a$394,900
Detached627538101362274411789126195733512852
Attached6643515516292712902994164427518
Apartment19110913032117107552420017612940317311,451
Detached$1,677,500$1,308,000$1,226,976n/a$824,960$1,205,000$1,734,250$928,000n/a$1,790,000n/a$699,000$1,610,000$3,662,500$3,240,000n/a
Attached$736,250$695,000n/an/a$515,000n/a$1,144,000$625,000n/a$865,000$670,000n/a$910,000$1,322,500n/a$699,000n/a
Apartment$548,000$465,000n/an/a$360,000$506,000$620,000$425,500$545,635$519,000n/an/a$585,000$769,444n/a$489,000
Detached47056429342778181525252926231534217435452521076,041
Attached4172718813599327118211856612470322378371943,491
Apartment1,21373814104717527703502141,364121461,1502,73414123610,441
Detached$1,604,000$1,315,000$1,115,000$457,500$876,900$1,245,000$1,683,000$1,003,750$1,422,500$1,690,000$999,500$660,000$1,599,000$3,091,500$2,800,000$1,925,000
Attached$790,000$812,500$743,700n/a$560,000$765,344$992,000$696,000$760,000$870,000$688,000$445,000$1,072,500$1,389,000$1,600,000$1,099,500n/a
Apartment$600,000$550,000$542,500n/a$393,100$510,400$659,950$445,000$599,000$580,000$447,000$399,450$615,900$820,000$1,205,000$406,000
Detached694833448601,1652028214021631,0482265611,1068314131479,120
Attached585401117254016831325016090320998358509522504,915
Apartment1,8371,09016105601,0429454453231,956150881,4093,66517228214,125
Detached$1,618,000$1,270,000$1,123,500$460,000$790,000$1,150,000$1,740,000$935,000$1,328,000$1,650,000$920,000$597,000$1,570,000$3,418,572$3,165,000$1,745,000
Attached$758,000$732,000$690,000n/a$477,250$684,400$1,012,500$615,000$636,500$830,000$599,900$389,488$982,328$1,336,000$2,012,500$734,500n/a
Apartment$530,500$473,250$520,000n/a$320,000$455,000$595,000$369,900$530,000$497,000$395,000$358,125$532,000$750,000$1,033,750$385,000
Note:MedianSellingPricesarenotreportedforareaswithlessthan20salesorfortheGulfIslands
Number
of
Sales
September
2018
Number
of
Sales
Median
Selling
Price
Number
of
Sales
Median
Selling
Price
Number
of
Sales
Median
Selling
Price
August
2018
September
2017
Jan.-
Sep.2018
Jan.-
Sep.2017
Median
Selling
Price
Number
of
Sales
Median
Selling
Price
September
2018
Year-to-date
Year-to-date
9252018MLS®
LISTINGSFacts
Burnaby
Coquitlam
Delta-South
Islands-Gulf
MapleRidge/PittMeadows
NewWestminster
NorthVancouver
PortCoquitlam
PortMoody/Belcarra
Richmond
Squamish
SunshineCoast
VancouverEast
VancouverWest
WestVancouver/HoweSound
Whistler/Pemberton
Detached1721919431654624059442453666223211162201,977
Attached107803408914694821117266881361930884
Apartment25918033169174226575028314529668256332,418
Detached23%26%26%200%28%30%17%39%20%25%31%56%32%18%15%60%
Attached34%33%41%n/a29%21%30%29%38%31%12%83%31%24%11%70%n/a
Apartment39%31%52%0%43%37%25%61%34%34%57%60%32%30%13%64%
Detached111146569147309059172023499172167107261,472
Attached88692137611443281222184094727671
Apartment225147130671211205430244211118145423271,738
Detached36%41%52%111%50%47%34%31%29%27%65%55%34%35%25%46%
Attached42%54%48%0%53%64%68%56%75%47%62%75%55%40%57%44%n/a
Apartment53%58%69%n/a45%53%58%67%60%63%76%18%61%61%61%81%
Detached254224107111875323045432653882278327221252,390
Attached109531906318623426149327811031832806
Apartment26216019052167175785129417920461942302,179
Detached24%33%36%91%73%42%32%91%40%34%32%74%34%22%16%48%
Attached61%81%26%n/a87%89%47%79%46%60%91%129%51%62%22%84%n/a
Apartment73%68%68%n/a62%70%61%71%47%68%100%67%63%65%40%103%
Detached1,5611,574795941,5543851,5865792912,2483728502,1272,1051,39520917,725
Attached852597165166321645273692011,1522171047029991313077,135
Apartment2,1751,37224017051,2311,3785273672,471206722,1245,47834232419,013
Detached30%36%37%45%50%47%33%44%32%28%41%50%35%26%18%51%
Attached49%45%53%6%57%57%51%49%59%49%57%67%46%38%28%63%n/a
Apartment56%54%59%0%67%61%56%66%58%55%59%64%54%50%41%73%
Detached1,8351,6528371031,7573631,5775773312,5093898382,3612,2931,44621619,084
Attached90852913556092184613191981,3572651186058431122746,956
Apartment2,3301,34819406251,2711,2385724032,440162941,7635,05626032018,076
Detached38%50%54%58%66%56%52%70%49%42%58%67%47%36%29%68%
Attached64%76%87%40%89%77%68%78%81%67%79%83%59%60%46%91%n/a
Apartment79%81%83%n/a90%82%76%78%80%80%93%94%80%72%66%88%
*Year-to-datelistingsrepresentacumulativetotaloflistingsratherthantotalactivelistings.
%Salesto
Listings
Number
of
Listings
%Salesto
Listings
August
2018
September
2017
Jan.-
Sep.2018
Jan.-
Sep.2017
%Salesto
Listings
Number
of
Listings
%Salesto
Listings
Number
of
Listings
September
2018
Number
of
Listings
%Salesto
Listings
Number
of
Listings
September
2018
Year-to-date*
Year-to-date*
Listing & Sales Activity Summary
Listings Sales
1 2 3 Col. 2 & 3 5 6 7 Col. 6 & 7 9 10 Col. 9 & 10
Sep Aug Sep Percentage Sep Aug Sep Percentage Jul 2017 - Jul 2018 - Percentage
2017 2018 2018 Variance 2017 2018 2018 Variance Sep 2017 Sep 2018 Variance
BURNABY % % %
DETACHED 254 111 172 55.0 62 40 39 -2.5 184 124 -32.6
ATTACHED 109 88 107 21.6 66 37 36 -2.7 190 102 -46.3
APARTMENTS 262 225 259 15.1 191 119 100 -16.0 602 329 -45.3
COQUITLAM
DETACHED 224 146 191 30.8 75 60 49 -18.3 249 157 -36.9
ATTACHED 53 69 80 15.9 43 37 26 -29.7 122 97 -20.5
APARTMENTS 160 147 180 22.4 109 85 55 -35.3 372 208 -44.1
DELTA
DETACHED 107 56 94 67.9 38 29 24 -17.2 147 87 -40.8
ATTACHED 19 21 34 61.9 5 10 14 40.0 28 28 0.0
APARTMENTS 19 13 33 153.8 13 9 17 88.9 47 40 -14.9
MAPLE RIDGE/PITT MEADOWS
DETACHED 187 147 165 12.2 136 74 46 -37.8 411 199 -51.6
ATTACHED 63 76 89 17.1 55 40 26 -35.0 167 104 -37.7
APARTMENTS 52 67 69 3.0 32 30 30 0.0 126 98 -22.2
NORTH VANCOUVER
DETACHED 230 90 240 166.7 74 31 41 32.3 230 123 -46.5
ATTACHED 62 44 69 56.8 29 30 21 -30.0 100 75 -25.0
APARTMENTS 175 120 226 88.3 107 70 56 -20.0 297 201 -32.3
NEW WESTMINSTER
DETACHED 53 30 46 53.3 22 14 14 0.0 61 49 -19.7
ATTACHED 18 11 14 27.3 16 7 3 -57.1 48 18 -62.5
APARTMENTS 167 121 174 43.8 117 64 64 0.0 364 213 -41.5
PORT MOODY/BELCARRA
DETACHED 43 17 44 158.8 17 5 9 80.0 48 26 -45.8
ATTACHED 26 8 21 162.5 12 6 8 33.3 54 28 -48.1
APARTMENTS 51 30 50 66.7 24 18 17 -5.6 93 60 -35.5
PORT COQUITLAM
DETACHED 45 59 59 0.0 41 18 23 27.8 133 63 -52.6
ATTACHED 34 32 48 50.0 27 18 14 -22.2 76 53 -30.3
APARTMENTS 78 54 57 5.6 55 36 35 -2.8 145 112 -22.8
RICHMOND
DETACHED 265 202 245 21.3 89 55 62 12.7 280 194 -30.7
ATTACHED 149 122 117 -4.1 90 57 36 -36.8 316 150 -52.5
APARTMENTS 294 244 283 16.0 200 154 96 -37.7 641 399 -37.8
SUNSHINE COAST
DETACHED 82 99 66 -33.3 61 54 37 -31.5 189 145 -23.3
ATTACHED 7 8 6 -25.0 9 6 5 -16.7 31 18 -41.9
APARTMENTS 9 11 5 -54.5 6 2 3 50.0 32 6 -81.3
SQUAMISH
DETACHED 38 34 36 5.9 12 22 11 -50.0 67 54 -19.4
ATTACHED 32 21 26 23.8 29 13 3 -76.9 72 29 -59.7
APARTMENTS 17 21 14 -33.3 17 16 8 -50.0 51 38 -25.5
VANCOUVER EAST
DETACHED 278 172 223 29.7 95 58 72 24.1 320 197 -38.4
ATTACHED 81 40 88 120.0 41 22 27 22.7 117 78 -33.3
APARTMENTS 204 181 296 63.5 129 111 95 -14.4 421 337 -20.0
VANCOUVER WEST
DETACHED 327 167 211 26.3 73 58 38 -34.5 199 154 -22.6
ATTACHED 103 94 136 44.7 64 38 33 -13.2 170 119 -30.0
APARTMENTS 619 454 682 50.2 403 275 208 -24.4 1207 777 -35.6
WHISTLER/PEMBERTON
DETACHED 25 26 20 -23.1 12 12 12 0.0 47 35 -25.5
ATTACHED 32 27 30 11.1 27 12 21 75.0 89 55 -38.2
APARTMENTS 30 27 33 22.2 31 22 21 -4.5 88 59 -33.0
WEST VANCOUVER/HOWE SOUND
DETACHED 221 107 162 51.4 35 27 25 -7.4 106 84 -20.8
ATTACHED 18 7 19 171.4 4 4 2 -50.0 9 12 33.3
APARTMENTS 42 23 56 143.5 17 14 7 -50.0 46 39 -15.2
GRAND TOTALS
DETACHED 2379 1463 1974 34.9 842 557 502 -9.9 2671 1691 -36.7
ATTACHED 806 668 884 32.3 517 337 275 -18.4 1589 966 -39.2
APARTMENTS 2179 1738 2417 39.1 1451 1025 812 -20.8 4532 2916 -35.7
ResidentialAverageSalePrices-January1977toSeptember2018
0
200
400
600
800
1000
1200
1400
1600
1800
2000
1977
1978
1979
1980
1981
1982
1983
1984
1985
1986
1987
1988
1989
1990
1991
1992
1993
1994
1995
1996
1997
1998
1999
2000
2001
2002
2003
2004
2005
2006
2007
2008
2009
2010
2011
2012
2013
2014
2015
2016
2017
2018
DETACHEDCONDOMINIUMATTACHEDAPARTMENTS
INTHOUSANDS($)
NOTE:From1977-1984condominiumaverageswerenotseparatedintoattached&apartment.
$975,151
$678,409
$1,629,896

More Related Content

What's hot

Metro Vancouver Statistics Report October 2021
Metro Vancouver Statistics Report October 2021Metro Vancouver Statistics Report October 2021
Metro Vancouver Statistics Report October 2021VickyAulakh1
 
Rebgv stats-pkg-august-2018
Rebgv stats-pkg-august-2018Rebgv stats-pkg-august-2018
Rebgv stats-pkg-august-2018Kathryn Huang
 
REBGV January 2020 Statistics Package
REBGV January 2020 Statistics Package REBGV January 2020 Statistics Package
REBGV January 2020 Statistics Package Vicky Aulakh
 
Real Estate Board of Greater Vancouver Statistics Package January 2021
Real Estate Board of Greater Vancouver Statistics Package January 2021 Real Estate Board of Greater Vancouver Statistics Package January 2021
Real Estate Board of Greater Vancouver Statistics Package January 2021 Vicky Aulakh
 
Real Estate Board of Greater Vancouver Statistics Package August 2021
Real Estate Board of Greater Vancouver Statistics Package August 2021Real Estate Board of Greater Vancouver Statistics Package August 2021
Real Estate Board of Greater Vancouver Statistics Package August 2021Vicky Aulakh
 
Real Estate Board of Greater Vancouver Statistics Package October 2021
Real Estate Board of Greater Vancouver Statistics Package October 2021Real Estate Board of Greater Vancouver Statistics Package October 2021
Real Estate Board of Greater Vancouver Statistics Package October 2021VickyAulakh1
 
Rebgv stats-pkg-june-2019
Rebgv stats-pkg-june-2019Rebgv stats-pkg-june-2019
Rebgv stats-pkg-june-2019Vicky Aulakh
 
Rebgv stats-pkg-april-2020
Rebgv stats-pkg-april-2020Rebgv stats-pkg-april-2020
Rebgv stats-pkg-april-2020Vicky Aulakh
 
Metro Vancouver Statistics September 2021
Metro Vancouver Statistics September 2021 Metro Vancouver Statistics September 2021
Metro Vancouver Statistics September 2021 VickyAulakh1
 
REBGV Statistics Package May 2020
REBGV Statistics Package May 2020REBGV Statistics Package May 2020
REBGV Statistics Package May 2020Vicky Aulakh
 
REBGV Statistics Package August 2020
REBGV Statistics Package August 2020REBGV Statistics Package August 2020
REBGV Statistics Package August 2020Vicky Aulakh
 
REBGV Statistics package July 2020
REBGV Statistics package July 2020REBGV Statistics package July 2020
REBGV Statistics package July 2020Vicky Aulakh
 
REBGV Statistics Package October 2020
REBGV Statistics Package October 2020REBGV Statistics Package October 2020
REBGV Statistics Package October 2020Vicky Aulakh
 
Central Okanagan Statistics November 2021
Central Okanagan Statistics November 2021 Central Okanagan Statistics November 2021
Central Okanagan Statistics November 2021 VickyAulakh1
 
February 2022 Okanagan Real Estate Board Statistics Package With Charts & Graphs
February 2022 Okanagan Real Estate Board Statistics Package With Charts & GraphsFebruary 2022 Okanagan Real Estate Board Statistics Package With Charts & Graphs
February 2022 Okanagan Real Estate Board Statistics Package With Charts & GraphsVicky Aulakh
 
Rebgv stats-pkg-april-2019
Rebgv stats-pkg-april-2019Rebgv stats-pkg-april-2019
Rebgv stats-pkg-april-2019Kathryn Huang
 
May 2021 Real Estate Board of Greater Vancouver Statistics Package
May 2021 Real Estate Board of Greater Vancouver Statistics PackageMay 2021 Real Estate Board of Greater Vancouver Statistics Package
May 2021 Real Estate Board of Greater Vancouver Statistics PackageVicky Aulakh
 
2021 June - REBGV Statistics Package
2021 June - REBGV Statistics Package2021 June - REBGV Statistics Package
2021 June - REBGV Statistics PackageVicky Aulakh
 
Rebgv stats-pkg-november-2019-f
Rebgv stats-pkg-november-2019-fRebgv stats-pkg-november-2019-f
Rebgv stats-pkg-november-2019-fVicky Aulakh
 
REBGV Statistics Package June 2020
REBGV Statistics Package June 2020REBGV Statistics Package June 2020
REBGV Statistics Package June 2020Vicky Aulakh
 

What's hot (20)

Metro Vancouver Statistics Report October 2021
Metro Vancouver Statistics Report October 2021Metro Vancouver Statistics Report October 2021
Metro Vancouver Statistics Report October 2021
 
Rebgv stats-pkg-august-2018
Rebgv stats-pkg-august-2018Rebgv stats-pkg-august-2018
Rebgv stats-pkg-august-2018
 
REBGV January 2020 Statistics Package
REBGV January 2020 Statistics Package REBGV January 2020 Statistics Package
REBGV January 2020 Statistics Package
 
Real Estate Board of Greater Vancouver Statistics Package January 2021
Real Estate Board of Greater Vancouver Statistics Package January 2021 Real Estate Board of Greater Vancouver Statistics Package January 2021
Real Estate Board of Greater Vancouver Statistics Package January 2021
 
Real Estate Board of Greater Vancouver Statistics Package August 2021
Real Estate Board of Greater Vancouver Statistics Package August 2021Real Estate Board of Greater Vancouver Statistics Package August 2021
Real Estate Board of Greater Vancouver Statistics Package August 2021
 
Real Estate Board of Greater Vancouver Statistics Package October 2021
Real Estate Board of Greater Vancouver Statistics Package October 2021Real Estate Board of Greater Vancouver Statistics Package October 2021
Real Estate Board of Greater Vancouver Statistics Package October 2021
 
Rebgv stats-pkg-june-2019
Rebgv stats-pkg-june-2019Rebgv stats-pkg-june-2019
Rebgv stats-pkg-june-2019
 
Rebgv stats-pkg-april-2020
Rebgv stats-pkg-april-2020Rebgv stats-pkg-april-2020
Rebgv stats-pkg-april-2020
 
Metro Vancouver Statistics September 2021
Metro Vancouver Statistics September 2021 Metro Vancouver Statistics September 2021
Metro Vancouver Statistics September 2021
 
REBGV Statistics Package May 2020
REBGV Statistics Package May 2020REBGV Statistics Package May 2020
REBGV Statistics Package May 2020
 
REBGV Statistics Package August 2020
REBGV Statistics Package August 2020REBGV Statistics Package August 2020
REBGV Statistics Package August 2020
 
REBGV Statistics package July 2020
REBGV Statistics package July 2020REBGV Statistics package July 2020
REBGV Statistics package July 2020
 
REBGV Statistics Package October 2020
REBGV Statistics Package October 2020REBGV Statistics Package October 2020
REBGV Statistics Package October 2020
 
Central Okanagan Statistics November 2021
Central Okanagan Statistics November 2021 Central Okanagan Statistics November 2021
Central Okanagan Statistics November 2021
 
February 2022 Okanagan Real Estate Board Statistics Package With Charts & Graphs
February 2022 Okanagan Real Estate Board Statistics Package With Charts & GraphsFebruary 2022 Okanagan Real Estate Board Statistics Package With Charts & Graphs
February 2022 Okanagan Real Estate Board Statistics Package With Charts & Graphs
 
Rebgv stats-pkg-april-2019
Rebgv stats-pkg-april-2019Rebgv stats-pkg-april-2019
Rebgv stats-pkg-april-2019
 
May 2021 Real Estate Board of Greater Vancouver Statistics Package
May 2021 Real Estate Board of Greater Vancouver Statistics PackageMay 2021 Real Estate Board of Greater Vancouver Statistics Package
May 2021 Real Estate Board of Greater Vancouver Statistics Package
 
2021 June - REBGV Statistics Package
2021 June - REBGV Statistics Package2021 June - REBGV Statistics Package
2021 June - REBGV Statistics Package
 
Rebgv stats-pkg-november-2019-f
Rebgv stats-pkg-november-2019-fRebgv stats-pkg-november-2019-f
Rebgv stats-pkg-november-2019-f
 
REBGV Statistics Package June 2020
REBGV Statistics Package June 2020REBGV Statistics Package June 2020
REBGV Statistics Package June 2020
 

Similar to Rebgv stats-pkg-september-2018

Rebgv stats-pkg-november-2018
Rebgv stats-pkg-november-2018Rebgv stats-pkg-november-2018
Rebgv stats-pkg-november-2018Kathryn Huang
 
Rebgv stats-pkg-february-2018
Rebgv stats-pkg-february-2018Rebgv stats-pkg-february-2018
Rebgv stats-pkg-february-2018Kathryn Huang
 
May-2019 Stats Package for Greater Vancouver
May-2019 Stats Package for Greater VancouverMay-2019 Stats Package for Greater Vancouver
May-2019 Stats Package for Greater VancouverBC PRIME Realty
 
201807 rebgv-stats-package-for-media
201807 rebgv-stats-package-for-media201807 rebgv-stats-package-for-media
201807 rebgv-stats-package-for-mediaKathryn Huang
 
Rebgv stats-pkg-october-2019
Rebgv stats-pkg-october-2019Rebgv stats-pkg-october-2019
Rebgv stats-pkg-october-2019Vicky Aulakh
 
Rebgv stats-pkg-march-2019
Rebgv stats-pkg-march-2019Rebgv stats-pkg-march-2019
Rebgv stats-pkg-march-2019Kathryn Huang
 
Rebgv stats-pkg-march-2019
Rebgv stats-pkg-march-2019Rebgv stats-pkg-march-2019
Rebgv stats-pkg-march-2019Sherryl Jacobs
 
Rebgv stats-pkg-february-2019
Rebgv stats-pkg-february-2019Rebgv stats-pkg-february-2019
Rebgv stats-pkg-february-2019Kathryn Huang
 
Rebgv stats-pkg-february-2019
Rebgv stats-pkg-february-2019Rebgv stats-pkg-february-2019
Rebgv stats-pkg-february-2019Sherryl Jacobs
 
Rebgv stats-pkg-may-2018
Rebgv stats-pkg-may-2018Rebgv stats-pkg-may-2018
Rebgv stats-pkg-may-2018Kathryn Huang
 
Rebgv stats-pkg-january-2018 2
Rebgv stats-pkg-january-2018 2Rebgv stats-pkg-january-2018 2
Rebgv stats-pkg-january-2018 2Kathryn Huang
 
Rebgv stats-pkg-june-2018
Rebgv stats-pkg-june-2018Rebgv stats-pkg-june-2018
Rebgv stats-pkg-june-2018Kathryn Huang
 
Rebgv stats-pkg-april-2018
Rebgv stats-pkg-april-2018Rebgv stats-pkg-april-2018
Rebgv stats-pkg-april-2018Kathryn Huang
 
Rebgv stats-pkg-july-2019
Rebgv stats-pkg-july-2019Rebgv stats-pkg-july-2019
Rebgv stats-pkg-july-2019Vicky Aulakh
 
May 2017 REBGV Stats
May 2017 REBGV Stats May 2017 REBGV Stats
May 2017 REBGV Stats Mike Stewart
 
Real Estate Board of Greater Vancouver Statistics Package November 2020
Real Estate Board of Greater Vancouver Statistics Package November 2020Real Estate Board of Greater Vancouver Statistics Package November 2020
Real Estate Board of Greater Vancouver Statistics Package November 2020Vicky Aulakh
 
Rebgv stats-pkg-september-2019
Rebgv stats-pkg-september-2019Rebgv stats-pkg-september-2019
Rebgv stats-pkg-september-2019Vicky Aulakh
 
February 2017 REBGV Statistics Package Mike Stewart Realtor
February 2017 REBGV Statistics Package Mike Stewart RealtorFebruary 2017 REBGV Statistics Package Mike Stewart Realtor
February 2017 REBGV Statistics Package Mike Stewart RealtorMike Stewart
 

Similar to Rebgv stats-pkg-september-2018 (20)

Rebgv stats-pkg-november-2018
Rebgv stats-pkg-november-2018Rebgv stats-pkg-november-2018
Rebgv stats-pkg-november-2018
 
Rebgv stats-pkg-february-2018
Rebgv stats-pkg-february-2018Rebgv stats-pkg-february-2018
Rebgv stats-pkg-february-2018
 
May-2019 Stats Package for Greater Vancouver
May-2019 Stats Package for Greater VancouverMay-2019 Stats Package for Greater Vancouver
May-2019 Stats Package for Greater Vancouver
 
201807 rebgv-stats-package-for-media
201807 rebgv-stats-package-for-media201807 rebgv-stats-package-for-media
201807 rebgv-stats-package-for-media
 
Rebgv stats-pkg-october-2019
Rebgv stats-pkg-october-2019Rebgv stats-pkg-october-2019
Rebgv stats-pkg-october-2019
 
Rebgv stats-pkg-march-2019
Rebgv stats-pkg-march-2019Rebgv stats-pkg-march-2019
Rebgv stats-pkg-march-2019
 
Rebgv stats-pkg-march-2019
Rebgv stats-pkg-march-2019Rebgv stats-pkg-march-2019
Rebgv stats-pkg-march-2019
 
Rebgv stats-pkg-february-2019
Rebgv stats-pkg-february-2019Rebgv stats-pkg-february-2019
Rebgv stats-pkg-february-2019
 
Rebgv stats-pkg-february-2019
Rebgv stats-pkg-february-2019Rebgv stats-pkg-february-2019
Rebgv stats-pkg-february-2019
 
Rebgv stats-pkg-may-2018
Rebgv stats-pkg-may-2018Rebgv stats-pkg-may-2018
Rebgv stats-pkg-may-2018
 
Rebgv stats-pkg-january-2018 2
Rebgv stats-pkg-january-2018 2Rebgv stats-pkg-january-2018 2
Rebgv stats-pkg-january-2018 2
 
Rebgv stats-pkg-june-2018
Rebgv stats-pkg-june-2018Rebgv stats-pkg-june-2018
Rebgv stats-pkg-june-2018
 
Rebgv stats-pkg-april-2018
Rebgv stats-pkg-april-2018Rebgv stats-pkg-april-2018
Rebgv stats-pkg-april-2018
 
Rebgv stats-pkg-july-2019
Rebgv stats-pkg-july-2019Rebgv stats-pkg-july-2019
Rebgv stats-pkg-july-2019
 
Rebgv stats-pkg-october-2020
Rebgv stats-pkg-october-2020Rebgv stats-pkg-october-2020
Rebgv stats-pkg-october-2020
 
May 2017 REBGV Stats
May 2017 REBGV Stats May 2017 REBGV Stats
May 2017 REBGV Stats
 
Rebgv stats-pkg-november-2020
Rebgv stats-pkg-november-2020Rebgv stats-pkg-november-2020
Rebgv stats-pkg-november-2020
 
Real Estate Board of Greater Vancouver Statistics Package November 2020
Real Estate Board of Greater Vancouver Statistics Package November 2020Real Estate Board of Greater Vancouver Statistics Package November 2020
Real Estate Board of Greater Vancouver Statistics Package November 2020
 
Rebgv stats-pkg-september-2019
Rebgv stats-pkg-september-2019Rebgv stats-pkg-september-2019
Rebgv stats-pkg-september-2019
 
February 2017 REBGV Statistics Package Mike Stewart Realtor
February 2017 REBGV Statistics Package Mike Stewart RealtorFebruary 2017 REBGV Statistics Package Mike Stewart Realtor
February 2017 REBGV Statistics Package Mike Stewart Realtor
 

More from Kathryn Huang

Disclosureof representationintradingservices english-recbc (4)
Disclosureof representationintradingservices english-recbc (4)Disclosureof representationintradingservices english-recbc (4)
Disclosureof representationintradingservices english-recbc (4)Kathryn Huang
 
Property disclosure statement strata title properties mike stewart prec
Property disclosure statement strata title properties mike stewart precProperty disclosure statement strata title properties mike stewart prec
Property disclosure statement strata title properties mike stewart precKathryn Huang
 
Privacy noticeandconsent (3)
Privacy noticeandconsent (3)Privacy noticeandconsent (3)
Privacy noticeandconsent (3)Kathryn Huang
 
Rebgv stats-pkg-december-2018
Rebgv stats-pkg-december-2018Rebgv stats-pkg-december-2018
Rebgv stats-pkg-december-2018Kathryn Huang
 
Broadway corridor-planning-program-presentation-may-2018
Broadway corridor-planning-program-presentation-may-2018Broadway corridor-planning-program-presentation-may-2018
Broadway corridor-planning-program-presentation-may-2018Kathryn Huang
 
2018 03-metro-vancouver
2018 03-metro-vancouver 2018 03-metro-vancouver
2018 03-metro-vancouver Kathryn Huang
 
2017 Real Estate Board of Greater Vancouver Statistics Package with Charts & ...
2017 Real Estate Board of Greater Vancouver Statistics Package with Charts & ...2017 Real Estate Board of Greater Vancouver Statistics Package with Charts & ...
2017 Real Estate Board of Greater Vancouver Statistics Package with Charts & ...Kathryn Huang
 

More from Kathryn Huang (9)

Disclosureof representationintradingservices english-recbc (4)
Disclosureof representationintradingservices english-recbc (4)Disclosureof representationintradingservices english-recbc (4)
Disclosureof representationintradingservices english-recbc (4)
 
Property disclosure statement strata title properties mike stewart prec
Property disclosure statement strata title properties mike stewart precProperty disclosure statement strata title properties mike stewart prec
Property disclosure statement strata title properties mike stewart prec
 
2516 bc
2516 bc2516 bc
2516 bc
 
Privacy noticeandconsent (3)
Privacy noticeandconsent (3)Privacy noticeandconsent (3)
Privacy noticeandconsent (3)
 
Rebgv stats-pkg-december-2018
Rebgv stats-pkg-december-2018Rebgv stats-pkg-december-2018
Rebgv stats-pkg-december-2018
 
2440 bc
2440 bc2440 bc
2440 bc
 
Broadway corridor-planning-program-presentation-may-2018
Broadway corridor-planning-program-presentation-may-2018Broadway corridor-planning-program-presentation-may-2018
Broadway corridor-planning-program-presentation-may-2018
 
2018 03-metro-vancouver
2018 03-metro-vancouver 2018 03-metro-vancouver
2018 03-metro-vancouver
 
2017 Real Estate Board of Greater Vancouver Statistics Package with Charts & ...
2017 Real Estate Board of Greater Vancouver Statistics Package with Charts & ...2017 Real Estate Board of Greater Vancouver Statistics Package with Charts & ...
2017 Real Estate Board of Greater Vancouver Statistics Package with Charts & ...
 

Recently uploaded

What Is Biophilic Design .pdf
What Is Biophilic Design            .pdfWhat Is Biophilic Design            .pdf
What Is Biophilic Design .pdfyamunaNMH
 
Call Girls in Kashmiri Gate Delhi 💯Call Us 🔝8264348440🔝
Call Girls in Kashmiri Gate Delhi 💯Call Us 🔝8264348440🔝Call Girls in Kashmiri Gate Delhi 💯Call Us 🔝8264348440🔝
Call Girls in Kashmiri Gate Delhi 💯Call Us 🔝8264348440🔝soniya singh
 
Rustomjee The Panorama At Pali Hill, Bandra West, Mumbai - Brochure.pdf
Rustomjee The Panorama At Pali Hill, Bandra West, Mumbai - Brochure.pdfRustomjee The Panorama At Pali Hill, Bandra West, Mumbai - Brochure.pdf
Rustomjee The Panorama At Pali Hill, Bandra West, Mumbai - Brochure.pdfmonikasharma630
 
The Omaxe State Dwarka Delhi-broucher.pdf.pdf
The Omaxe State Dwarka Delhi-broucher.pdf.pdfThe Omaxe State Dwarka Delhi-broucher.pdf.pdf
The Omaxe State Dwarka Delhi-broucher.pdf.pdfkratirudram
 
Call Girls In Vasundhara Ghaziabad ❤️8860477959 Low Rate Escorts Service In 2...
Call Girls In Vasundhara Ghaziabad ❤️8860477959 Low Rate Escorts Service In 2...Call Girls In Vasundhara Ghaziabad ❤️8860477959 Low Rate Escorts Service In 2...
Call Girls In Vasundhara Ghaziabad ❤️8860477959 Low Rate Escorts Service In 2...lizamodels9
 
Call Girls in Sarai Kale Khan Delhi 💯Call Us 🔝8264348440🔝
Call Girls in Sarai Kale Khan Delhi 💯Call Us 🔝8264348440🔝Call Girls in Sarai Kale Khan Delhi 💯Call Us 🔝8264348440🔝
Call Girls in Sarai Kale Khan Delhi 💯Call Us 🔝8264348440🔝soniya singh
 
Call Girls In Peeragarhi, Delhi↫8447779280↬Call Girls in Peeragarhi Delhi NCR
Call Girls In Peeragarhi, Delhi↫8447779280↬Call Girls in Peeragarhi Delhi NCRCall Girls In Peeragarhi, Delhi↫8447779280↬Call Girls in Peeragarhi Delhi NCR
Call Girls In Peeragarhi, Delhi↫8447779280↬Call Girls in Peeragarhi Delhi NCRasmaqueen5
 
Low Rate Call Girls in Tughlakabad Delhi Call 9990771857
Low Rate Call Girls in Tughlakabad Delhi Call 9990771857Low Rate Call Girls in Tughlakabad Delhi Call 9990771857
Low Rate Call Girls in Tughlakabad Delhi Call 9990771857delhimodel235
 
9990771857 Call Girls in Noida Sector 10 Noida (Call Girls) Delhi
9990771857 Call Girls in Noida Sector 10 Noida (Call Girls) Delhi9990771857 Call Girls in Noida Sector 10 Noida (Call Girls) Delhi
9990771857 Call Girls in Noida Sector 10 Noida (Call Girls) Delhidelhimodel235
 
Namrata 7 Plumeria Drive Pimpri Chinchwad Pune Brochure.pdf
Namrata 7 Plumeria Drive Pimpri Chinchwad Pune Brochure.pdfNamrata 7 Plumeria Drive Pimpri Chinchwad Pune Brochure.pdf
Namrata 7 Plumeria Drive Pimpri Chinchwad Pune Brochure.pdfPrachiRudram
 
Low Rate Call Girls in Akshardham Delhi Call 9990771857
Low Rate Call Girls in Akshardham   Delhi Call 9990771857Low Rate Call Girls in Akshardham   Delhi Call 9990771857
Low Rate Call Girls in Akshardham Delhi Call 9990771857delhimodel235
 
call girls in Shahdara (DELHI) 🔝 >༒9953330565🔝 genuine Escort Service 🔝✔️✔️
call girls in Shahdara (DELHI) 🔝 >༒9953330565🔝 genuine Escort Service 🔝✔️✔️call girls in Shahdara (DELHI) 🔝 >༒9953330565🔝 genuine Escort Service 🔝✔️✔️
call girls in Shahdara (DELHI) 🔝 >༒9953330565🔝 genuine Escort Service 🔝✔️✔️9953056974 Low Rate Call Girls In Saket, Delhi NCR
 
Call Girls in Pitampura Delhi 💯Call Us 🔝8264348440🔝
Call Girls in Pitampura Delhi 💯Call Us 🔝8264348440🔝Call Girls in Pitampura Delhi 💯Call Us 🔝8264348440🔝
Call Girls in Pitampura Delhi 💯Call Us 🔝8264348440🔝soniya singh
 
Call Girls in Nehru Place Delhi 💯Call Us 🔝8264348440🔝
Call Girls in Nehru Place Delhi 💯Call Us 🔝8264348440🔝Call Girls in Nehru Place Delhi 💯Call Us 🔝8264348440🔝
Call Girls in Nehru Place Delhi 💯Call Us 🔝8264348440🔝soniya singh
 
Dynamic Netsoft A leader In Property management Software
Dynamic Netsoft A leader In Property management SoftwareDynamic Netsoft A leader In Property management Software
Dynamic Netsoft A leader In Property management SoftwareDynamic Netsoft
 
Call Girls In Mundka Industrial Metro@꧂8447779280 ↬Enjoy ꧂Escort Service in ...
Call Girls In Mundka Industrial Metro@꧂8447779280 ↬Enjoy ꧂Escort Service in  ...Call Girls In Mundka Industrial Metro@꧂8447779280 ↬Enjoy ꧂Escort Service in  ...
Call Girls In Mundka Industrial Metro@꧂8447779280 ↬Enjoy ꧂Escort Service in ...asmaqueen5
 
83770-87607 ŰžCall Girls In Near The Park Hotel (Cp) Delhi
83770-87607 ŰžCall Girls In Near The Park Hotel (Cp) Delhi83770-87607 ŰžCall Girls In Near The Park Hotel (Cp) Delhi
83770-87607 ŰžCall Girls In Near The Park Hotel (Cp) Delhidollysharma2066
 
Call Girls in Model Town Delhi 💯Call Us 🔝8264348440🔝
Call Girls in Model Town Delhi 💯Call Us 🔝8264348440🔝Call Girls in Model Town Delhi 💯Call Us 🔝8264348440🔝
Call Girls in Model Town Delhi 💯Call Us 🔝8264348440🔝soniya singh
 

Recently uploaded (20)

What Is Biophilic Design .pdf
What Is Biophilic Design            .pdfWhat Is Biophilic Design            .pdf
What Is Biophilic Design .pdf
 
Low Rate Call Girls in Triveni Complex Delhi Call 9873940964
Low Rate Call Girls in Triveni Complex Delhi Call 9873940964Low Rate Call Girls in Triveni Complex Delhi Call 9873940964
Low Rate Call Girls in Triveni Complex Delhi Call 9873940964
 
Call Girls in Kashmiri Gate Delhi 💯Call Us 🔝8264348440🔝
Call Girls in Kashmiri Gate Delhi 💯Call Us 🔝8264348440🔝Call Girls in Kashmiri Gate Delhi 💯Call Us 🔝8264348440🔝
Call Girls in Kashmiri Gate Delhi 💯Call Us 🔝8264348440🔝
 
Rustomjee The Panorama At Pali Hill, Bandra West, Mumbai - Brochure.pdf
Rustomjee The Panorama At Pali Hill, Bandra West, Mumbai - Brochure.pdfRustomjee The Panorama At Pali Hill, Bandra West, Mumbai - Brochure.pdf
Rustomjee The Panorama At Pali Hill, Bandra West, Mumbai - Brochure.pdf
 
The Omaxe State Dwarka Delhi-broucher.pdf.pdf
The Omaxe State Dwarka Delhi-broucher.pdf.pdfThe Omaxe State Dwarka Delhi-broucher.pdf.pdf
The Omaxe State Dwarka Delhi-broucher.pdf.pdf
 
Call Girls In Vasundhara Ghaziabad ❤️8860477959 Low Rate Escorts Service In 2...
Call Girls In Vasundhara Ghaziabad ❤️8860477959 Low Rate Escorts Service In 2...Call Girls In Vasundhara Ghaziabad ❤️8860477959 Low Rate Escorts Service In 2...
Call Girls In Vasundhara Ghaziabad ❤️8860477959 Low Rate Escorts Service In 2...
 
Call Girls in Sarai Kale Khan Delhi 💯Call Us 🔝8264348440🔝
Call Girls in Sarai Kale Khan Delhi 💯Call Us 🔝8264348440🔝Call Girls in Sarai Kale Khan Delhi 💯Call Us 🔝8264348440🔝
Call Girls in Sarai Kale Khan Delhi 💯Call Us 🔝8264348440🔝
 
Call Girls In Peeragarhi, Delhi↫8447779280↬Call Girls in Peeragarhi Delhi NCR
Call Girls In Peeragarhi, Delhi↫8447779280↬Call Girls in Peeragarhi Delhi NCRCall Girls In Peeragarhi, Delhi↫8447779280↬Call Girls in Peeragarhi Delhi NCR
Call Girls In Peeragarhi, Delhi↫8447779280↬Call Girls in Peeragarhi Delhi NCR
 
Low Rate Call Girls in Tughlakabad Delhi Call 9990771857
Low Rate Call Girls in Tughlakabad Delhi Call 9990771857Low Rate Call Girls in Tughlakabad Delhi Call 9990771857
Low Rate Call Girls in Tughlakabad Delhi Call 9990771857
 
9990771857 Call Girls in Noida Sector 10 Noida (Call Girls) Delhi
9990771857 Call Girls in Noida Sector 10 Noida (Call Girls) Delhi9990771857 Call Girls in Noida Sector 10 Noida (Call Girls) Delhi
9990771857 Call Girls in Noida Sector 10 Noida (Call Girls) Delhi
 
Namrata 7 Plumeria Drive Pimpri Chinchwad Pune Brochure.pdf
Namrata 7 Plumeria Drive Pimpri Chinchwad Pune Brochure.pdfNamrata 7 Plumeria Drive Pimpri Chinchwad Pune Brochure.pdf
Namrata 7 Plumeria Drive Pimpri Chinchwad Pune Brochure.pdf
 
Low Rate Call Girls in Akshardham Delhi Call 9990771857
Low Rate Call Girls in Akshardham   Delhi Call 9990771857Low Rate Call Girls in Akshardham   Delhi Call 9990771857
Low Rate Call Girls in Akshardham Delhi Call 9990771857
 
call girls in Shahdara (DELHI) 🔝 >༒9953330565🔝 genuine Escort Service 🔝✔️✔️
call girls in Shahdara (DELHI) 🔝 >༒9953330565🔝 genuine Escort Service 🔝✔️✔️call girls in Shahdara (DELHI) 🔝 >༒9953330565🔝 genuine Escort Service 🔝✔️✔️
call girls in Shahdara (DELHI) 🔝 >༒9953330565🔝 genuine Escort Service 🔝✔️✔️
 
Call Girls in Pitampura Delhi 💯Call Us 🔝8264348440🔝
Call Girls in Pitampura Delhi 💯Call Us 🔝8264348440🔝Call Girls in Pitampura Delhi 💯Call Us 🔝8264348440🔝
Call Girls in Pitampura Delhi 💯Call Us 🔝8264348440🔝
 
Call Girls in Nehru Place Delhi 💯Call Us 🔝8264348440🔝
Call Girls in Nehru Place Delhi 💯Call Us 🔝8264348440🔝Call Girls in Nehru Place Delhi 💯Call Us 🔝8264348440🔝
Call Girls in Nehru Place Delhi 💯Call Us 🔝8264348440🔝
 
Dynamic Netsoft A leader In Property management Software
Dynamic Netsoft A leader In Property management SoftwareDynamic Netsoft A leader In Property management Software
Dynamic Netsoft A leader In Property management Software
 
Call Girls In Mundka Industrial Metro@꧂8447779280 ↬Enjoy ꧂Escort Service in ...
Call Girls In Mundka Industrial Metro@꧂8447779280 ↬Enjoy ꧂Escort Service in  ...Call Girls In Mundka Industrial Metro@꧂8447779280 ↬Enjoy ꧂Escort Service in  ...
Call Girls In Mundka Industrial Metro@꧂8447779280 ↬Enjoy ꧂Escort Service in ...
 
9953056974 Low Rate Call Girls In Saket, Delhi NCR
9953056974 Low Rate Call Girls In Saket, Delhi NCR9953056974 Low Rate Call Girls In Saket, Delhi NCR
9953056974 Low Rate Call Girls In Saket, Delhi NCR
 
83770-87607 ŰžCall Girls In Near The Park Hotel (Cp) Delhi
83770-87607 ŰžCall Girls In Near The Park Hotel (Cp) Delhi83770-87607 ŰžCall Girls In Near The Park Hotel (Cp) Delhi
83770-87607 ŰžCall Girls In Near The Park Hotel (Cp) Delhi
 
Call Girls in Model Town Delhi 💯Call Us 🔝8264348440🔝
Call Girls in Model Town Delhi 💯Call Us 🔝8264348440🔝Call Girls in Model Town Delhi 💯Call Us 🔝8264348440🔝
Call Girls in Model Town Delhi 💯Call Us 🔝8264348440🔝
 

Rebgv stats-pkg-september-2018