SlideShare a Scribd company logo
1 of 9
Download to read offline
News Release
FOR IMMEDIATE RELEASE:
Reduced demand is allowing housing supply to accumulate
VANCOUVER, BC – June 4, 2018 – Home buyer demand continues to decline across the
Metro Vancouver* housing market.
The Real Estate Board of Greater Vancouver (REBGV) reports that residential property sales in
the region totalled 2,833 in May 2018, a 35.1 per cent decrease from the 4,364 sales recorded in
May 2017, and a 9.8 per cent increase compared to April 2018 when 2,579 homes sold.
Last month’s sales were 19.3 per cent below the 10-year May sales average.
“With fewer homes selling today compared to recent years, the number of homes available for
sale is rising,” Phil Moore, REBGV president said. “The selection of homes for sale in Metro
Vancouver has risen to the highest levels we’ve seen in the last two years, yet supply is still
below our long-term historical averages.”
There were 6,375 detached, attached and apartment properties newly listed for sale on the
Multiple Listing Service® (MLS®) in Metro Vancouver in May 2018. This represents a 5.5 per
cent increase compared to the 6,044 homes listed in May 2017 and a 9.5 per cent increase
compared to April 2018 when 5,820 homes were listed.
The total number of properties currently listed for sale on the MLS® system in Metro Vancouver
is 11,292, a 38.2 per cent increase compared to May 2017 (8,168) and a 15 per cent increase
compared to April 2018 (9,822).
The total number of listings available today is 17.2 per cent below the 10-year May average.
For all property types, the sales-to-active listings ratio for May 2018 is 25.1 per cent. By
property type, the ratio is 14.7 per cent for detached homes, 30.8 per cent for townhomes, and
41.7 per cent for condominiums.
Generally, analysts say that downward pressure on home prices occurs when the ratio dips below
the 12 per cent mark for a sustained period, while home prices often experience upward pressure
when it surpasses 20 per cent over several months.
“For home sellers to be successful in today’s market, it’s important to price your property
competitively given the shifting dynamics we’re experiencing,” Moore said. “It’s also important
to work with your local Realtor to better understand these changing conditions.”
The MLS® Home Price Index composite benchmark price for all residential properties in Metro
Vancouver is currently $1,094,000. This is an 11.5 per cent increase over May 2017 and a 0.2
per cent increase compared to April 2018.
Sales of detached properties in May 2018 reached 926, a 40.2 per cent decrease from the 1,548
detached sales recorded in May 2017. The benchmark price for detached properties is
$1,608,000. This is a 2.4 per cent increase from May 2017 and a 0.1 per cent increase compared
to April 2018.
Sales of apartment properties reached 1,431 in May 2018, a 29.3 per cent decrease from the
2,025 sales in May 2017. The benchmark price of an apartment property is $701,700. This is a
20.2 per cent increase from May 2017 and a 0.1 per cent increase compared to April 2018.
Attached property sales in May 2018 totalled 476, a 39.8 per cent decrease from the 791 sales in
May 2017. The benchmark price of an attached unit is $859,500. This represents a 16 per cent
increase from May 2017 and a 0.6 per cent increase compared to April 2018.
-30-
*Editor’s Note: Areas covered by the Real Estate Board of Greater Vancouver include: Whistler, Sunshine Coast,
Squamish, West Vancouver, North Vancouver, Vancouver, Burnaby, New Westminster, Richmond, Port Moody,
Port Coquitlam, Coquitlam, Pitt Meadows, Maple Ridge, and South Delta.
The real estate industry is a key economic driver in British Columbia. In 2017, 35,993 homes changed ownership in
the Board’s area, generating $2.4 billion in economic spin-off activity and an estimated 17,600 jobs. The total dollar
value of residential sales transacted through the MLS® system in Greater Vancouver totalled $37 billion in 2017.
The Real Estate Board of Greater Vancouver is an association representing more than 14,000 REALTORS® and
their companies. The Board provides a variety of member services, including the Multiple Listing Service®. For
more information on real estate, statistics, and buying or selling a home, contact a local REALTOR® or visit
www.rebgv.org.
For more information please contact:
Craig Munn
Manager, Communication
Real Estate Board of Greater Vancouver
604.730.3146
cmunn@rebgv.org
Property Type Area
Benchmark
Price
Price
Index
1 Month
Change %
3 Month
Change %
6 Month
Change %
1 Year
Change %
3 Year
Change %
5 Year
Change %
10 Year
Change %
Residential / Composite Lower Mainland $1,006,200 283.9 0.5% 2.9% 6.4% 14.4% 64.9% 85.0% 92.5%
Greater Vancouver $1,094,000 286.0 0.2% 2.1% 4.5% 11.5% 58.2% 81.4% 91.9%
Bowen Island $1,050,300 227.7 5.8% 7.8% 8.4% 20.6% 74.9% 89.1% 65.6%
Burnaby East $1,007,700 280.3 0.0% 3.1% 5.8% 11.5% 55.2% 78.0% 89.8%
Burnaby North $945,900 285.6 0.6% 1.5% 5.8% 12.1% 62.2% 84.0% 91.5%
Burnaby South $1,055,800 298.2 1.1% 1.8% 5.4% 12.0% 62.5% 86.6% 102.2%
Coquitlam $983,700 291.8 1.1% 4.0% 7.1% 16.2% 69.2% 97.3% 99.9%
Ladner $877,100 246.2 0.0% 1.3% 0.5% 6.9% 42.2% 64.7% 71.7%
Maple Ridge $747,900 251.5 0.1% 4.1% 9.0% 20.9% 78.7% 90.1% 77.5%
New Westminster $734,800 315.0 1.4% 6.0% 12.1% 24.3% 84.0% 96.5% 105.3%
North Vancouver $1,141,000 256.4 -0.3% 2.8% 3.6% 8.7% 51.6% 73.8% 78.8%
Pitt Meadows $754,000 275.8 0.1% 6.2% 11.0% 25.4% 77.1% 99.7% 89.2%
Port Coquitlam $791,500 279.2 0.8% 4.9% 8.2% 18.1% 74.9% 98.3% 87.5%
Port Moody $985,200 272.3 1.1% 3.9% 7.8% 18.2% 70.1% 93.4% 90.4%
Richmond $1,025,000 299.3 -1.2% 0.5% 4.2% 9.6% 57.6% 79.4% 99.8%
Squamish $874,900 280.1 -1.1% 6.6% 6.9% 20.8% 84.3% 129.6% 104.2%
Sunshine Coast $635,100 222.5 3.0% 7.9% 7.2% 17.9% 72.7% 90.3% 60.6%
Tsawwassen $1,020,900 256.4 -0.3% 2.5% 0.7% 7.1% 48.2% 72.8% 76.5%
Vancouver East $1,114,700 326.4 0.1% 0.8% 2.4% 8.4% 57.3% 83.5% 110.9%
Vancouver West $1,378,200 290.6 0.4% 0.2% 1.3% 6.4% 47.5% 72.6% 89.7%
West Vancouver $2,588,700 278.3 -1.2% -2.6% -1.7% 0.3% 34.8% 65.7% 82.5%
Whistler $1,039,200 228.5 -1.3% 5.8% 6.8% 25.3% 81.5% 125.8% 69.3%
Single Family Detached Lower Mainland $1,346,200 285.6 0.5% 1.3% 1.9% 5.8% 53.0% 78.5% 98.1%
Greater Vancouver $1,608,000 295.5 0.1% 0.4% 0.0% 2.4% 45.1% 74.7% 100.5%
Bowen Island $1,050,300 227.7 5.8% 7.8% 8.4% 20.6% 74.9% 89.1% 65.6%
Burnaby East $1,314,800 294.0 -1.2% 2.6% 3.8% 6.2% 49.8% 74.5% 102.3%
Burnaby North $1,575,100 304.6 -1.3% 2.8% 0.7% 0.8% 40.6% 74.1% 104.8%
Burnaby South $1,671,100 319.9 -0.3% -0.7% -0.9% -0.7% 42.1% 73.5% 120.5%
Coquitlam $1,319,800 292.9 1.1% 3.3% 2.8% 7.1% 56.1% 86.9% 104.0%
Ladner $1,002,300 241.6 -0.2% -0.2% -3.2% 3.1% 36.9% 62.8% 71.8%
Maple Ridge $875,800 249.5 0.8% 3.3% 7.5% 15.2% 75.2% 89.7% 81.2%
New Westminster $1,177,000 293.6 -1.3% 1.5% 3.2% 5.9% 51.8% 76.0% 101.5%
North Vancouver $1,708,500 267.2 0.3% 1.3% 0.6% 1.4% 45.1% 77.7% 87.4%
Pitt Meadows $950,300 267.8 0.8% 4.2% 7.3% 15.3% 68.9% 91.6% 91.1%
Port Coquitlam $1,049,400 279.8 1.2% 6.4% 4.9% 7.7% 61.6% 91.3% 94.6%
Port Moody $1,529,200 282.4 1.3% 3.1% 1.9% 7.1% 54.8% 83.6% 94.2%
Richmond $1,665,100 334.4 -1.2% -1.9% -0.4% 0.9% 47.3% 77.2% 118.4%
Squamish $1,042,900 266.2 1.8% 5.0% 3.0% 12.2% 76.1% 117.8% 95.6%
Sunshine Coast $631,400 221.2 2.7% 7.9% 7.3% 17.9% 72.8% 89.9% 59.7%
Tsawwassen $1,264,600 272.3 -0.1% 1.2% -1.4% 4.6% 49.0% 79.7% 87.7%
Vancouver East $1,543,600 341.2 0.0% -1.1% -1.9% 2.0% 44.2% 84.4% 131.2%
Vancouver West $3,430,500 352.2 0.8% -2.0% -4.0% -4.4% 34.2% 65.7% 115.3%
West Vancouver $3,020,100 285.1 -1.1% -3.9% -4.0% -2.4% 30.5% 63.8% 84.2%
Whistler $1,675,900 212.5 -0.2% -0.2% -0.9% 8.4% 63.3% 89.4% 56.7%
HOW TO READ THE TABLE:
• Benchmark Price: Estimated sale price of a benchmark property. Benchmarks represent a typical property within each market.
• Price Index: Index numbers estimate the percentage change in price on typical and constant quality properties over time. All figures are based on past sales.
• x Month/Year Change %: Percentage change of index over a period of x month(s)/year(s) *
In January 2005, the indexes are set to 100.
Townhome properties are similar to Attached properties, a category that was used in the previous MLSLink HPI, but do not included duplexes.
The above info is deemed reliable, but is not guaranteed. All dollar amounts in CDN.
May 2018*
* MLS®, Multiple Listing Service®, and all related graphics are trademarks of The Canadian Real Estate Association 1 of 15
Property Type Area
Benchmark
Price
Price
Index
1 Month
Change %
3 Month
Change %
6 Month
Change %
1 Year
Change %
3 Year
Change %
5 Year
Change %
10 Year
Change %
May 2018*
Townhouse Lower Mainland $727,100 262.8 0.8% 4.7% 7.9% 17.6% 68.9% 82.6% 81.9%
Greater Vancouver $859,500 277.3 0.6% 4.9% 6.7% 16.0% 65.3% 84.1% 89.7%
Burnaby East $724,200 267.5 3.6% 5.7% 10.4% 18.7% 64.0% 74.7% 83.3%
Burnaby North $767,300 286.4 1.3% 2.0% 7.8% 13.7% 63.9% 79.9% 91.1%
Burnaby South $841,000 289.7 0.7% 4.1% 10.6% 14.1% 65.9% 85.2% 97.7%
Coquitlam $705,100 258.7 0.5% 3.6% 7.2% 15.8% 64.6% 83.1% 82.6%
Ladner $787,500 274.6 0.2% 0.5% 4.1% 8.6% 54.3% 74.6% 82.1%
Maple Ridge $580,500 269.5 -0.8% 5.3% 8.9% 24.9% 85.7% 94.0% 84.8%
New Westminster $734,900 290.6 2.7% 3.1% 7.7% 16.1% 65.2% 80.3% 96.9%
North Vancouver $1,035,500 251.6 0.4% 3.7% 5.3% 9.2% 62.0% 76.1% 80.2%
Pitt Meadows $642,000 277.8 1.1% 9.3% 10.3% 24.2% 78.6% 101.5% 89.8%
Port Coquitlam $691,600 260.9 0.4% 5.4% 8.7% 18.7% 71.3% 89.6% 80.1%
Port Moody $685,000 231.5 3.4% 6.2% 10.4% 22.1% 54.7% 70.5% 60.5%
Richmond $846,300 278.1 0.9% 3.3% 5.1% 11.5% 57.9% 74.4% 90.7%
Squamish $935,000 339.7 -0.3% 10.2% 5.9% 28.7% 100.4% 187.6% 143.9%
Tsawwassen $775,900 289.0 -0.7% 2.6% 2.9% 10.4% 61.4% 79.1% 91.6%
Vancouver East $925,800 303.9 -0.8% 6.6% 7.4% 16.2% 63.4% 77.0% 92.7%
Vancouver West $1,304,500 288.1 0.2% 4.3% 2.9% 8.5% 56.7% 80.6% 92.2%
Whistler $1,109,400 296.7 1.6% 11.7% 6.3% 33.6% 86.8% 156.7% 119.5%
Apartment Lower Mainland $667,400 291.8 0.4% 4.0% 11.1% 25.0% 82.8% 95.3% 90.5%
Greater Vancouver $701,700 282.0 0.1% 2.8% 8.3% 20.2% 74.1% 88.9% 86.0%
Burnaby East $715,900 271.8 -2.1% 1.3% 7.1% 20.5% 63.7% 91.1% 70.6%
Burnaby North $650,200 277.6 1.5% 1.2% 9.4% 21.9% 85.2% 97.2% 86.1%
Burnaby South $729,000 292.7 1.8% 2.7% 8.1% 19.4% 79.0% 96.3% 95.8%
Coquitlam $550,900 302.3 1.3% 4.9% 11.6% 27.7% 92.5% 118.9% 99.1%
Ladner $471,200 223.3 -0.3% 6.3% 8.7% 19.0% 43.3% 53.9% 53.9%
Maple Ridge $325,500 235.1 -1.1% 5.8% 16.4% 44.2% 87.2% 88.5% 50.9%
New Westminster $568,300 323.9 2.0% 7.4% 15.1% 31.5% 99.8% 105.5% 106.8%
North Vancouver $603,600 245.7 -1.4% 3.9% 6.5% 18.6% 60.7% 69.3% 68.8%
Pitt Meadows $479,600 283.5 -1.3% 6.1% 15.9% 41.6% 85.9% 108.3% 82.0%
Port Coquitlam $483,300 289.0 0.4% 3.3% 10.9% 29.0% 95.1% 112.8% 82.2%
Port Moody $693,000 288.8 0.1% 3.7% 11.3% 26.9% 95.7% 113.6% 106.6%
Richmond $670,700 286.3 -2.0% 2.0% 9.4% 21.4% 78.0% 89.6% 91.1%
Squamish $516,800 248.9 -5.1% 5.9% 15.1% 28.4% 88.1% 106.2% 81.3%
Tsawwassen $507,500 214.0 -1.2% 7.8% 8.5% 19.0% 49.3% 57.7% 47.5%
Vancouver East $575,800 317.7 0.2% 1.9% 6.6% 15.9% 78.7% 86.6% 93.2%
Vancouver West $845,400 274.3 0.4% 1.1% 4.2% 13.3% 60.3% 80.3% 82.4%
West Vancouver $1,280,600 259.4 -1.2% 3.5% 10.9% 15.2% 69.0% 76.6% 78.9%
Whistler $566,700 185.8 -5.0% 3.6% 13.8% 29.5% 106.4% 146.7% 38.1%
HOW TO READ THE TABLE:
• Benchmark Price: Estimated sale price of a benchmark property. Benchmarks represent a typical property within each market.
• Price Index: Index numbers estimate the percentage change in price on typical and constant quality properties over time. All figures are based on past sales.
• x Month/Year Change %: Percentage change of index over a period of x month(s)/year(s)
In January 2005, the indexes are set to 100. *
Townhome properties are similar to attached properties, a category that was used in the previous MLSLink HPI, but do not included duplexes.
Lower Mainland includes areas serviced by both Real Estate Board of Greater Vancouver & Fraser Valley Real Estate Board.
The above info is deemed reliable, but is not guaranteed. All dollar amounts in CDN.
* MLS®, Multiple Listing Service®, and all related graphics are trademarks of The Canadian Real Estate Association 2 of 15
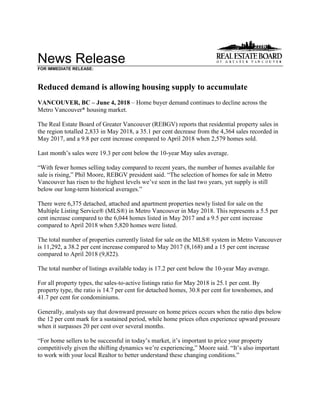
C:DATAMonthEndHpiexporthi_resgv-hpi2.tifGreaterVancouver
5YearTrend
60
110
160
210
260
310
May 2013
Jul 2013
Sep 2013
Nov 2013
Jan 2014
Mar 2014
May 2014
Jul 2014
Sep 2014
Nov 2014
Jan 2015
Mar 2015
May 2015
Jul 2015
Sep 2015
Nov 2015
Jan 2016
Mar 2016
May 2016
Jul 2016
Sep 2016
Nov 2016
Jan 2017
Mar 2017
May 2017
Jul 2017
Sep 2017
Nov 2017
Jan 2018
Mar 2018
May 2018
Price
Index
ResidentialDetachedTownhouseApartment
Jan2005HPI=100
5252018MLS®
SALESFacts
Burnaby
Coquitlam
Delta-South
Islands-Gulf
MapleRidge/PittMeadows
NewWestminster
NorthVancouver
PortCoquitlam
PortMoody/Belcarra
Richmond
Squamish
SunshineCoast
VancouverEast
VancouverWest
WestVancouver/HoweSound
Whistler/Pemberton
Detached78744771062390371688156814191387926
Attached493712042144023207819154655422476
Apartment174901207495107432718925717535621361,431
Detached$1,588,000$1,360,000$1,141,000n/a$875,000$1,365,000$1,684,000$1,040,000n/a$1,725,000n/a$649,950$1,623,000$3,200,000$2,850,000n/a
Attached$770,000$775,000n/an/a$590,000n/a$969,500$775,000$838,000$877,000n/an/a$1,099,900$1,530,000n/a$834,950n/a
Apartment$614,000$575,500n/an/a$408,750$488,000$678,000$446,000$600,000$600,000$450,000n/a$645,000$793,500$1,388,900$340,000
Detached547745412327773421652442103683211807
Attached6031805013421916791795347416464
Apartment160921705593101481716712714235020271,308
Detached$1,575,000$1,310,000$1,175,000n/a$908,000$1,180,000$1,675,000$1,030,000$1,420,000$1,680,000$1,050,000$622,500$1,650,000$2,970,000$2,655,000n/a
Attached$809,900$870,000n/an/a$579,950n/a$1,040,000n/an/a$850,000n/an/a$1,136,000$1,315,000n/an/an/a
Apartment$599,000$608,180n/an/a$380,000$535,000$650,000$453,000n/a$618,000n/an/a$620,000$845,000$1,053,750$388,500
Detached116144702184371396830167378219918763231,548
Attached10576150852450433314029185480831791
Apartment27713919091166135604225532921252628342,025
Detached$1,673,500$1,320,250$1,150,000n/a$825,000$1,180,000$1,698,000$992,000$1,382,500$1,750,000$922,500$619,000$1,650,000$3,402,906$3,280,000$1,575,000
Attached$776,000$741,500n/an/a$480,000$724,500$1,001,200$645,000$660,000$835,000$593,000n/a$1,034,500$1,450,000n/a$885,000n/a
Apartment$579,000$479,500n/an/a$329,900$452,500$650,000$369,950$565,500$478,000$386,750n/a$525,750$760,000$1,065,000$350,000
Detached290345170185011033221425534888225449311135613,563
Attached26215244122067159107763518045205209191092,106
Apartment74044073032943748719913180569346671,630901546,285
Detached$1,650,000$1,335,000$1,140,000n/a$883,750$1,270,000$1,725,000$1,028,000$1,425,000$1,700,000$985,000$629,000$1,620,000$3,235,000$2,842,500$1,975,000
Attached$779,000$807,500$698,500n/a$565,000$778,000$998,000$708,000$776,500$868,000$681,500$439,900$1,124,900$1,450,000n/a$1,149,000n/a
Apartment$603,000$560,000$549,900n/a$390,000$515,000$670,000$446,750$609,000$595,400$444,900$404,150$629,000$840,000$1,265,550$394,250
Detached4074572432158210946920394622133284629520243825,098
Attached304229771301841661348748610753187270351362,657
Apartment9805758503535505202321801,06089487501,9981061627,688
Detached$1,600,000$1,255,000$1,080,000$523,000$778,000$1,117,500$1,726,500$917,000$1,307,000$1,652,500$885,000$580,000$1,552,500$3,310,000$3,300,000$1,857,500
Attached$761,900$725,000$679,900n/a$463,900$660,150$976,500$583,450$600,000$806,000$589,900$365,900$968,000$1,347,500$2,025,000$740,000n/a
Apartment$521,500$467,000$515,000n/a$310,000$440,000$580,100$345,000$498,450$470,000$375,000$334,950$522,450$729,950$1,020,000$348,000
Note:MedianSellingPricesarenotreportedforareaswithlessthan20salesorfortheGulfIslands
Number
of
Sales
May
2018
Number
of
Sales
Median
Selling
Price
Number
of
Sales
Median
Selling
Price
Number
of
Sales
Median
Selling
Price
April
2018
May
2017
Jan.-
May.2018
Jan.-
May.2017
Median
Selling
Price
Number
of
Sales
Median
Selling
Price
May
2018
Year-to-date
Year-to-date
5252018MLS®
LISTINGSFacts
Burnaby
Coquitlam
Delta-South
Islands-Gulf
MapleRidge/PittMeadows
NewWestminster
NorthVancouver
PortCoquitlam
PortMoody/Belcarra
Richmond
Squamish
SunshineCoast
VancouverEast
VancouverWest
WestVancouver/HoweSound
Whistler/Pemberton
Detached23521211412238542491094931755126321267233262,617
Attached10972182931684442618437129916120411,018
Apartment30421435088188192814635332630582839292,740
Detached33%35%41%58%45%43%36%34%33%28%27%54%44%34%16%27%
Attached45%51%67%0%45%88%48%52%77%42%51%125%46%34%20%54%n/a
Apartment57%42%34%n/a84%51%56%53%59%54%78%117%57%43%54%124%
Detached240206122921561243823825750108337296202222,488
Attached10472182793167333513929211051291726907
Apartment279173330108143168673828435927273440422,425
Detached23%37%37%44%57%44%32%41%55%25%48%39%31%23%16%50%
Attached58%43%44%0%63%42%63%58%46%57%59%43%50%36%24%62%n/a
Apartment57%53%52%n/a51%65%60%72%45%59%34%78%52%48%50%64%
Detached2572391021827958270984730260111319279198382,675
Attached1417015177326151301593213941121236936
Apartment333174220801581657157333351225368431252,433
Detached45%60%69%11%66%64%51%69%64%55%62%74%62%67%32%61%
Attached74%109%100%0%110%75%82%84%110%88%91%138%57%71%67%86%n/a
Apartment83%80%86%n/a114%105%82%85%74%77%91%75%84%77%90%136%
Detached952844491458982119403231601,3062234711,2851,30983610810,402
Attached462286721034210528016812065912169416557791713,917
Apartment1,13769814403956457452791851,347127391,1083,11617620410,345
Detached30%41%35%40%56%49%34%44%34%27%39%48%35%24%16%56%
Attached57%53%61%10%64%64%57%64%63%53%66%65%49%38%24%64%n/a
Apartment65%63%51%n/a83%68%65%71%71%60%54%87%60%52%51%75%
Detached942805469488921788593061671,3552254511,2681,19079511510,065
Attached47828385434211922717410566014765325435691513,669
Apartment1,28470011004126456822992301,259101479922,6961481809,785
Detached43%57%52%44%65%61%55%66%56%46%59%63%50%44%31%71%
Attached64%81%91%25%88%71%73%77%83%74%73%82%58%62%51%90%n/a
Apartment76%82%77%n/a86%85%76%78%78%84%88%102%76%74%72%90%
*Year-to-datelistingsrepresentacumulativetotaloflistingsratherthantotalactivelistings.
%Salesto
Listings
Number
of
Listings
%Salesto
Listings
April
2018
May
2017
Jan.-
May.2018
Jan.-
May.2017
%Salesto
Listings
Number
of
Listings
%Salesto
Listings
Number
of
Listings
May
2018
Number
of
Listings
%Salesto
Listings
Number
of
Listings
May
2018
Year-to-date*
Year-to-date*
Listing & Sales Activity Summary
Listings Sales
1 2 3 Col. 2 & 3 5 6 7 Col. 6 & 7 9 10 Col. 9 & 10
May Apr May Percentage May Apr May Percentage Mar 2017 - Mar 2018 - Percentage
2017 2018 2018 Variance 2017 2018 2018 Variance May 2017 May 2018 Variance
BURNABY % % %
DETACHED 257 240 235 -2.1 116 54 78 44.4 320 182 -43.1
ATTACHED 141 104 109 4.8 105 60 49 -18.3 241 167 -30.7
APARTMENTS 333 279 304 9.0 277 160 174 8.8 735 484 -34.1
COQUITLAM
DETACHED 239 206 212 2.9 144 77 74 -3.9 356 229 -35.7
ATTACHED 70 72 72 0.0 76 31 37 19.4 180 103 -42.8
APARTMENTS 174 173 214 23.7 139 92 90 -2.2 418 273 -34.7
DELTA
DETACHED 102 122 114 -6.6 70 45 47 4.4 189 126 -33.3
ATTACHED 15 18 18 0.0 15 8 12 50.0 46 29 -37.0
APARTMENTS 22 33 35 6.1 19 17 12 -29.4 59 49 -16.9
MAPLE RIDGE/PITT MEADOWS
DETACHED 279 215 238 10.7 184 123 106 -13.8 446 342 -23.3
ATTACHED 77 79 93 17.7 85 50 42 -16.0 220 139 -36.8
APARTMENTS 80 108 88 -18.5 91 55 74 34.5 279 182 -34.8
NORTH VANCOUVER
DETACHED 270 243 249 2.5 139 77 90 16.9 347 234 -32.6
ATTACHED 61 67 84 25.4 50 42 40 -4.8 120 112 -6.7
APARTMENTS 165 168 192 14.3 135 101 107 5.9 367 325 -11.4
NEW WESTMINSTER
DETACHED 58 61 54 -11.5 37 27 23 -14.8 91 70 -23.1
ATTACHED 32 31 16 -48.4 24 13 14 7.7 65 42 -35.4
APARTMENTS 158 143 188 31.5 166 93 95 2.2 416 299 -28.1
PORT MOODY/BELCARRA
DETACHED 47 38 49 28.9 30 21 16 -23.8 74 44 -40.5
ATTACHED 30 35 26 -25.7 33 16 20 25.0 68 53 -22.1
APARTMENTS 57 38 46 21.1 42 17 27 58.8 127 77 -39.4
PORT COQUITLAM
DETACHED 98 82 109 32.9 68 34 37 8.8 162 102 -37.0
ATTACHED 51 33 44 33.3 43 19 23 21.1 104 72 -30.8
APARTMENTS 71 67 81 20.9 60 48 43 -10.4 164 132 -19.5
RICHMOND
DETACHED 302 257 317 23.3 167 65 88 35.4 475 230 -51.6
ATTACHED 159 139 184 32.4 140 79 78 -1.3 370 224 -39.5
APARTMENTS 333 284 353 24.3 255 167 189 13.2 760 517 -32.0
SUNSHINE COAST
DETACHED 111 108 126 16.7 82 42 68 61.9 208 154 -26.0
ATTACHED 13 21 12 -42.9 18 9 15 66.7 37 33 -10.8
APARTMENTS 12 9 6 -33.3 9 7 7 0.0 26 24 -7.7
SQUAMISH
DETACHED 60 50 55 10.0 37 24 15 -37.5 101 64 -36.6
ATTACHED 32 29 37 27.6 29 17 19 11.8 82 50 -39.0
APARTMENTS 35 35 32 -8.6 32 12 25 108.3 67 45 -32.8
VANCOUVER EAST
DETACHED 319 337 321 -4.7 199 103 141 36.9 496 327 -34.1
ATTACHED 94 105 99 -5.7 54 53 46 -13.2 147 143 -2.7
APARTMENTS 253 272 305 12.1 212 142 175 23.2 556 473 -14.9
VANCOUVER WEST
DETACHED 279 296 267 -9.8 187 68 91 33.8 391 212 -45.8
ATTACHED 112 129 161 24.8 80 47 55 17.0 206 141 -31.6
APARTMENTS 684 734 828 12.8 526 350 356 1.7 1418 1055 -25.6
WHISTLER/PEMBERTON
DETACHED 38 22 26 18.2 23 11 7 -36.4 52 27 -48.1
ATTACHED 36 26 41 57.7 31 16 22 37.5 87 68 -21.8
APARTMENTS 25 42 29 -31.0 34 27 36 33.3 119 98 -17.6
WEST VANCOUVER/HOWE SOUND
DETACHED 198 202 233 15.3 63 32 38 18.8 188 96 -48.9
ATTACHED 12 17 20 17.6 8 4 4 0.0 26 10 -61.5
APARTMENTS 31 40 39 -2.5 28 20 21 5.0 77 55 -28.6
GRAND TOTALS
DETACHED 2657 2479 2605 5.1 1546 803 919 14.4 3896 2439 -37.4
ATTACHED 935 905 1016 12.3 791 464 476 2.6 1999 1386 -30.7
APARTMENTS 2433 2425 2740 13.0 2025 1308 1431 9.4 5588 4088 -26.8
ResidentialAverageSalePrices-January1977toMay2018
0
200
400
600
800
1000
1200
1400
1600
1800
2000
1977
1978
1979
1980
1981
1982
1983
1984
1985
1986
1987
1988
1989
1990
1991
1992
1993
1994
1995
1996
1997
1998
1999
2000
2001
2002
2003
2004
2005
2006
2007
2008
2009
2010
2011
2012
2013
2014
2015
2016
2017
2018
DETACHEDCONDOMINIUMATTACHEDAPARTMENTS
INTHOUSANDS($)
NOTE:From1977-1984condominiumaverageswerenotseparatedintoattached&apartment.
$939,572
$722,566
$1,786,580

More Related Content

What's hot

Rebgv stats-pkg-february-2020
Rebgv stats-pkg-february-2020Rebgv stats-pkg-february-2020
Rebgv stats-pkg-february-2020Vicky Aulakh
 
REBGV Statistics package July 2020
REBGV Statistics package July 2020REBGV Statistics package July 2020
REBGV Statistics package July 2020Vicky Aulakh
 
Real Estate Board of Greater Vancouver Statistics Package August 2021
Real Estate Board of Greater Vancouver Statistics Package August 2021Real Estate Board of Greater Vancouver Statistics Package August 2021
Real Estate Board of Greater Vancouver Statistics Package August 2021Vicky Aulakh
 
Rebgv stats-pkg-february-2018
Rebgv stats-pkg-february-2018Rebgv stats-pkg-february-2018
Rebgv stats-pkg-february-2018Kathryn Huang
 
REBGV Statistics Package April 2021
REBGV Statistics Package April 2021REBGV Statistics Package April 2021
REBGV Statistics Package April 2021Vicky Aulakh
 
REBGV Statistics Package August 2020
REBGV Statistics Package August 2020REBGV Statistics Package August 2020
REBGV Statistics Package August 2020Vicky Aulakh
 
Rebgv stats-pkg-july-2019
Rebgv stats-pkg-july-2019Rebgv stats-pkg-july-2019
Rebgv stats-pkg-july-2019Vicky Aulakh
 
May 2021 Real Estate Board of Greater Vancouver Statistics Package
May 2021 Real Estate Board of Greater Vancouver Statistics PackageMay 2021 Real Estate Board of Greater Vancouver Statistics Package
May 2021 Real Estate Board of Greater Vancouver Statistics PackageVicky Aulakh
 
Rebgv stats-pkg-august-2019
Rebgv stats-pkg-august-2019Rebgv stats-pkg-august-2019
Rebgv stats-pkg-august-2019Vicky Aulakh
 
Real Estate Board of Greater Vancouver Statistics Package - November 2021
Real Estate Board of Greater Vancouver Statistics Package - November 2021Real Estate Board of Greater Vancouver Statistics Package - November 2021
Real Estate Board of Greater Vancouver Statistics Package - November 2021VickyAulakh1
 
May 2017 REBGV Stats
May 2017 REBGV Stats May 2017 REBGV Stats
May 2017 REBGV Stats Mike Stewart
 
2021 June - REBGV Statistics Package
2021 June - REBGV Statistics Package2021 June - REBGV Statistics Package
2021 June - REBGV Statistics PackageVicky Aulakh
 
Real Estate Board of Greater Vancouver Statistics Package October 2021
Real Estate Board of Greater Vancouver Statistics Package October 2021Real Estate Board of Greater Vancouver Statistics Package October 2021
Real Estate Board of Greater Vancouver Statistics Package October 2021VickyAulakh1
 
August 2017 REBGV Stats Mike Stewart Realtor
August 2017 REBGV Stats Mike Stewart RealtorAugust 2017 REBGV Stats Mike Stewart Realtor
August 2017 REBGV Stats Mike Stewart RealtorMike Stewart
 
Rebgv stats-pkg-march-2019
Rebgv stats-pkg-march-2019Rebgv stats-pkg-march-2019
Rebgv stats-pkg-march-2019Kathryn Huang
 
Rebgv stats-pkg-april-2019
Rebgv stats-pkg-april-2019Rebgv stats-pkg-april-2019
Rebgv stats-pkg-april-2019Kathryn Huang
 
Rebgv stats-pkg-may-2019
Rebgv stats-pkg-may-2019Rebgv stats-pkg-may-2019
Rebgv stats-pkg-may-2019Kathryn Huang
 
REBGV Statistics Package May 2020
REBGV Statistics Package May 2020REBGV Statistics Package May 2020
REBGV Statistics Package May 2020Vicky Aulakh
 
REBGV January 2020 Statistics Package
REBGV January 2020 Statistics Package REBGV January 2020 Statistics Package
REBGV January 2020 Statistics Package Vicky Aulakh
 
March 2017 Rebgv Stats Package Mike Stewart
March 2017 Rebgv Stats Package Mike StewartMarch 2017 Rebgv Stats Package Mike Stewart
March 2017 Rebgv Stats Package Mike StewartMike Stewart
 

What's hot (20)

Rebgv stats-pkg-february-2020
Rebgv stats-pkg-february-2020Rebgv stats-pkg-february-2020
Rebgv stats-pkg-february-2020
 
REBGV Statistics package July 2020
REBGV Statistics package July 2020REBGV Statistics package July 2020
REBGV Statistics package July 2020
 
Real Estate Board of Greater Vancouver Statistics Package August 2021
Real Estate Board of Greater Vancouver Statistics Package August 2021Real Estate Board of Greater Vancouver Statistics Package August 2021
Real Estate Board of Greater Vancouver Statistics Package August 2021
 
Rebgv stats-pkg-february-2018
Rebgv stats-pkg-february-2018Rebgv stats-pkg-february-2018
Rebgv stats-pkg-february-2018
 
REBGV Statistics Package April 2021
REBGV Statistics Package April 2021REBGV Statistics Package April 2021
REBGV Statistics Package April 2021
 
REBGV Statistics Package August 2020
REBGV Statistics Package August 2020REBGV Statistics Package August 2020
REBGV Statistics Package August 2020
 
Rebgv stats-pkg-july-2019
Rebgv stats-pkg-july-2019Rebgv stats-pkg-july-2019
Rebgv stats-pkg-july-2019
 
May 2021 Real Estate Board of Greater Vancouver Statistics Package
May 2021 Real Estate Board of Greater Vancouver Statistics PackageMay 2021 Real Estate Board of Greater Vancouver Statistics Package
May 2021 Real Estate Board of Greater Vancouver Statistics Package
 
Rebgv stats-pkg-august-2019
Rebgv stats-pkg-august-2019Rebgv stats-pkg-august-2019
Rebgv stats-pkg-august-2019
 
Real Estate Board of Greater Vancouver Statistics Package - November 2021
Real Estate Board of Greater Vancouver Statistics Package - November 2021Real Estate Board of Greater Vancouver Statistics Package - November 2021
Real Estate Board of Greater Vancouver Statistics Package - November 2021
 
May 2017 REBGV Stats
May 2017 REBGV Stats May 2017 REBGV Stats
May 2017 REBGV Stats
 
2021 June - REBGV Statistics Package
2021 June - REBGV Statistics Package2021 June - REBGV Statistics Package
2021 June - REBGV Statistics Package
 
Real Estate Board of Greater Vancouver Statistics Package October 2021
Real Estate Board of Greater Vancouver Statistics Package October 2021Real Estate Board of Greater Vancouver Statistics Package October 2021
Real Estate Board of Greater Vancouver Statistics Package October 2021
 
August 2017 REBGV Stats Mike Stewart Realtor
August 2017 REBGV Stats Mike Stewart RealtorAugust 2017 REBGV Stats Mike Stewart Realtor
August 2017 REBGV Stats Mike Stewart Realtor
 
Rebgv stats-pkg-march-2019
Rebgv stats-pkg-march-2019Rebgv stats-pkg-march-2019
Rebgv stats-pkg-march-2019
 
Rebgv stats-pkg-april-2019
Rebgv stats-pkg-april-2019Rebgv stats-pkg-april-2019
Rebgv stats-pkg-april-2019
 
Rebgv stats-pkg-may-2019
Rebgv stats-pkg-may-2019Rebgv stats-pkg-may-2019
Rebgv stats-pkg-may-2019
 
REBGV Statistics Package May 2020
REBGV Statistics Package May 2020REBGV Statistics Package May 2020
REBGV Statistics Package May 2020
 
REBGV January 2020 Statistics Package
REBGV January 2020 Statistics Package REBGV January 2020 Statistics Package
REBGV January 2020 Statistics Package
 
March 2017 Rebgv Stats Package Mike Stewart
March 2017 Rebgv Stats Package Mike StewartMarch 2017 Rebgv Stats Package Mike Stewart
March 2017 Rebgv Stats Package Mike Stewart
 

Similar to Rebgv stats-pkg-may-2018

Rebgv stats-pkg-august-2018
Rebgv stats-pkg-august-2018Rebgv stats-pkg-august-2018
Rebgv stats-pkg-august-2018Kathryn Huang
 
Rebgv stats-pkg-june-2019
Rebgv stats-pkg-june-2019Rebgv stats-pkg-june-2019
Rebgv stats-pkg-june-2019Vicky Aulakh
 
Rebgv stats-pkg-september-2018
Rebgv stats-pkg-september-2018Rebgv stats-pkg-september-2018
Rebgv stats-pkg-september-2018Kathryn Huang
 
November 2017 rebgv stats mike stewart real estate agent
November 2017 rebgv stats mike stewart real estate agentNovember 2017 rebgv stats mike stewart real estate agent
November 2017 rebgv stats mike stewart real estate agentMike Stewart
 
Rebgv stats-pkg-november-2019-f
Rebgv stats-pkg-november-2019-fRebgv stats-pkg-november-2019-f
Rebgv stats-pkg-november-2019-fVicky Aulakh
 
Rebgv Stats Package September 2020
Rebgv Stats Package September 2020Rebgv Stats Package September 2020
Rebgv Stats Package September 2020Vicky Aulakh
 
Rebgv stats-pkg-october-2018 .pdf
Rebgv stats-pkg-october-2018 .pdf Rebgv stats-pkg-october-2018 .pdf
Rebgv stats-pkg-october-2018 .pdf Kathryn Huang
 
Rebgv stats-pkg-march-2019
Rebgv stats-pkg-march-2019Rebgv stats-pkg-march-2019
Rebgv stats-pkg-march-2019Sherryl Jacobs
 
July 2017 Real Estate Board of Greater Vancouver Stats Package Mike Stewart r...
July 2017 Real Estate Board of Greater Vancouver Stats Package Mike Stewart r...July 2017 Real Estate Board of Greater Vancouver Stats Package Mike Stewart r...
July 2017 Real Estate Board of Greater Vancouver Stats Package Mike Stewart r...Mike Stewart
 
REBGV STATS PACKAGE JULY 2017
REBGV STATS PACKAGE JULY 2017REBGV STATS PACKAGE JULY 2017
REBGV STATS PACKAGE JULY 2017Marcella Riccardi
 
Rebgv stats-pkg-september-2019
Rebgv stats-pkg-september-2019Rebgv stats-pkg-september-2019
Rebgv stats-pkg-september-2019Vicky Aulakh
 
REBGV September 2016 Stats Package Mike Stewart Vancouver Realtor
REBGV September 2016 Stats Package Mike Stewart Vancouver RealtorREBGV September 2016 Stats Package Mike Stewart Vancouver Realtor
REBGV September 2016 Stats Package Mike Stewart Vancouver RealtorMike Stewart
 
Real Estate Board of Greater Vancouver Statistics Package January 2021
Real Estate Board of Greater Vancouver Statistics Package January 2021 Real Estate Board of Greater Vancouver Statistics Package January 2021
Real Estate Board of Greater Vancouver Statistics Package January 2021 Vicky Aulakh
 
REBGV Statistics Package June 2020
REBGV Statistics Package June 2020REBGV Statistics Package June 2020
REBGV Statistics Package June 2020Vicky Aulakh
 
Rebgv stats-pkg-february-2019
Rebgv stats-pkg-february-2019Rebgv stats-pkg-february-2019
Rebgv stats-pkg-february-2019Kathryn Huang
 
Rebgv stats-pkg-february-2019
Rebgv stats-pkg-february-2019Rebgv stats-pkg-february-2019
Rebgv stats-pkg-february-2019Sherryl Jacobs
 

Similar to Rebgv stats-pkg-may-2018 (17)

Rebgv stats-pkg-august-2018
Rebgv stats-pkg-august-2018Rebgv stats-pkg-august-2018
Rebgv stats-pkg-august-2018
 
Rebgv stats-pkg-june-2019
Rebgv stats-pkg-june-2019Rebgv stats-pkg-june-2019
Rebgv stats-pkg-june-2019
 
Rebgv stats-pkg-september-2018
Rebgv stats-pkg-september-2018Rebgv stats-pkg-september-2018
Rebgv stats-pkg-september-2018
 
November 2017 rebgv stats mike stewart real estate agent
November 2017 rebgv stats mike stewart real estate agentNovember 2017 rebgv stats mike stewart real estate agent
November 2017 rebgv stats mike stewart real estate agent
 
Rebgv stats-pkg-november-2019-f
Rebgv stats-pkg-november-2019-fRebgv stats-pkg-november-2019-f
Rebgv stats-pkg-november-2019-f
 
Rebgv stats-pkg-october-2020
Rebgv stats-pkg-october-2020Rebgv stats-pkg-october-2020
Rebgv stats-pkg-october-2020
 
Rebgv Stats Package September 2020
Rebgv Stats Package September 2020Rebgv Stats Package September 2020
Rebgv Stats Package September 2020
 
Rebgv stats-pkg-october-2018 .pdf
Rebgv stats-pkg-october-2018 .pdf Rebgv stats-pkg-october-2018 .pdf
Rebgv stats-pkg-october-2018 .pdf
 
Rebgv stats-pkg-march-2019
Rebgv stats-pkg-march-2019Rebgv stats-pkg-march-2019
Rebgv stats-pkg-march-2019
 
July 2017 Real Estate Board of Greater Vancouver Stats Package Mike Stewart r...
July 2017 Real Estate Board of Greater Vancouver Stats Package Mike Stewart r...July 2017 Real Estate Board of Greater Vancouver Stats Package Mike Stewart r...
July 2017 Real Estate Board of Greater Vancouver Stats Package Mike Stewart r...
 
REBGV STATS PACKAGE JULY 2017
REBGV STATS PACKAGE JULY 2017REBGV STATS PACKAGE JULY 2017
REBGV STATS PACKAGE JULY 2017
 
Rebgv stats-pkg-september-2019
Rebgv stats-pkg-september-2019Rebgv stats-pkg-september-2019
Rebgv stats-pkg-september-2019
 
REBGV September 2016 Stats Package Mike Stewart Vancouver Realtor
REBGV September 2016 Stats Package Mike Stewart Vancouver RealtorREBGV September 2016 Stats Package Mike Stewart Vancouver Realtor
REBGV September 2016 Stats Package Mike Stewart Vancouver Realtor
 
Real Estate Board of Greater Vancouver Statistics Package January 2021
Real Estate Board of Greater Vancouver Statistics Package January 2021 Real Estate Board of Greater Vancouver Statistics Package January 2021
Real Estate Board of Greater Vancouver Statistics Package January 2021
 
REBGV Statistics Package June 2020
REBGV Statistics Package June 2020REBGV Statistics Package June 2020
REBGV Statistics Package June 2020
 
Rebgv stats-pkg-february-2019
Rebgv stats-pkg-february-2019Rebgv stats-pkg-february-2019
Rebgv stats-pkg-february-2019
 
Rebgv stats-pkg-february-2019
Rebgv stats-pkg-february-2019Rebgv stats-pkg-february-2019
Rebgv stats-pkg-february-2019
 

More from Kathryn Huang

Disclosureof representationintradingservices english-recbc (4)
Disclosureof representationintradingservices english-recbc (4)Disclosureof representationintradingservices english-recbc (4)
Disclosureof representationintradingservices english-recbc (4)Kathryn Huang
 
Property disclosure statement strata title properties mike stewart prec
Property disclosure statement strata title properties mike stewart precProperty disclosure statement strata title properties mike stewart prec
Property disclosure statement strata title properties mike stewart precKathryn Huang
 
Privacy noticeandconsent (3)
Privacy noticeandconsent (3)Privacy noticeandconsent (3)
Privacy noticeandconsent (3)Kathryn Huang
 
Rebgv stats-pkg-january-2019
Rebgv stats-pkg-january-2019Rebgv stats-pkg-january-2019
Rebgv stats-pkg-january-2019Kathryn Huang
 
Rebgv stats-pkg-december-2018
Rebgv stats-pkg-december-2018Rebgv stats-pkg-december-2018
Rebgv stats-pkg-december-2018Kathryn Huang
 
Broadway corridor-planning-program-presentation-may-2018
Broadway corridor-planning-program-presentation-may-2018Broadway corridor-planning-program-presentation-may-2018
Broadway corridor-planning-program-presentation-may-2018Kathryn Huang
 
2018 03-metro-vancouver
2018 03-metro-vancouver 2018 03-metro-vancouver
2018 03-metro-vancouver Kathryn Huang
 
2017 Real Estate Board of Greater Vancouver Statistics Package with Charts & ...
2017 Real Estate Board of Greater Vancouver Statistics Package with Charts & ...2017 Real Estate Board of Greater Vancouver Statistics Package with Charts & ...
2017 Real Estate Board of Greater Vancouver Statistics Package with Charts & ...Kathryn Huang
 

More from Kathryn Huang (10)

Disclosureof representationintradingservices english-recbc (4)
Disclosureof representationintradingservices english-recbc (4)Disclosureof representationintradingservices english-recbc (4)
Disclosureof representationintradingservices english-recbc (4)
 
Property disclosure statement strata title properties mike stewart prec
Property disclosure statement strata title properties mike stewart precProperty disclosure statement strata title properties mike stewart prec
Property disclosure statement strata title properties mike stewart prec
 
2516 bc
2516 bc2516 bc
2516 bc
 
Privacy noticeandconsent (3)
Privacy noticeandconsent (3)Privacy noticeandconsent (3)
Privacy noticeandconsent (3)
 
Rebgv stats-pkg-january-2019
Rebgv stats-pkg-january-2019Rebgv stats-pkg-january-2019
Rebgv stats-pkg-january-2019
 
Rebgv stats-pkg-december-2018
Rebgv stats-pkg-december-2018Rebgv stats-pkg-december-2018
Rebgv stats-pkg-december-2018
 
2440 bc
2440 bc2440 bc
2440 bc
 
Broadway corridor-planning-program-presentation-may-2018
Broadway corridor-planning-program-presentation-may-2018Broadway corridor-planning-program-presentation-may-2018
Broadway corridor-planning-program-presentation-may-2018
 
2018 03-metro-vancouver
2018 03-metro-vancouver 2018 03-metro-vancouver
2018 03-metro-vancouver
 
2017 Real Estate Board of Greater Vancouver Statistics Package with Charts & ...
2017 Real Estate Board of Greater Vancouver Statistics Package with Charts & ...2017 Real Estate Board of Greater Vancouver Statistics Package with Charts & ...
2017 Real Estate Board of Greater Vancouver Statistics Package with Charts & ...
 

Recently uploaded

)_Call Girls In Radisson Blu Plaza Hotel, Delhi Airport ❤️8860477959 _Indepen...
)_Call Girls In Radisson Blu Plaza Hotel, Delhi Airport ❤️8860477959 _Indepen...)_Call Girls In Radisson Blu Plaza Hotel, Delhi Airport ❤️8860477959 _Indepen...
)_Call Girls In Radisson Blu Plaza Hotel, Delhi Airport ❤️8860477959 _Indepen...lizamodels9
 
Choose Noida's Leading Architect
Choose    Noida's    Leading   ArchitectChoose    Noida's    Leading   Architect
Choose Noida's Leading ArchitectMM Design Studio
 
Call Girls In Mayur Vihar-1 Delhi ❤️8860477959 Good Looking Escorts In 24/7 D...
Call Girls In Mayur Vihar-1 Delhi ❤️8860477959 Good Looking Escorts In 24/7 D...Call Girls In Mayur Vihar-1 Delhi ❤️8860477959 Good Looking Escorts In 24/7 D...
Call Girls In Mayur Vihar-1 Delhi ❤️8860477959 Good Looking Escorts In 24/7 D...lizamodels9
 
Low Rate Call Girls in Triveni Complex Delhi Call 9990771857
Low Rate Call Girls in Triveni Complex Delhi Call 9990771857Low Rate Call Girls in Triveni Complex Delhi Call 9990771857
Low Rate Call Girls in Triveni Complex Delhi Call 9990771857delhimodel235
 
Call Girls in Pitampura Delhi 💯Call Us 🔝8264348440🔝
Call Girls in Pitampura Delhi 💯Call Us 🔝8264348440🔝Call Girls in Pitampura Delhi 💯Call Us 🔝8264348440🔝
Call Girls in Pitampura Delhi 💯Call Us 🔝8264348440🔝soniya singh
 
Low Rate Call Girls in Tughlakabad Delhi Call 9990771857
Low Rate Call Girls in Tughlakabad Delhi Call 9990771857Low Rate Call Girls in Tughlakabad Delhi Call 9990771857
Low Rate Call Girls in Tughlakabad Delhi Call 9990771857delhimodel235
 
Call Girls in Khan Market 9654467111 ESCORTS SERVICE
Call Girls in Khan Market 9654467111 ESCORTS SERVICECall Girls in Khan Market 9654467111 ESCORTS SERVICE
Call Girls in Khan Market 9654467111 ESCORTS SERVICESapana Sha
 
Purva Palm Hills Devanahalli, Bangalore E- Brochure.pdf
Purva Palm Hills Devanahalli, Bangalore E- Brochure.pdfPurva Palm Hills Devanahalli, Bangalore E- Brochure.pdf
Purva Palm Hills Devanahalli, Bangalore E- Brochure.pdffaheemali990101
 
9990771857 Call Girls in Noida Sector 34 Noida (Call Girls) Delhi
9990771857 Call Girls in Noida Sector 34 Noida (Call Girls) Delhi9990771857 Call Girls in Noida Sector 34 Noida (Call Girls) Delhi
9990771857 Call Girls in Noida Sector 34 Noida (Call Girls) Delhidelhimodel235
 
83770-87607 ۞Call Girls In Near The Park Hotel (Cp) Delhi
83770-87607 ۞Call Girls In Near The Park Hotel (Cp) Delhi83770-87607 ۞Call Girls In Near The Park Hotel (Cp) Delhi
83770-87607 ۞Call Girls In Near The Park Hotel (Cp) Delhidollysharma2066
 
8 Key Elements for Comfortable Farmland Living
8 Key Elements for Comfortable Farmland Living 8 Key Elements for Comfortable Farmland Living
8 Key Elements for Comfortable Farmland Living Farmland Bazaar
 
SSPL The Strand Abodes Kharadi Pune Brochure.pdf
SSPL The Strand Abodes Kharadi Pune Brochure.pdfSSPL The Strand Abodes Kharadi Pune Brochure.pdf
SSPL The Strand Abodes Kharadi Pune Brochure.pdfabbu831446
 
call girls in Shahdara (DELHI) 🔝 >༒9953330565🔝 genuine Escort Service 🔝✔️✔️
call girls in Shahdara (DELHI) 🔝 >༒9953330565🔝 genuine Escort Service 🔝✔️✔️call girls in Shahdara (DELHI) 🔝 >༒9953330565🔝 genuine Escort Service 🔝✔️✔️
call girls in Shahdara (DELHI) 🔝 >༒9953330565🔝 genuine Escort Service 🔝✔️✔️9953056974 Low Rate Call Girls In Saket, Delhi NCR
 
Nanke Area Estate commercial ( Dir. Kat Kuo)
Nanke Area Estate commercial ( Dir. Kat Kuo)Nanke Area Estate commercial ( Dir. Kat Kuo)
Nanke Area Estate commercial ( Dir. Kat Kuo)jessica288382
 
SVN Live 4.22.24 Weekly Property Broadcast
SVN Live 4.22.24 Weekly Property BroadcastSVN Live 4.22.24 Weekly Property Broadcast
SVN Live 4.22.24 Weekly Property BroadcastSVN International Corp.
 
Shapoorji Pallonji Parkwest Sequoia Tower Bangalore.pdf
Shapoorji Pallonji Parkwest Sequoia Tower Bangalore.pdfShapoorji Pallonji Parkwest Sequoia Tower Bangalore.pdf
Shapoorji Pallonji Parkwest Sequoia Tower Bangalore.pdfashiyadav24
 
9990771857 Call Girls in Noida Sector 10 Noida (Call Girls) Delhi
9990771857 Call Girls in Noida Sector 10 Noida (Call Girls) Delhi9990771857 Call Girls in Noida Sector 10 Noida (Call Girls) Delhi
9990771857 Call Girls in Noida Sector 10 Noida (Call Girls) Delhidelhimodel235
 
9990771857 Call Girls in Noida Sector 11 Noida (Call Girls) Delhi
9990771857 Call Girls in Noida Sector 11 Noida (Call Girls) Delhi9990771857 Call Girls in Noida Sector 11 Noida (Call Girls) Delhi
9990771857 Call Girls in Noida Sector 11 Noida (Call Girls) Delhidelhimodel235
 
Call Girls In Madipur Metro Delhi꧁ +91)8447779280꧂Low Rate 2 short 2000 full ...
Call Girls In Madipur Metro Delhi꧁ +91)8447779280꧂Low Rate 2 short 2000 full ...Call Girls In Madipur Metro Delhi꧁ +91)8447779280꧂Low Rate 2 short 2000 full ...
Call Girls In Madipur Metro Delhi꧁ +91)8447779280꧂Low Rate 2 short 2000 full ...asmaqueen5
 
9990771857 Call Girls in Noida Sector 06 Noida (Call Girls) Delhi
9990771857 Call Girls in Noida Sector 06 Noida (Call Girls) Delhi9990771857 Call Girls in Noida Sector 06 Noida (Call Girls) Delhi
9990771857 Call Girls in Noida Sector 06 Noida (Call Girls) Delhidelhimodel235
 

Recently uploaded (20)

)_Call Girls In Radisson Blu Plaza Hotel, Delhi Airport ❤️8860477959 _Indepen...
)_Call Girls In Radisson Blu Plaza Hotel, Delhi Airport ❤️8860477959 _Indepen...)_Call Girls In Radisson Blu Plaza Hotel, Delhi Airport ❤️8860477959 _Indepen...
)_Call Girls In Radisson Blu Plaza Hotel, Delhi Airport ❤️8860477959 _Indepen...
 
Choose Noida's Leading Architect
Choose    Noida's    Leading   ArchitectChoose    Noida's    Leading   Architect
Choose Noida's Leading Architect
 
Call Girls In Mayur Vihar-1 Delhi ❤️8860477959 Good Looking Escorts In 24/7 D...
Call Girls In Mayur Vihar-1 Delhi ❤️8860477959 Good Looking Escorts In 24/7 D...Call Girls In Mayur Vihar-1 Delhi ❤️8860477959 Good Looking Escorts In 24/7 D...
Call Girls In Mayur Vihar-1 Delhi ❤️8860477959 Good Looking Escorts In 24/7 D...
 
Low Rate Call Girls in Triveni Complex Delhi Call 9990771857
Low Rate Call Girls in Triveni Complex Delhi Call 9990771857Low Rate Call Girls in Triveni Complex Delhi Call 9990771857
Low Rate Call Girls in Triveni Complex Delhi Call 9990771857
 
Call Girls in Pitampura Delhi 💯Call Us 🔝8264348440🔝
Call Girls in Pitampura Delhi 💯Call Us 🔝8264348440🔝Call Girls in Pitampura Delhi 💯Call Us 🔝8264348440🔝
Call Girls in Pitampura Delhi 💯Call Us 🔝8264348440🔝
 
Low Rate Call Girls in Tughlakabad Delhi Call 9990771857
Low Rate Call Girls in Tughlakabad Delhi Call 9990771857Low Rate Call Girls in Tughlakabad Delhi Call 9990771857
Low Rate Call Girls in Tughlakabad Delhi Call 9990771857
 
Call Girls in Khan Market 9654467111 ESCORTS SERVICE
Call Girls in Khan Market 9654467111 ESCORTS SERVICECall Girls in Khan Market 9654467111 ESCORTS SERVICE
Call Girls in Khan Market 9654467111 ESCORTS SERVICE
 
Purva Palm Hills Devanahalli, Bangalore E- Brochure.pdf
Purva Palm Hills Devanahalli, Bangalore E- Brochure.pdfPurva Palm Hills Devanahalli, Bangalore E- Brochure.pdf
Purva Palm Hills Devanahalli, Bangalore E- Brochure.pdf
 
9990771857 Call Girls in Noida Sector 34 Noida (Call Girls) Delhi
9990771857 Call Girls in Noida Sector 34 Noida (Call Girls) Delhi9990771857 Call Girls in Noida Sector 34 Noida (Call Girls) Delhi
9990771857 Call Girls in Noida Sector 34 Noida (Call Girls) Delhi
 
83770-87607 ۞Call Girls In Near The Park Hotel (Cp) Delhi
83770-87607 ۞Call Girls In Near The Park Hotel (Cp) Delhi83770-87607 ۞Call Girls In Near The Park Hotel (Cp) Delhi
83770-87607 ۞Call Girls In Near The Park Hotel (Cp) Delhi
 
8 Key Elements for Comfortable Farmland Living
8 Key Elements for Comfortable Farmland Living 8 Key Elements for Comfortable Farmland Living
8 Key Elements for Comfortable Farmland Living
 
SSPL The Strand Abodes Kharadi Pune Brochure.pdf
SSPL The Strand Abodes Kharadi Pune Brochure.pdfSSPL The Strand Abodes Kharadi Pune Brochure.pdf
SSPL The Strand Abodes Kharadi Pune Brochure.pdf
 
call girls in Shahdara (DELHI) 🔝 >༒9953330565🔝 genuine Escort Service 🔝✔️✔️
call girls in Shahdara (DELHI) 🔝 >༒9953330565🔝 genuine Escort Service 🔝✔️✔️call girls in Shahdara (DELHI) 🔝 >༒9953330565🔝 genuine Escort Service 🔝✔️✔️
call girls in Shahdara (DELHI) 🔝 >༒9953330565🔝 genuine Escort Service 🔝✔️✔️
 
Nanke Area Estate commercial ( Dir. Kat Kuo)
Nanke Area Estate commercial ( Dir. Kat Kuo)Nanke Area Estate commercial ( Dir. Kat Kuo)
Nanke Area Estate commercial ( Dir. Kat Kuo)
 
SVN Live 4.22.24 Weekly Property Broadcast
SVN Live 4.22.24 Weekly Property BroadcastSVN Live 4.22.24 Weekly Property Broadcast
SVN Live 4.22.24 Weekly Property Broadcast
 
Shapoorji Pallonji Parkwest Sequoia Tower Bangalore.pdf
Shapoorji Pallonji Parkwest Sequoia Tower Bangalore.pdfShapoorji Pallonji Parkwest Sequoia Tower Bangalore.pdf
Shapoorji Pallonji Parkwest Sequoia Tower Bangalore.pdf
 
9990771857 Call Girls in Noida Sector 10 Noida (Call Girls) Delhi
9990771857 Call Girls in Noida Sector 10 Noida (Call Girls) Delhi9990771857 Call Girls in Noida Sector 10 Noida (Call Girls) Delhi
9990771857 Call Girls in Noida Sector 10 Noida (Call Girls) Delhi
 
9990771857 Call Girls in Noida Sector 11 Noida (Call Girls) Delhi
9990771857 Call Girls in Noida Sector 11 Noida (Call Girls) Delhi9990771857 Call Girls in Noida Sector 11 Noida (Call Girls) Delhi
9990771857 Call Girls in Noida Sector 11 Noida (Call Girls) Delhi
 
Call Girls In Madipur Metro Delhi꧁ +91)8447779280꧂Low Rate 2 short 2000 full ...
Call Girls In Madipur Metro Delhi꧁ +91)8447779280꧂Low Rate 2 short 2000 full ...Call Girls In Madipur Metro Delhi꧁ +91)8447779280꧂Low Rate 2 short 2000 full ...
Call Girls In Madipur Metro Delhi꧁ +91)8447779280꧂Low Rate 2 short 2000 full ...
 
9990771857 Call Girls in Noida Sector 06 Noida (Call Girls) Delhi
9990771857 Call Girls in Noida Sector 06 Noida (Call Girls) Delhi9990771857 Call Girls in Noida Sector 06 Noida (Call Girls) Delhi
9990771857 Call Girls in Noida Sector 06 Noida (Call Girls) Delhi
 

Rebgv stats-pkg-may-2018