SlideShare a Scribd company logo
1 of 9
Download to read offline
News Release
FOR IMMEDIATE RELEASE:
Reduced demand and increased supply remain the trend across
Metro Vancouver’s housing market
VANCOUVER, BC – May 2, 2019 – Decreased demand continues to allow the supply of
homes for sale to accumulate across the Metro Vancouver* housing market.
The Real Estate Board of Greater Vancouver (REBGV) reports that residential home sales in the
region totalled 1,829 in April 2019, a 29.1 per cent decrease from the 2,579 sales recorded in
April 2018, and a 5.9 per cent increase from the 1,727 homes sold in March 2019.
Last month’s sales were 43.1 per cent below the 10-year April sales average.
“Government policy continues to hinder home sale activity. The federal government’s mortgage
stress test has reduced buyers’ purchasing power by about 20 per cent, which is causing people at
the entry-level side of the market to struggle to secure financing,” Ashley Smith, REBGV
president said. “Suppressing housing activity through government policy not only reduces home
sales, it harms the job market, economic growth and creates pent-up demand.”
There were 5,742 detached, attached and apartment properties newly listed for sale on the
Multiple Listing Service® (MLS®) in Metro Vancouver in April 2019. This represents a 1.3 per
cent decrease compared to the 5,820 homes listed in April 2018 and a 16 per cent increase
compared to March 2019 when 4,949 homes were listed.
The total number of homes currently listed for sale on the MLS® in Metro Vancouver is 14,357,
a 46.2 per cent increase compared to April 2018 (9,822) and a 12.4 per cent increase compared to
March 2019 (12,774).
“There are more homes for sale in our market today than we’ve seen since October 2014. This
trend is more about reduced demand than increased supply,” Smith said. “The number of new
listings coming on the market each month are consistent with our long-term averages. It’s the
reduced sales activity that’s allowing listings to accumulate.”
The overall sales-to-active listings ratio for April 2019 is 12.7 per cent. By property type, the
ratio is 9.4 per cent for detached homes, 15.4 per cent for townhomes, and 15.3 per cent for
apartments.
Generally, analysts say downward pressure on home prices occurs when the ratio dips below 12
per cent for a sustained period, while home prices often experience upward pressure when it
surpasses 20 per cent over several months.
The MLS® Home Price Index composite benchmark price for all residential properties in Metro
Vancouver is currently $1,008,400. This represents an 8.5 per cent decrease over April 2018, and
a 0.3 per cent decrease compared to March 2019.
Detached home sales totalled 586 in April 2019, a 27.4 per cent decrease from the 807 detached
sales in April 2018. The benchmark price for a detached home is $1,425,200. This represents an
11.1 per cent decrease from April 2018, a 0.8 per cent decrease compared to March 2019.
Apartment home sales totalled 885 in April 2019, a 32.3 per cent decrease compared to the 1,308
sales in April 2018. The benchmark price of an apartment is $656,900 in the region. This
represents a 6.9 per cent decrease from April 2018 and is unchanged from March 2019.
Attached home sales totalled 358 in April 2019, a 22.8 per cent decrease compared to the 464
sales in April 2018. The benchmark price of an attached home is $783,300. This represents a 7.5
per cent decrease from April 2018 and is unchanged from March 2019.
-30-
*Editor’s Note: Areas covered by the Real Estate Board of Greater Vancouver include: Burnaby, Coquitlam, Maple
Ridge, New Westminster, North Vancouver, Pitt Meadows, Port Coquitlam, Port Moody, Richmond, South Delta,
Squamish, Sunshine Coast, Vancouver, West Vancouver, and Whistler.
The real estate industry is a key economic driver in British Columbia. In 2018, 24,619 homes changed ownership in
the Board’s area, generating $1.7 billion in economic spin-off activity and an estimated 11,720 jobs. The total dollar
value of residential sales transacted through the MLS® system in Greater Vancouver totalled $26 billion in 2018.
The Real Estate Board of Greater Vancouver is an association representing more than 14,000 REALTORS® and
their companies. The Board provides a variety of member services, including the Multiple Listing Service®. For
more information on real estate, statistics, and buying or selling a home, contact a local REALTOR® or visit
www.rebgv.org.
For more information please contact:
Craig Munn
Manager, Communication
Real Estate Board of Greater Vancouver
604.730.3146
cmunn@rebgv.org
Property Type Area
Benchmark
Price
Price
Index
1 Month
Change %
3 Month
Change %
6 Month
Change %
1 Year
Change %
3 Year
Change %
5 Year
Change %
10 Year
Change %
Residential / Composite Lower Mainland $955,400 262.3 0.0% -0.1% -4.0% -7.1% 23.2% 65.9% 101.2%
Greater Vancouver $1,008,400 261.1 -0.3% -1.1% -5.1% -8.5% 16.8% 59.5% 99.5%
Bowen Island $990,800 214.8 0.3% 2.2% 2.3% -0.2% 45.9% 73.2% 75.5%
Burnaby East $949,700 263.4 1.1% -0.7% -5.3% -8.5% 18.1% 58.8% 101.2%
Burnaby North $871,700 263.2 0.2% -0.3% -4.6% -7.3% 20.5% 63.4% 100.3%
Burnaby South $975,400 275.5 -0.6% -1.4% -4.3% -6.6% 25.5% 66.0% 110.1%
Coquitlam $897,400 266.2 -0.7% -1.6% -4.7% -7.7% 24.3% 72.3% 110.9%
Ladner $824,800 231.5 -0.7% -1.2% -4.8% -6.0% 4.5% 53.1% 77.1%
Maple Ridge $755,300 240.5 0.3% 0.4% -3.5% -6.8% 38.8% 78.8% 90.7%
New Westminster $659,300 289.7 1.5% 0.2% -5.9% -6.6% 37.0% 76.3% 113.6%
North Vancouver $1,019,500 232.4 0.1% 0.0% -4.3% -9.6% 13.1% 54.1% 88.0%
Pitt Meadows $741,900 269.7 -1.1% -2.4% -4.3% -6.5% 47.0% 85.9% 106.4%
Port Coquitlam $741,700 253.9 -0.5% -1.9% -3.2% -8.4% 27.0% 74.4% 94.7%
Port Moody $905,200 250.2 0.0% -0.8% -4.8% -7.1% 25.7% 72.1% 100.8%
Richmond $956,500 275.6 -0.5% -2.0% -5.9% -9.1% 14.6% 58.8% 106.0%
Squamish $773,900 242.9 2.5% 2.0% -0.9% -5.2% 42.4% 94.5% 90.8%
Sunshine Coast $616,200 215.9 1.0% 1.9% 2.8% -0.1% 45.8% 77.1% 73.6%
Tsawwassen $944,900 237.3 1.4% 0.0% -5.2% -7.8% 4.9% 55.8% 84.1%
Vancouver East $1,016,000 297.5 -0.9% -0.9% -5.7% -8.8% 14.4% 59.2% 115.6%
Vancouver West $1,225,000 258.3 -1.2% -3.0% -6.9% -10.7% 5.2% 45.8% 94.4%
West Vancouver $2,212,900 237.9 0.0% -1.1% -6.1% -15.5% -10.5% 33.5% 97.6%
Whistler $927,200 200.8 2.3% 2.8% -1.5% -6.2% 45.6% 99.8% 56.1%
Single Family Detached Lower Mainland $1,225,900 260.2 -0.4% -0.6% -4.6% -8.4% 9.0% 56.6% 104.4%
Greater Vancouver $1,425,200 262.4 -0.8% -1.9% -6.5% -11.1% 1.0% 48.5% 104.0%
Bowen Island $990,800 214.8 0.3% 2.2% 2.3% -0.2% 45.9% 73.2% 75.5%
Burnaby East $1,172,600 262.2 1.5% 0.4% -6.2% -11.9% 4.3% 52.2% 105.5%
Burnaby North $1,391,000 269.0 -1.5% -1.7% -6.5% -12.8% -2.8% 45.2% 105.0%
Burnaby South $1,532,100 293.3 -0.8% -0.1% -6.0% -8.6% 2.7% 53.2% 129.1%
Coquitlam $1,156,200 256.6 -0.5% -3.2% -7.7% -11.4% 6.2% 56.8% 104.8%
Ladner $961,200 231.7 0.7% 1.9% -2.4% -4.3% -1.1% 55.6% 81.4%
Maple Ridge $815,400 232.3 0.2% 1.4% -4.4% -6.1% 30.0% 76.4% 91.7%
New Westminster $1,053,100 262.7 1.4% 0.0% -6.1% -11.7% 4.9% 53.9% 104.4%
North Vancouver $1,499,400 234.5 -0.2% -0.8% -6.0% -12.0% -0.3% 51.2% 93.5%
Pitt Meadows $897,100 252.8 -1.7% -0.5% -1.3% -4.9% 32.6% 80.8% 102.7%
Port Coquitlam $917,000 244.5 -0.4% -2.8% -6.0% -11.6% 7.1% 61.8% 96.1%
Port Moody $1,366,200 252.3 -2.6% -6.1% -8.3% -9.5% 8.6% 53.8% 99.8%
Richmond $1,531,000 296.6 -1.0% -3.2% -6.3% -12.3% -3.2% 51.3% 118.6%
Squamish $985,900 249.2 0.6% 0.3% 1.8% -4.0% 39.5% 89.8% 103.6%
Sunshine Coast $611,400 214.2 1.1% 1.9% 2.3% -0.5% 45.1% 76.9% 72.0%
Tsawwassen $1,181,500 254.4 1.8% 2.5% -4.5% -6.6% 1.3% 61.0% 100.9%
Vancouver East $1,357,200 300.0 -2.4% -5.0% -8.3% -12.1% 0.9% 50.8% 126.1%
Vancouver West $2,948,400 302.7 -2.6% -3.3% -9.8% -13.4% -7.9% 33.8% 118.4%
West Vancouver $2,574,100 243.0 -0.4% -1.9% -6.7% -15.7% -14.3% 30.2% 104.2%
Whistler $1,719,000 219.6 0.8% 0.8% 0.5% -1.9% 38.4% 81.2% 77.8%
HOW TO READ THE TABLE:
• Benchmark Price: Estimated sale price of a benchmark property. Benchmarks represent a typical property within each market.
• Price Index: Index numbers estimate the percentage change in price on typical and constant quality properties over time. All figures are based on past sales.
• x Month/Year Change %: Percentage change of index over a period of x month(s)/year(s) *
In January 2005, the indexes are set to 100.
Townhome properties are similar to Attached properties, a category that was used in the previous MLSLink HPI, but do not included duplexes.
The above info is deemed reliable, but is not guaranteed. All dollar amounts in CDN.
April 2019*
* MLS®, Multiple Listing Service®, and all related graphics are trademarks of The Canadian Real Estate Association 1 of 15
Property Type Area
Benchmark
Price
Price
Index
1 Month
Change %
3 Month
Change %
6 Month
Change %
1 Year
Change %
3 Year
Change %
5 Year
Change %
10 Year
Change %
April 2019*
Townhouse Lower Mainland $667,900 240.9 0.4% -1.1% -4.4% -6.5% 31.4% 65.5% 85.9%
Greater Vancouver $783,300 249.3 0.0% -2.2% -5.5% -7.5% 24.0% 61.7% 89.7%
Burnaby East $656,500 242.5 -2.2% -3.5% -7.8% -6.1% 37.3% 57.0% 83.7%
Burnaby North $708,900 264.6 -2.4% -2.1% -6.9% -6.4% 23.5% 62.7% 95.1%
Burnaby South $769,000 264.9 -1.3% -3.0% -5.2% -7.9% 31.8% 62.7% 97.1%
Coquitlam $662,500 243.1 3.8% -1.5% -2.7% -5.7% 24.3% 65.9% 91.9%
Ladner $704,900 245.8 -3.8% -4.8% -9.1% -10.3% 9.6% 46.4% 79.4%
Maple Ridge $542,600 251.9 1.6% 0.7% -1.9% -7.3% 50.7% 80.4% 90.5%
New Westminster $685,800 271.2 -0.9% -1.5% -5.5% -4.1% 23.5% 64.0% 101.3%
North Vancouver $957,700 232.7 0.5% -2.3% -6.7% -7.1% 21.7% 58.2% 88.4%
Pitt Meadows $603,400 261.1 -1.1% -4.8% -8.8% -5.0% 48.8% 85.6% 98.4%
Port Coquitlam $615,500 233.0 0.3% -3.5% -4.8% -10.5% 22.8% 65.5% 79.0%
Port Moody $661,000 223.4 3.9% 2.7% -2.4% -0.2% 23.8% 61.5% 76.9%
Richmond $780,200 256.4 -1.4% -3.5% -8.4% -7.0% 19.1% 52.9% 93.2%
Squamish $673,900 229.8 2.9% 1.9% -7.0% -4.7% 34.5% 83.1% 80.4%
Tsawwassen $696,400 259.4 -1.2% -4.9% -7.4% -10.9% 14.1% 50.9% 89.3%
Vancouver East $816,500 268.0 -0.6% -3.7% -2.0% -12.5% 12.0% 57.8% 91.0%
Vancouver West $1,167,700 257.9 -1.4% -4.0% -5.3% -10.3% 13.9% 56.9% 97.3%
Whistler $886,000 221.6 1.5% 1.6% -6.9% -4.5% 41.5% 88.4% 73.9%
Apartment Lower Mainland $647,000 273.4 0.2% 0.7% -3.4% -6.3% 43.4% 78.7% 102.8%
Greater Vancouver $656,900 263.6 0.0% -0.3% -3.9% -6.9% 35.0% 70.9% 98.3%
Burnaby East $754,900 289.6 4.5% 1.5% -0.9% -6.3% 36.0% 67.6% 108.2%
Burnaby North $611,800 261.2 1.5% 0.9% -3.1% -4.5% 45.1% 79.3% 101.1%
Burnaby South $679,200 272.7 -0.3% -1.3% -3.2% -5.1% 43.1% 77.5% 106.6%
Coquitlam $511,500 280.7 -2.2% -0.8% -3.3% -5.9% 52.5% 94.4% 120.8%
Ladner $433,800 205.6 0.3% -6.4% -6.7% -8.2% 20.3% 44.8% 52.9%
Maple Ridge $348,600 248.9 -1.1% -3.0% -4.2% -9.6% 56.5% 77.0% 77.3%
New Westminster $525,600 297.8 1.7% 0.2% -6.1% -6.0% 52.6% 84.1% 115.8%
North Vancouver $567,500 227.7 0.1% 1.5% -2.5% -8.6% 32.0% 56.3% 80.4%
Pitt Meadows $490,300 289.1 -0.4% -2.6% -4.8% -10.4% 60.3% 88.3% 105.9%
Port Coquitlam $455,800 272.6 -0.9% -0.6% -0.5% -5.3% 57.2% 91.3% 97.5%
Port Moody $633,000 263.8 -0.3% 0.6% -4.0% -8.6% 46.1% 94.4% 116.1%
Richmond $654,900 273.4 0.2% -0.4% -4.0% -6.5% 46.5% 75.5% 105.9%
Squamish $490,800 236.4 4.6% 4.8% 0.7% -9.8% 51.6% 131.5% 76.7%
Tsawwassen $469,500 198.0 1.0% -5.6% -5.5% -8.6% 27.1% 51.3% 47.2%
Vancouver East $547,900 302.3 0.0% 3.3% -3.7% -4.7% 36.8% 71.6% 108.8%
Vancouver West $764,600 248.1 -0.6% -2.4% -5.6% -9.2% 15.7% 56.3% 88.8%
West Vancouver $1,128,500 228.6 1.1% 1.8% -2.5% -12.9% 24.2% 61.2% 83.0%
Whistler $531,300 174.2 3.9% 5.0% 1.5% -10.9% 61.4% 170.5% 30.7%
HOW TO READ THE TABLE:
• Benchmark Price: Estimated sale price of a benchmark property. Benchmarks represent a typical property within each market.
• Price Index: Index numbers estimate the percentage change in price on typical and constant quality properties over time. All figures are based on past sales.
• x Month/Year Change %: Percentage change of index over a period of x month(s)/year(s)
In January 2005, the indexes are set to 100. *
Townhome properties are similar to attached properties, a category that was used in the previous MLSLink HPI, but do not included duplexes.
Lower Mainland includes areas serviced by both Real Estate Board of Greater Vancouver & Fraser Valley Real Estate Board.
The above info is deemed reliable, but is not guaranteed. All dollar amounts in CDN.
* MLS®, Multiple Listing Service®, and all related graphics are trademarks of The Canadian Real Estate Association 2 of 15
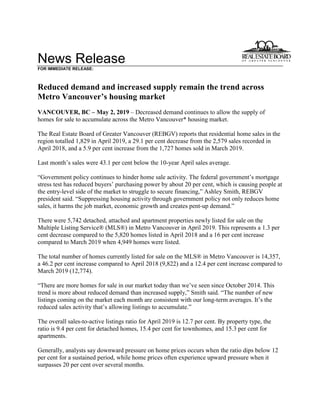
C:DATAMonthEndHpiexporthi_resgv-hpi2.tifGreaterVancouver
5YearTrend
60
110
160
210
260
310
Apr 2014
Jun 2014
Aug 2014
Oct 2014
Dec 2014
Feb 2015
Apr 2015
Jun 2015
Aug 2015
Oct 2015
Dec 2015
Feb 2016
Apr 2016
Jun 2016
Aug 2016
Oct 2016
Dec 2016
Feb 2017
Apr 2017
Jun 2017
Aug 2017
Oct 2017
Dec 2017
Feb 2018
Apr 2018
Jun 2018
Aug 2018
Oct 2018
Dec 2018
Feb 2019
Apr 2019
Price
Index
ResidentialDetachedTownhouseApartment
Jan2005HPI=100
4262019MLS®
SALESFacts
Burnaby
Coquitlam
Delta-South
Islands-Gulf
MapleRidge/PittMeadows
NewWestminster
NorthVancouver
PortCoquitlam
PortMoody/Belcarra
Richmond
Squamish
SunshineCoast
VancouverEast
VancouverWest
WestVancouver/HoweSound
Whistler/Pemberton
Detached536524076145321134122296663388586
Attached352817046931171542983445220358
Apartment1036050288564292989910115233818885
Detached$1,425,000$1,208,000$1,142,500n/a$880,000n/a$1,725,000$915,000n/a$1,490,000$975,000$638,000$1,381,000$2,999,000$2,925,000n/a
Attached$787,500$724,900n/an/a$512,500n/a$1,025,000n/an/a$829,999n/an/a$969,500$1,450,000n/a$1,115,000n/a
Apartment$588,394$530,000n/an/a$362,500$490,000$631,500$410,000$520,000$533,944n/an/a$540,000$733,500n/an/a
Detached364822060117016754163853642311529
Attached433312047522198301922834320325
Apartment1116160326573242394141193235823873
Detached$1,427,000$1,165,000$1,099,750n/a$835,000n/a$1,547,500n/an/a$1,538,500n/a$610,000$1,385,000$2,800,000$2,380,000n/a
Attached$815,000$808,900n/an/a$535,000n/a$976,500n/an/a$856,250n/an/a$950,000$1,200,000n/a$1,190,000n/a
Apartment$574,250$527,000n/an/a$402,500$520,000$600,000$407,750$580,000$540,500n/an/a$558,350$775,000n/a$376,000
Detached547745412327773421652442103683211807
Attached6031805013421916791795347416464
Apartment160921705593101481716712714235020271,308
Detached$1,575,000$1,310,000$1,175,000n/a$908,000$1,180,000$1,675,000$1,030,000$1,420,000$1,680,000$1,050,000$622,500$1,650,000$2,970,000$2,655,000n/a
Attached$809,900$870,000n/an/a$579,950n/a$1,040,000n/an/a$850,000n/an/a$1,136,000$1,315,000n/an/an/a
Apartment$599,000$608,180n/an/a$380,000$535,000$650,000$453,000n/a$618,000n/an/a$620,000$845,000$1,053,750$388,500
Detached145178801123248195673816162122217204104381,902
Attached1311104401593195613312654221061239611,165
Apartment4182283101032472379085338362933778734763,076
Detached$1,440,000$1,175,000$1,050,000n/a$835,000$1,140,000$1,590,000$900,000$1,180,000$1,500,000$1,000,000$599,726$1,350,500$2,800,000$2,332,500$2,092,500
Attached$778,000$761,000$688,800n/a$525,000$715,000$1,010,000$639,900$770,000$829,999$641,000$470,000$969,000$1,270,000n/a$1,170,000n/a
Apartment$573,500$514,000$457,000n/a$369,000$497,000$605,000$404,500$578,500$531,388$444,500$439,900$555,000$748,800$1,082,500$409,500
Detached2122711231139580232105392607315730822097542,637
Attached213115321178531198456273613015915415871,630
Apartment56635061025534238015610461644274921,274691184,854
Detached$1,655,000$1,335,000$1,140,000n/a$885,000$1,237,500$1,740,000$1,025,000$1,462,000$1,700,000$955,000$623,324$1,615,000$3,265,000$2,835,000$2,092,500
Attached$786,000$830,000$678,000n/a$560,000$775,000$1,025,000$702,347$738,000$865,000$662,500$389,950$1,129,900$1,398,000n/a$1,170,000n/a
Apartment$600,000$558,000$551,000n/a$378,000$526,250$665,000$447,500$613,500$593,000$435,000$479,100$625,000$850,000$1,225,000$409,500
Note:MedianSellingPricesarenotreportedforareaswithlessthan20salesorfortheGulfIslands
Number
of
Sales
April
2019
Number
of
Sales
Median
Selling
Price
Number
of
Sales
Median
Selling
Price
Number
of
Sales
Median
Selling
Price
March
2019
April
2018
Jan.-
Apr.2019
Jan.-
Apr.2018
Median
Selling
Price
Number
of
Sales
Median
Selling
Price
April
2019
Year-to-date
Year-to-date
4262019MLS®
LISTINGSFacts
Burnaby
Coquitlam
Delta-South
Islands-Gulf
MapleRidge/PittMeadows
NewWestminster
NorthVancouver
PortCoquitlam
PortMoody/Belcarra
Richmond
Squamish
SunshineCoast
VancouverEast
VancouverWest
WestVancouver/HoweSound
Whistler/Pemberton
Detached178188101422365193544625132110214226184202,089
Attached1167635087168459361662379116421281,009
Apartment323195320822012287957273242328276938382,644
Detached30%35%24%0%34%22%27%39%28%16%69%26%31%28%21%40%
Attached30%37%49%n/a53%56%37%29%42%25%39%114%37%27%10%71%n/a
Apartment32%31%16%n/a34%42%28%37%51%33%38%43%41%30%21%47%
Detached163169100817344147542822442115210188120211,806
Attached1198323585166639211441814651131236859
Apartment279157330531421747444302192822668830352,284
Detached22%28%22%0%35%25%48%30%25%24%38%33%25%34%19%52%
Attached36%40%52%0%55%31%33%49%38%21%106%14%43%30%25%56%n/a
Apartment40%39%18%n/a60%46%42%32%52%31%74%39%41%34%27%66%
Detached240206122921561243823825750108337296202222,488
Attached10472182793167333513929211051291726907
Apartment279173330108143168673828435927273440422,425
Detached23%37%37%44%57%44%32%41%55%25%48%39%31%23%16%50%
Attached58%43%44%0%63%42%63%58%46%57%59%43%50%36%24%62%n/a
Apartment57%53%52%n/a51%65%60%72%45%59%34%78%52%48%50%64%
Detached59864034118682178631197137937144366772837577857,140
Attached427290109529364279163865568944285486611303,367
Apartment1,10259610902475977362741671,09070798702,6701621558,924
Detached24%28%23%61%34%27%31%34%28%17%43%33%28%24%18%45%
Attached31%38%40%0%54%48%34%37%38%23%61%50%37%25%15%47%n/a
Apartment38%38%28%n/a42%41%32%33%51%31%51%37%39%29%21%49%
Detached717632377336601576912141119891683459641,042603827,785
Attached35321454824989196124944758457317396591302,899
Apartment833484109030745755319813999495338032,2881371757,605
Detached30%43%33%33%60%51%34%49%35%26%43%46%32%21%16%66%
Attached60%54%59%13%71%60%61%68%60%57%73%53%50%39%25%67%n/a
Apartment68%72%56%n/a83%75%69%79%75%62%46%82%61%56%50%67%
*Year-to-datelistingsrepresentacumulativetotaloflistingsratherthantotalactivelistings.
%Salesto
Listings
Number
of
Listings
%Salesto
Listings
March
2019
April
2018
Jan.-
Apr.2019
Jan.-
Apr.2018
%Salesto
Listings
Number
of
Listings
%Salesto
Listings
Number
of
Listings
April
2019
Number
of
Listings
%Salesto
Listings
Number
of
Listings
April
2019
Year-to-date*
Year-to-date*
Listing & Sales Activity Summary
Listings Sales
1 2 3 Col. 2 & 3 5 6 7 Col. 6 & 7 9 10 Col. 9 & 10
Apr Mar Apr Percentage Apr Mar Apr Percentage Feb 2018 - Feb 2019 - Percentage
2018 2019 2019 Variance 2018 2019 2019 Variance Apr 2018 Apr 2019 Variance
BURNABY % % %
DETACHED 240 163 178 9.2 54 36 53 47.2 156 119 -23.7
ATTACHED 104 119 116 -2.5 60 43 35 -18.6 178 107 -39.9
APARTMENTS 279 279 323 15.8 160 111 103 -7.2 454 338 -25.6
COQUITLAM
DETACHED 206 169 188 11.2 77 48 65 35.4 215 151 -29.8
ATTACHED 72 83 76 -8.4 31 33 28 -15.2 96 92 -4.2
APARTMENTS 173 157 195 24.2 92 61 60 -1.6 270 186 -31.1
DELTA
DETACHED 122 100 101 1.0 45 22 24 9.1 109 64 -41.3
ATTACHED 18 23 35 52.2 8 12 17 41.7 24 37 54.2
APARTMENTS 33 33 32 -3.0 17 6 5 -16.7 48 25 -47.9
MAPLE RIDGE/PITT MEADOWS
DETACHED 215 173 223 28.9 123 60 76 26.7 321 193 -39.9
ATTACHED 79 85 87 2.4 50 47 46 -2.1 136 126 -7.4
APARTMENTS 108 53 82 54.7 55 32 28 -12.5 173 83 -52.0
NORTH VANCOUVER
DETACHED 243 147 193 31.3 77 70 53 -24.3 202 160 -20.8
ATTACHED 67 66 84 27.3 42 22 31 40.9 92 80 -13.0
APARTMENTS 168 174 228 31.0 101 73 64 -12.3 305 196 -35.7
NEW WESTMINSTER
DETACHED 61 44 65 47.7 27 11 14 27.3 69 38 -44.9
ATTACHED 31 16 16 0.0 13 5 9 80.0 40 21 -47.5
APARTMENTS 143 142 201 41.5 93 65 85 30.8 270 192 -28.9
PORT MOODY/BELCARRA
DETACHED 38 28 46 64.3 21 7 13 85.7 36 30 -16.7
ATTACHED 35 21 36 71.4 16 8 15 87.5 45 28 -37.8
APARTMENTS 38 44 57 29.5 17 23 29 26.1 72 67 -6.9
PORT COQUITLAM
DETACHED 82 54 54 0.0 34 16 21 31.3 92 54 -41.3
ATTACHED 33 39 59 51.3 19 19 17 -10.5 68 52 -23.5
APARTMENTS 67 74 79 6.8 48 24 29 20.8 127 74 -41.7
RICHMOND
DETACHED 257 224 251 12.1 65 54 41 -24.1 194 131 -32.5
ATTACHED 139 144 166 15.3 79 30 42 40.0 212 101 -52.4
APARTMENTS 284 302 273 -9.6 167 94 89 -5.3 471 272 -42.3
SUNSHINE COAST
DETACHED 108 115 110 -4.3 42 38 29 -23.7 121 103 -14.9
ATTACHED 21 14 7 -50.0 9 2 8 300.0 25 17 -32.0
APARTMENTS 9 28 23 -17.9 7 11 10 -9.1 21 27 28.6
SQUAMISH
DETACHED 50 42 32 -23.8 24 16 22 37.5 67 54 -19.4
ATTACHED 29 18 23 27.8 17 19 9 -52.6 51 46 -9.8
APARTMENTS 35 19 24 26.3 12 14 9 -35.7 38 28 -26.3
VANCOUVER EAST
DETACHED 337 210 214 1.9 103 53 66 24.5 263 173 -34.2
ATTACHED 105 65 91 40.0 53 28 34 21.4 134 93 -30.6
APARTMENTS 272 226 282 24.8 142 93 115 23.7 425 289 -32.0
VANCOUVER WEST
DETACHED 296 188 226 20.2 68 64 63 -1.6 174 170 -2.3
ATTACHED 129 113 164 45.1 47 34 45 32.4 130 103 -20.8
APARTMENTS 734 688 769 11.8 350 235 233 -0.9 1031 654 -36.6
WHISTLER/PEMBERTON
DETACHED 22 21 20 -4.8 11 11 8 -27.3 39 29 -25.6
ATTACHED 26 36 28 -22.2 16 20 20 0.0 68 49 -27.9
APARTMENTS 42 35 38 8.6 27 23 18 -21.7 91 59 -35.2
WEST VANCOUVER/HOWE SOUND
DETACHED 202 120 184 53.3 32 23 38 65.2 82 86 4.9
ATTACHED 17 12 21 75.0 4 3 2 -33.3 11 8 -27.3
APARTMENTS 40 30 38 26.7 20 8 8 0.0 46 27 -41.3
GRAND TOTALS
DETACHED 2479 1798 2085 16.0 803 529 586 10.8 2140 1555 -27.3
ATTACHED 905 854 1009 18.1 464 325 358 10.2 1310 960 -26.7
APARTMENTS 2425 2284 2644 15.8 1308 873 885 1.4 3842 2517 -34.5
ResidentialAverageSalePrices-January1977toApril2019
0
200
400
600
800
1000
1200
1400
1600
1800
2000
1977
1978
1979
1980
1981
1982
1983
1984
1985
1986
1987
1988
1989
1990
1991
1992
1993
1994
1995
1996
1997
1998
1999
2000
2001
2002
2003
2004
2005
2006
2007
2008
2009
2010
2011
2012
2013
2014
2015
2016
2017
2018
2019
DETACHEDCONDOMINIUMATTACHEDAPARTMENTS
INTHOUSANDS($)
NOTE:From1977-1984condominiumaverageswerenotseparatedintoattached&apartment.
$895,221
$655,955
$1,639,333

More Related Content

What's hot

Rebgv stats-pkg-april-2020
Rebgv stats-pkg-april-2020Rebgv stats-pkg-april-2020
Rebgv stats-pkg-april-2020Vicky Aulakh
 
Rebgv stats-pkg-december-2019
Rebgv stats-pkg-december-2019Rebgv stats-pkg-december-2019
Rebgv stats-pkg-december-2019Vicky Aulakh
 
Metro Vancouver Statistics September 2021
Metro Vancouver Statistics September 2021 Metro Vancouver Statistics September 2021
Metro Vancouver Statistics September 2021 VickyAulakh1
 
Rebgv stats-pkg-february-2019
Rebgv stats-pkg-february-2019Rebgv stats-pkg-february-2019
Rebgv stats-pkg-february-2019Kathryn Huang
 
Real Estate Board of Greater Vancouver Statistics Package July 2021
Real Estate Board of Greater Vancouver Statistics Package July 2021Real Estate Board of Greater Vancouver Statistics Package July 2021
Real Estate Board of Greater Vancouver Statistics Package July 2021Vicky Aulakh
 
REBGV Stats Package February 2021
REBGV Stats Package February 2021REBGV Stats Package February 2021
REBGV Stats Package February 2021Vicky Aulakh
 
REBGV Statistics Package August 2020
REBGV Statistics Package August 2020REBGV Statistics Package August 2020
REBGV Statistics Package August 2020Vicky Aulakh
 
Rebgv stats-pkg-february-2020
Rebgv stats-pkg-february-2020Rebgv stats-pkg-february-2020
Rebgv stats-pkg-february-2020Vicky Aulakh
 
Rebgv stats-pkg-september-2019
Rebgv stats-pkg-september-2019Rebgv stats-pkg-september-2019
Rebgv stats-pkg-september-2019Vicky Aulakh
 
Real Estate Board of Greater Vancouver Statistics Package March 2021
Real Estate Board of Greater Vancouver Statistics Package March 2021Real Estate Board of Greater Vancouver Statistics Package March 2021
Real Estate Board of Greater Vancouver Statistics Package March 2021Vicky Aulakh
 
Real Estate Board of Greater Vancouver Statistics Package August 2021
Real Estate Board of Greater Vancouver Statistics Package August 2021Real Estate Board of Greater Vancouver Statistics Package August 2021
Real Estate Board of Greater Vancouver Statistics Package August 2021Vicky Aulakh
 
REBGV Statistics Package April 2021
REBGV Statistics Package April 2021REBGV Statistics Package April 2021
REBGV Statistics Package April 2021Vicky Aulakh
 
Rebgv stats-pkg-august-2019
Rebgv stats-pkg-august-2019Rebgv stats-pkg-august-2019
Rebgv stats-pkg-august-2019Vicky Aulakh
 
Rebgv stats-pkg-may-2019
Rebgv stats-pkg-may-2019Rebgv stats-pkg-may-2019
Rebgv stats-pkg-may-2019Kathryn Huang
 
Real Estate Board of Greater Vancouver Statistics Package October 2021
Real Estate Board of Greater Vancouver Statistics Package October 2021Real Estate Board of Greater Vancouver Statistics Package October 2021
Real Estate Board of Greater Vancouver Statistics Package October 2021VickyAulakh1
 
Rebgv Stats Package September 2020
Rebgv Stats Package September 2020Rebgv Stats Package September 2020
Rebgv Stats Package September 2020Vicky Aulakh
 
REBGV Statistic Package December 2020
REBGV Statistic Package December 2020REBGV Statistic Package December 2020
REBGV Statistic Package December 2020Vicky Aulakh
 
Real Estate Board of Greater Vancouver Statistics Package - November 2021
Real Estate Board of Greater Vancouver Statistics Package - November 2021Real Estate Board of Greater Vancouver Statistics Package - November 2021
Real Estate Board of Greater Vancouver Statistics Package - November 2021VickyAulakh1
 
Rebgv stats-pkg-march-2019
Rebgv stats-pkg-march-2019Rebgv stats-pkg-march-2019
Rebgv stats-pkg-march-2019Kathryn Huang
 
Metro Vancouver Statistics Report October 2021
Metro Vancouver Statistics Report October 2021Metro Vancouver Statistics Report October 2021
Metro Vancouver Statistics Report October 2021VickyAulakh1
 

What's hot (20)

Rebgv stats-pkg-april-2020
Rebgv stats-pkg-april-2020Rebgv stats-pkg-april-2020
Rebgv stats-pkg-april-2020
 
Rebgv stats-pkg-december-2019
Rebgv stats-pkg-december-2019Rebgv stats-pkg-december-2019
Rebgv stats-pkg-december-2019
 
Metro Vancouver Statistics September 2021
Metro Vancouver Statistics September 2021 Metro Vancouver Statistics September 2021
Metro Vancouver Statistics September 2021
 
Rebgv stats-pkg-february-2019
Rebgv stats-pkg-february-2019Rebgv stats-pkg-february-2019
Rebgv stats-pkg-february-2019
 
Real Estate Board of Greater Vancouver Statistics Package July 2021
Real Estate Board of Greater Vancouver Statistics Package July 2021Real Estate Board of Greater Vancouver Statistics Package July 2021
Real Estate Board of Greater Vancouver Statistics Package July 2021
 
REBGV Stats Package February 2021
REBGV Stats Package February 2021REBGV Stats Package February 2021
REBGV Stats Package February 2021
 
REBGV Statistics Package August 2020
REBGV Statistics Package August 2020REBGV Statistics Package August 2020
REBGV Statistics Package August 2020
 
Rebgv stats-pkg-february-2020
Rebgv stats-pkg-february-2020Rebgv stats-pkg-february-2020
Rebgv stats-pkg-february-2020
 
Rebgv stats-pkg-september-2019
Rebgv stats-pkg-september-2019Rebgv stats-pkg-september-2019
Rebgv stats-pkg-september-2019
 
Real Estate Board of Greater Vancouver Statistics Package March 2021
Real Estate Board of Greater Vancouver Statistics Package March 2021Real Estate Board of Greater Vancouver Statistics Package March 2021
Real Estate Board of Greater Vancouver Statistics Package March 2021
 
Real Estate Board of Greater Vancouver Statistics Package August 2021
Real Estate Board of Greater Vancouver Statistics Package August 2021Real Estate Board of Greater Vancouver Statistics Package August 2021
Real Estate Board of Greater Vancouver Statistics Package August 2021
 
REBGV Statistics Package April 2021
REBGV Statistics Package April 2021REBGV Statistics Package April 2021
REBGV Statistics Package April 2021
 
Rebgv stats-pkg-august-2019
Rebgv stats-pkg-august-2019Rebgv stats-pkg-august-2019
Rebgv stats-pkg-august-2019
 
Rebgv stats-pkg-may-2019
Rebgv stats-pkg-may-2019Rebgv stats-pkg-may-2019
Rebgv stats-pkg-may-2019
 
Real Estate Board of Greater Vancouver Statistics Package October 2021
Real Estate Board of Greater Vancouver Statistics Package October 2021Real Estate Board of Greater Vancouver Statistics Package October 2021
Real Estate Board of Greater Vancouver Statistics Package October 2021
 
Rebgv Stats Package September 2020
Rebgv Stats Package September 2020Rebgv Stats Package September 2020
Rebgv Stats Package September 2020
 
REBGV Statistic Package December 2020
REBGV Statistic Package December 2020REBGV Statistic Package December 2020
REBGV Statistic Package December 2020
 
Real Estate Board of Greater Vancouver Statistics Package - November 2021
Real Estate Board of Greater Vancouver Statistics Package - November 2021Real Estate Board of Greater Vancouver Statistics Package - November 2021
Real Estate Board of Greater Vancouver Statistics Package - November 2021
 
Rebgv stats-pkg-march-2019
Rebgv stats-pkg-march-2019Rebgv stats-pkg-march-2019
Rebgv stats-pkg-march-2019
 
Metro Vancouver Statistics Report October 2021
Metro Vancouver Statistics Report October 2021Metro Vancouver Statistics Report October 2021
Metro Vancouver Statistics Report October 2021
 

Similar to Rebgv stats-pkg-april-2019

Rebgv stats-pkg-march-2019
Rebgv stats-pkg-march-2019Rebgv stats-pkg-march-2019
Rebgv stats-pkg-march-2019Sherryl Jacobs
 
Rebgv stats-pkg-february-2019
Rebgv stats-pkg-february-2019Rebgv stats-pkg-february-2019
Rebgv stats-pkg-february-2019Sherryl Jacobs
 
Rebgv stats-pkg-january-2019
Rebgv stats-pkg-january-2019Rebgv stats-pkg-january-2019
Rebgv stats-pkg-january-2019Kathryn Huang
 
May-2019 Stats Package for Greater Vancouver
May-2019 Stats Package for Greater VancouverMay-2019 Stats Package for Greater Vancouver
May-2019 Stats Package for Greater VancouverBC PRIME Realty
 
Rebgv stats-pkg-october-2019
Rebgv stats-pkg-october-2019Rebgv stats-pkg-october-2019
Rebgv stats-pkg-october-2019Vicky Aulakh
 
Rebgv stats-pkg-september-2018
Rebgv stats-pkg-september-2018Rebgv stats-pkg-september-2018
Rebgv stats-pkg-september-2018Kathryn Huang
 
Rebgv stats-pkg-february-2018
Rebgv stats-pkg-february-2018Rebgv stats-pkg-february-2018
Rebgv stats-pkg-february-2018Kathryn Huang
 
Rebgv stats-pkg-may-2018
Rebgv stats-pkg-may-2018Rebgv stats-pkg-may-2018
Rebgv stats-pkg-may-2018Kathryn Huang
 
201807 rebgv-stats-package-for-media
201807 rebgv-stats-package-for-media201807 rebgv-stats-package-for-media
201807 rebgv-stats-package-for-mediaKathryn Huang
 
Rebgv stats-pkg-november-2018
Rebgv stats-pkg-november-2018Rebgv stats-pkg-november-2018
Rebgv stats-pkg-november-2018Kathryn Huang
 
May 2017 REBGV Stats
May 2017 REBGV Stats May 2017 REBGV Stats
May 2017 REBGV Stats Mike Stewart
 
REBGV Statistics Package October 2020
REBGV Statistics Package October 2020REBGV Statistics Package October 2020
REBGV Statistics Package October 2020Vicky Aulakh
 
REBGV Statistics package July 2020
REBGV Statistics package July 2020REBGV Statistics package July 2020
REBGV Statistics package July 2020Vicky Aulakh
 
Rebgv stats-pkg-april-2018
Rebgv stats-pkg-april-2018Rebgv stats-pkg-april-2018
Rebgv stats-pkg-april-2018Kathryn Huang
 
Real Estate Board of Greater Vancouver Statistics Package January 2021
Real Estate Board of Greater Vancouver Statistics Package January 2021 Real Estate Board of Greater Vancouver Statistics Package January 2021
Real Estate Board of Greater Vancouver Statistics Package January 2021 Vicky Aulakh
 
Real Estate Board of Greater Vancouver Statistics Package November 2020
Real Estate Board of Greater Vancouver Statistics Package November 2020Real Estate Board of Greater Vancouver Statistics Package November 2020
Real Estate Board of Greater Vancouver Statistics Package November 2020Vicky Aulakh
 
Rebgv stats-pkg-june-2018
Rebgv stats-pkg-june-2018Rebgv stats-pkg-june-2018
Rebgv stats-pkg-june-2018Kathryn Huang
 
Real Estate Board of Greater Vancouver - Statistics Package for July 2021
Real Estate Board of Greater Vancouver - Statistics Package for July 2021Real Estate Board of Greater Vancouver - Statistics Package for July 2021
Real Estate Board of Greater Vancouver - Statistics Package for July 2021Alexander Mackenzie, PMP
 

Similar to Rebgv stats-pkg-april-2019 (20)

Rebgv stats-pkg-march-2019
Rebgv stats-pkg-march-2019Rebgv stats-pkg-march-2019
Rebgv stats-pkg-march-2019
 
Rebgv stats-pkg-february-2019
Rebgv stats-pkg-february-2019Rebgv stats-pkg-february-2019
Rebgv stats-pkg-february-2019
 
Rebgv stats-pkg-january-2019
Rebgv stats-pkg-january-2019Rebgv stats-pkg-january-2019
Rebgv stats-pkg-january-2019
 
May-2019 Stats Package for Greater Vancouver
May-2019 Stats Package for Greater VancouverMay-2019 Stats Package for Greater Vancouver
May-2019 Stats Package for Greater Vancouver
 
Rebgv stats-pkg-october-2019
Rebgv stats-pkg-october-2019Rebgv stats-pkg-october-2019
Rebgv stats-pkg-october-2019
 
Rebgv stats-pkg-september-2018
Rebgv stats-pkg-september-2018Rebgv stats-pkg-september-2018
Rebgv stats-pkg-september-2018
 
Rebgv stats-pkg-february-2018
Rebgv stats-pkg-february-2018Rebgv stats-pkg-february-2018
Rebgv stats-pkg-february-2018
 
Rebgv stats-pkg-may-2018
Rebgv stats-pkg-may-2018Rebgv stats-pkg-may-2018
Rebgv stats-pkg-may-2018
 
201807 rebgv-stats-package-for-media
201807 rebgv-stats-package-for-media201807 rebgv-stats-package-for-media
201807 rebgv-stats-package-for-media
 
Rebgv stats-pkg-november-2018
Rebgv stats-pkg-november-2018Rebgv stats-pkg-november-2018
Rebgv stats-pkg-november-2018
 
May 2017 REBGV Stats
May 2017 REBGV Stats May 2017 REBGV Stats
May 2017 REBGV Stats
 
REBGV Statistics Package October 2020
REBGV Statistics Package October 2020REBGV Statistics Package October 2020
REBGV Statistics Package October 2020
 
Rebgv stats-pkg-october-2020
Rebgv stats-pkg-october-2020Rebgv stats-pkg-october-2020
Rebgv stats-pkg-october-2020
 
REBGV Statistics package July 2020
REBGV Statistics package July 2020REBGV Statistics package July 2020
REBGV Statistics package July 2020
 
Rebgv stats-pkg-april-2018
Rebgv stats-pkg-april-2018Rebgv stats-pkg-april-2018
Rebgv stats-pkg-april-2018
 
Real Estate Board of Greater Vancouver Statistics Package January 2021
Real Estate Board of Greater Vancouver Statistics Package January 2021 Real Estate Board of Greater Vancouver Statistics Package January 2021
Real Estate Board of Greater Vancouver Statistics Package January 2021
 
Rebgv stats-pkg-november-2020
Rebgv stats-pkg-november-2020Rebgv stats-pkg-november-2020
Rebgv stats-pkg-november-2020
 
Real Estate Board of Greater Vancouver Statistics Package November 2020
Real Estate Board of Greater Vancouver Statistics Package November 2020Real Estate Board of Greater Vancouver Statistics Package November 2020
Real Estate Board of Greater Vancouver Statistics Package November 2020
 
Rebgv stats-pkg-june-2018
Rebgv stats-pkg-june-2018Rebgv stats-pkg-june-2018
Rebgv stats-pkg-june-2018
 
Real Estate Board of Greater Vancouver - Statistics Package for July 2021
Real Estate Board of Greater Vancouver - Statistics Package for July 2021Real Estate Board of Greater Vancouver - Statistics Package for July 2021
Real Estate Board of Greater Vancouver - Statistics Package for July 2021
 

More from Kathryn Huang

Disclosureof representationintradingservices english-recbc (4)
Disclosureof representationintradingservices english-recbc (4)Disclosureof representationintradingservices english-recbc (4)
Disclosureof representationintradingservices english-recbc (4)Kathryn Huang
 
Property disclosure statement strata title properties mike stewart prec
Property disclosure statement strata title properties mike stewart precProperty disclosure statement strata title properties mike stewart prec
Property disclosure statement strata title properties mike stewart precKathryn Huang
 
Privacy noticeandconsent (3)
Privacy noticeandconsent (3)Privacy noticeandconsent (3)
Privacy noticeandconsent (3)Kathryn Huang
 
Rebgv stats-pkg-december-2018
Rebgv stats-pkg-december-2018Rebgv stats-pkg-december-2018
Rebgv stats-pkg-december-2018Kathryn Huang
 
Rebgv stats-pkg-october-2018 .pdf
Rebgv stats-pkg-october-2018 .pdf Rebgv stats-pkg-october-2018 .pdf
Rebgv stats-pkg-october-2018 .pdf Kathryn Huang
 
Rebgv stats-pkg-august-2018
Rebgv stats-pkg-august-2018Rebgv stats-pkg-august-2018
Rebgv stats-pkg-august-2018Kathryn Huang
 
Broadway corridor-planning-program-presentation-may-2018
Broadway corridor-planning-program-presentation-may-2018Broadway corridor-planning-program-presentation-may-2018
Broadway corridor-planning-program-presentation-may-2018Kathryn Huang
 
2018 03-metro-vancouver
2018 03-metro-vancouver 2018 03-metro-vancouver
2018 03-metro-vancouver Kathryn Huang
 
Rebgv stats-pkg-january-2018 2
Rebgv stats-pkg-january-2018 2Rebgv stats-pkg-january-2018 2
Rebgv stats-pkg-january-2018 2Kathryn Huang
 
2017 Real Estate Board of Greater Vancouver Statistics Package with Charts & ...
2017 Real Estate Board of Greater Vancouver Statistics Package with Charts & ...2017 Real Estate Board of Greater Vancouver Statistics Package with Charts & ...
2017 Real Estate Board of Greater Vancouver Statistics Package with Charts & ...Kathryn Huang
 

More from Kathryn Huang (12)

Disclosureof representationintradingservices english-recbc (4)
Disclosureof representationintradingservices english-recbc (4)Disclosureof representationintradingservices english-recbc (4)
Disclosureof representationintradingservices english-recbc (4)
 
Property disclosure statement strata title properties mike stewart prec
Property disclosure statement strata title properties mike stewart precProperty disclosure statement strata title properties mike stewart prec
Property disclosure statement strata title properties mike stewart prec
 
2516 bc
2516 bc2516 bc
2516 bc
 
Privacy noticeandconsent (3)
Privacy noticeandconsent (3)Privacy noticeandconsent (3)
Privacy noticeandconsent (3)
 
Rebgv stats-pkg-december-2018
Rebgv stats-pkg-december-2018Rebgv stats-pkg-december-2018
Rebgv stats-pkg-december-2018
 
Rebgv stats-pkg-october-2018 .pdf
Rebgv stats-pkg-october-2018 .pdf Rebgv stats-pkg-october-2018 .pdf
Rebgv stats-pkg-october-2018 .pdf
 
2440 bc
2440 bc2440 bc
2440 bc
 
Rebgv stats-pkg-august-2018
Rebgv stats-pkg-august-2018Rebgv stats-pkg-august-2018
Rebgv stats-pkg-august-2018
 
Broadway corridor-planning-program-presentation-may-2018
Broadway corridor-planning-program-presentation-may-2018Broadway corridor-planning-program-presentation-may-2018
Broadway corridor-planning-program-presentation-may-2018
 
2018 03-metro-vancouver
2018 03-metro-vancouver 2018 03-metro-vancouver
2018 03-metro-vancouver
 
Rebgv stats-pkg-january-2018 2
Rebgv stats-pkg-january-2018 2Rebgv stats-pkg-january-2018 2
Rebgv stats-pkg-january-2018 2
 
2017 Real Estate Board of Greater Vancouver Statistics Package with Charts & ...
2017 Real Estate Board of Greater Vancouver Statistics Package with Charts & ...2017 Real Estate Board of Greater Vancouver Statistics Package with Charts & ...
2017 Real Estate Board of Greater Vancouver Statistics Package with Charts & ...
 

Recently uploaded

Call Girls in Nehru Place Delhi 💯Call Us 🔝8264348440🔝
Call Girls in Nehru Place Delhi 💯Call Us 🔝8264348440🔝Call Girls in Nehru Place Delhi 💯Call Us 🔝8264348440🔝
Call Girls in Nehru Place Delhi 💯Call Us 🔝8264348440🔝soniya singh
 
9990771857 Call Girls in Noida Sector 10 Noida (Call Girls) Delhi
9990771857 Call Girls in Noida Sector 10 Noida (Call Girls) Delhi9990771857 Call Girls in Noida Sector 10 Noida (Call Girls) Delhi
9990771857 Call Girls in Noida Sector 10 Noida (Call Girls) Delhidelhimodel235
 
Call Girls in Kashmiri Gate Delhi 💯Call Us 🔝8264348440🔝
Call Girls in Kashmiri Gate Delhi 💯Call Us 🔝8264348440🔝Call Girls in Kashmiri Gate Delhi 💯Call Us 🔝8264348440🔝
Call Girls in Kashmiri Gate Delhi 💯Call Us 🔝8264348440🔝soniya singh
 
8 Key Elements for Comfortable Farmland Living
8 Key Elements for Comfortable Farmland Living 8 Key Elements for Comfortable Farmland Living
8 Key Elements for Comfortable Farmland Living Farmland Bazaar
 
83770-87607 ۞Call Girls In Near The Park Hotel (Cp) Delhi
83770-87607 ۞Call Girls In Near The Park Hotel (Cp) Delhi83770-87607 ۞Call Girls In Near The Park Hotel (Cp) Delhi
83770-87607 ۞Call Girls In Near The Park Hotel (Cp) Delhidollysharma2066
 
call girls in Shahdara (DELHI) 🔝 >༒9953330565🔝 genuine Escort Service 🔝✔️✔️
call girls in Shahdara (DELHI) 🔝 >༒9953330565🔝 genuine Escort Service 🔝✔️✔️call girls in Shahdara (DELHI) 🔝 >༒9953330565🔝 genuine Escort Service 🔝✔️✔️
call girls in Shahdara (DELHI) 🔝 >༒9953330565🔝 genuine Escort Service 🔝✔️✔️9953056974 Low Rate Call Girls In Saket, Delhi NCR
 
Call Girls in Khan Market 9654467111 ESCORTS SERVICE
Call Girls in Khan Market 9654467111 ESCORTS SERVICECall Girls in Khan Market 9654467111 ESCORTS SERVICE
Call Girls in Khan Market 9654467111 ESCORTS SERVICESapana Sha
 
Call Girls in Janakpuri ↫8447779280↫Short 1500 Night 6000-Escorts Service In ...
Call Girls in Janakpuri ↫8447779280↫Short 1500 Night 6000-Escorts Service In ...Call Girls in Janakpuri ↫8447779280↫Short 1500 Night 6000-Escorts Service In ...
Call Girls in Janakpuri ↫8447779280↫Short 1500 Night 6000-Escorts Service In ...asmaqueen5
 
9990771857 Call Girls in Noida Sector 34 Noida (Call Girls) Delhi
9990771857 Call Girls in Noida Sector 34 Noida (Call Girls) Delhi9990771857 Call Girls in Noida Sector 34 Noida (Call Girls) Delhi
9990771857 Call Girls in Noida Sector 34 Noida (Call Girls) Delhidelhimodel235
 
Eco-Efficient Living: Redefining Sustainability through Leech's Green Design ...
Eco-Efficient Living: Redefining Sustainability through Leech's Green Design ...Eco-Efficient Living: Redefining Sustainability through Leech's Green Design ...
Eco-Efficient Living: Redefining Sustainability through Leech's Green Design ...Newman George Leech
 
SVN Live 4.22.24 Weekly Property Broadcast
SVN Live 4.22.24 Weekly Property BroadcastSVN Live 4.22.24 Weekly Property Broadcast
SVN Live 4.22.24 Weekly Property BroadcastSVN International Corp.
 
SSPL The Strand Abodes Kharadi Pune Brochure.pdf
SSPL The Strand Abodes Kharadi Pune Brochure.pdfSSPL The Strand Abodes Kharadi Pune Brochure.pdf
SSPL The Strand Abodes Kharadi Pune Brochure.pdfabbu831446
 
Model Call Girl in Shastri Nagar Delhi reach out to us at 🔝8264348440🔝
Model Call Girl in Shastri Nagar Delhi reach out to us at 🔝8264348440🔝Model Call Girl in Shastri Nagar Delhi reach out to us at 🔝8264348440🔝
Model Call Girl in Shastri Nagar Delhi reach out to us at 🔝8264348440🔝soniya singh
 
Nanke Area Estate commercial ( Dir. Kat Kuo)
Nanke Area Estate commercial ( Dir. Kat Kuo)Nanke Area Estate commercial ( Dir. Kat Kuo)
Nanke Area Estate commercial ( Dir. Kat Kuo)jessica288382
 
Rustomjee The Panorama At Pali Hill, Bandra West, Mumbai - Brochure.pdf
Rustomjee The Panorama At Pali Hill, Bandra West, Mumbai - Brochure.pdfRustomjee The Panorama At Pali Hill, Bandra West, Mumbai - Brochure.pdf
Rustomjee The Panorama At Pali Hill, Bandra West, Mumbai - Brochure.pdfmonikasharma630
 
Call Girls in shastri nagar Delhi 8264348440 ✅ call girls ❤️
Call Girls in shastri nagar Delhi 8264348440 ✅ call girls ❤️Call Girls in shastri nagar Delhi 8264348440 ✅ call girls ❤️
Call Girls in shastri nagar Delhi 8264348440 ✅ call girls ❤️soniya singh
 
How to Build Multifamily and Laneway Suites in Toronto!! (feat. Expert Archi...
How to Build Multifamily and Laneway Suites  in Toronto!! (feat. Expert Archi...How to Build Multifamily and Laneway Suites  in Toronto!! (feat. Expert Archi...
How to Build Multifamily and Laneway Suites in Toronto!! (feat. Expert Archi...Volition Properties
 
Low Rate Call Girls in Akshardham Delhi Call 9990771857
Low Rate Call Girls in Akshardham   Delhi Call 9990771857Low Rate Call Girls in Akshardham   Delhi Call 9990771857
Low Rate Call Girls in Akshardham Delhi Call 9990771857delhimodel235
 
9990771857 Call Girls in Noida Sector 1 Noida (Call Girls) Delhi
9990771857 Call Girls in Noida Sector 1 Noida (Call Girls) Delhi9990771857 Call Girls in Noida Sector 1 Noida (Call Girls) Delhi
9990771857 Call Girls in Noida Sector 1 Noida (Call Girls) Delhidelhimodel235
 

Recently uploaded (20)

Call Girls in Nehru Place Delhi 💯Call Us 🔝8264348440🔝
Call Girls in Nehru Place Delhi 💯Call Us 🔝8264348440🔝Call Girls in Nehru Place Delhi 💯Call Us 🔝8264348440🔝
Call Girls in Nehru Place Delhi 💯Call Us 🔝8264348440🔝
 
9990771857 Call Girls in Noida Sector 10 Noida (Call Girls) Delhi
9990771857 Call Girls in Noida Sector 10 Noida (Call Girls) Delhi9990771857 Call Girls in Noida Sector 10 Noida (Call Girls) Delhi
9990771857 Call Girls in Noida Sector 10 Noida (Call Girls) Delhi
 
Call Girls in Kashmiri Gate Delhi 💯Call Us 🔝8264348440🔝
Call Girls in Kashmiri Gate Delhi 💯Call Us 🔝8264348440🔝Call Girls in Kashmiri Gate Delhi 💯Call Us 🔝8264348440🔝
Call Girls in Kashmiri Gate Delhi 💯Call Us 🔝8264348440🔝
 
8 Key Elements for Comfortable Farmland Living
8 Key Elements for Comfortable Farmland Living 8 Key Elements for Comfortable Farmland Living
8 Key Elements for Comfortable Farmland Living
 
83770-87607 ۞Call Girls In Near The Park Hotel (Cp) Delhi
83770-87607 ۞Call Girls In Near The Park Hotel (Cp) Delhi83770-87607 ۞Call Girls In Near The Park Hotel (Cp) Delhi
83770-87607 ۞Call Girls In Near The Park Hotel (Cp) Delhi
 
call girls in Shahdara (DELHI) 🔝 >༒9953330565🔝 genuine Escort Service 🔝✔️✔️
call girls in Shahdara (DELHI) 🔝 >༒9953330565🔝 genuine Escort Service 🔝✔️✔️call girls in Shahdara (DELHI) 🔝 >༒9953330565🔝 genuine Escort Service 🔝✔️✔️
call girls in Shahdara (DELHI) 🔝 >༒9953330565🔝 genuine Escort Service 🔝✔️✔️
 
Call Girls in Khan Market 9654467111 ESCORTS SERVICE
Call Girls in Khan Market 9654467111 ESCORTS SERVICECall Girls in Khan Market 9654467111 ESCORTS SERVICE
Call Girls in Khan Market 9654467111 ESCORTS SERVICE
 
Call Girls in Janakpuri ↫8447779280↫Short 1500 Night 6000-Escorts Service In ...
Call Girls in Janakpuri ↫8447779280↫Short 1500 Night 6000-Escorts Service In ...Call Girls in Janakpuri ↫8447779280↫Short 1500 Night 6000-Escorts Service In ...
Call Girls in Janakpuri ↫8447779280↫Short 1500 Night 6000-Escorts Service In ...
 
9990771857 Call Girls in Noida Sector 34 Noida (Call Girls) Delhi
9990771857 Call Girls in Noida Sector 34 Noida (Call Girls) Delhi9990771857 Call Girls in Noida Sector 34 Noida (Call Girls) Delhi
9990771857 Call Girls in Noida Sector 34 Noida (Call Girls) Delhi
 
Eco-Efficient Living: Redefining Sustainability through Leech's Green Design ...
Eco-Efficient Living: Redefining Sustainability through Leech's Green Design ...Eco-Efficient Living: Redefining Sustainability through Leech's Green Design ...
Eco-Efficient Living: Redefining Sustainability through Leech's Green Design ...
 
SVN Live 4.22.24 Weekly Property Broadcast
SVN Live 4.22.24 Weekly Property BroadcastSVN Live 4.22.24 Weekly Property Broadcast
SVN Live 4.22.24 Weekly Property Broadcast
 
SSPL The Strand Abodes Kharadi Pune Brochure.pdf
SSPL The Strand Abodes Kharadi Pune Brochure.pdfSSPL The Strand Abodes Kharadi Pune Brochure.pdf
SSPL The Strand Abodes Kharadi Pune Brochure.pdf
 
Model Call Girl in Shastri Nagar Delhi reach out to us at 🔝8264348440🔝
Model Call Girl in Shastri Nagar Delhi reach out to us at 🔝8264348440🔝Model Call Girl in Shastri Nagar Delhi reach out to us at 🔝8264348440🔝
Model Call Girl in Shastri Nagar Delhi reach out to us at 🔝8264348440🔝
 
Nanke Area Estate commercial ( Dir. Kat Kuo)
Nanke Area Estate commercial ( Dir. Kat Kuo)Nanke Area Estate commercial ( Dir. Kat Kuo)
Nanke Area Estate commercial ( Dir. Kat Kuo)
 
Rustomjee The Panorama At Pali Hill, Bandra West, Mumbai - Brochure.pdf
Rustomjee The Panorama At Pali Hill, Bandra West, Mumbai - Brochure.pdfRustomjee The Panorama At Pali Hill, Bandra West, Mumbai - Brochure.pdf
Rustomjee The Panorama At Pali Hill, Bandra West, Mumbai - Brochure.pdf
 
Call Girls in shastri nagar Delhi 8264348440 ✅ call girls ❤️
Call Girls in shastri nagar Delhi 8264348440 ✅ call girls ❤️Call Girls in shastri nagar Delhi 8264348440 ✅ call girls ❤️
Call Girls in shastri nagar Delhi 8264348440 ✅ call girls ❤️
 
How to Build Multifamily and Laneway Suites in Toronto!! (feat. Expert Archi...
How to Build Multifamily and Laneway Suites  in Toronto!! (feat. Expert Archi...How to Build Multifamily and Laneway Suites  in Toronto!! (feat. Expert Archi...
How to Build Multifamily and Laneway Suites in Toronto!! (feat. Expert Archi...
 
Low Rate Call Girls in Akshardham Delhi Call 9990771857
Low Rate Call Girls in Akshardham   Delhi Call 9990771857Low Rate Call Girls in Akshardham   Delhi Call 9990771857
Low Rate Call Girls in Akshardham Delhi Call 9990771857
 
Call Girls in Mahavir Nagar whatsaap call US +919953056974
Call Girls in Mahavir Nagar  whatsaap call US  +919953056974Call Girls in Mahavir Nagar  whatsaap call US  +919953056974
Call Girls in Mahavir Nagar whatsaap call US +919953056974
 
9990771857 Call Girls in Noida Sector 1 Noida (Call Girls) Delhi
9990771857 Call Girls in Noida Sector 1 Noida (Call Girls) Delhi9990771857 Call Girls in Noida Sector 1 Noida (Call Girls) Delhi
9990771857 Call Girls in Noida Sector 1 Noida (Call Girls) Delhi
 

Rebgv stats-pkg-april-2019