SlideShare a Scribd company logo
1 of 9
Download to read offline
News Release
FOR IMMEDIATE RELEASE:
Home buyer demand depends on property type
VANCOUVER, BC – February 2, 2018 – Attached and apartment homes are in demand
across Metro Vancouver* while detached home buyers are facing less competition today.
The Real Estate Board of Greater Vancouver (REBGV) reports that residential home sales in the
region totalled 1,818 in January 2018, a 19.4 per cent increase from the 1,523 sales recorded in
January 2017, and a 9.8 per cent decrease compared to December 2017 when 2,016 homes sold.
Last month’s sales were 7.1 per cent above the 10-year January sales average. By property type,
detached sales were down 24.8 per cent from the 10-year January average, attached sales
increased 14.3 per cent and apartment sales were up 31.6 per cent over the same period.
“Demand remains elevated and listings scarce in the attached and apartment markets across
Metro Vancouver,” Jill Oudil, REBGV president said. “Buyers in the detached market are facing
less competition and have much more selection to choose. For detached home sellers to be
successful, it’s important to set prices that reflect today’s market trends.”
There were 3,796 detached, attached and apartment properties newly listed for sale on the
Multiple Listing Service® (MLS®) in Metro Vancouver in January 2018. This represents an 8.3
per cent decrease compared to the 4,140 homes listed in January 2017 and a 100.7 per cent
increase compared to December 2017 when 1,891 homes were listed.
The total number of properties currently listed for sale on the MLS® system in Metro Vancouver
is 6,947, a four per cent decrease compared to January 2017 (7,238) and a 0.2 per cent decrease
compared to December 2017 (6,958).
For all property types, the sales-to-active listings ratio for January 2018 is 26.2 per cent. By
property type, the ratio is 11.6 per cent for detached homes, 32.8 per cent for townhomes, and
57.2 per cent for condominiums.
Generally, analysts say that downward pressure on home prices occurs when the ratio dips below
the 12 per cent mark for a sustained period, while home prices often experience upward pressure
when it surpasses 20 per cent over several months.
The MLS® Home Price Index composite benchmark price for all residential homes in Metro
Vancouver is currently $1,056,500. This represents a 16.6 per cent increase over January 2017
and a 0.6 per cent increase compared to December 2017.
Detached home sales in January 2018 reached 487, a 9.7 per cent increase from the 444 detached
sales recorded in January 2017. The benchmark price for detached properties is $1,601,500. This
represents an 8.3 per cent increase from January 2017 and a 0.3 per cent decrease compared to
December 2017.
Apartment home sales reached 1,012 in January 2018, a 22.7 per cent increase compared to the
825 sales in January 2017. The benchmark price of an apartment property is $665,400. This
represents a 27.4 per cent increase from January 2017 and a 1.5 per cent increase compared to
December 2017.
Attached home sales in January 2018 totalled 319, a 25.6 per cent increase compared to the 254
sales in January 2017. The benchmark price of an attached unit is $803,700. This represents a
17.5 per cent increase from January 2017 and unchanged compared to December 2017.
-30-
*Editor’s Note: Areas covered by the Real Estate Board of Greater Vancouver include: Whistler, Sunshine Coast,
Squamish, West Vancouver, North Vancouver, Vancouver, Burnaby, New Westminster, Richmond, Port Moody,
Port Coquitlam, Coquitlam, Pitt Meadows, Maple Ridge, and South Delta.
The real estate industry is a key economic driver in British Columbia. In 2017, 35,993 homes changed ownership in
the Board’s area, generating $2.4 billion in economic spin-off activity and an estimated 17,600 jobs. The total dollar
value of residential sales transacted through the MLS® system in Greater Vancouver totalled $37 billion in 2017.
The Real Estate Board of Greater Vancouver is an association representing more than 14,000 REALTORS® and
their companies. The Board provides a variety of member services, including the Multiple Listing Service®. For
more information on real estate, statistics, and buying or selling a home, contact a local REALTOR® or visit
www.rebgv.org.
For more information please contact:
Mark Moldowan
Senior Writer, Communication
Real Estate Board of Greater Vancouver
604.730.3153
mmoldowan@rebgv.org
Property Type Area
Benchmark
Price
Price
Index
1 Month
Change %
3 Month
Change %
6 Month
Change %
1 Year
Change %
3 Year
Change %
5 Year
Change %
10 Year
Change %
Residential / Composite Lower Mainland $961,200 271.2 0.9% 2.1% 4.5% 18.4% 67.1% 79.6% 88.1%
Greater Vancouver $1,056,500 276.2 0.6% 1.4% 3.6% 16.6% 63.0% 78.0% 90.2%
Bowen Island $941,400 204.1 -1.3% -1.8% 3.1% 13.4% 62.1% 64.3% 49.6%
Burnaby East $958,100 266.5 -0.4% 1.8% 1.8% 14.5% 60.8% 75.4% 83.5%
Burnaby North $916,700 276.8 1.2% 2.7% 6.3% 17.6% 66.8% 80.8% 90.5%
Burnaby South $1,021,100 288.4 1.2% 2.5% 4.6% 16.1% 65.9% 84.3% 101.1%
Coquitlam $933,200 276.8 0.8% 2.6% 5.4% 23.4% 71.0% 88.6% 94.4%
Ladner $867,500 243.5 -1.0% 0.7% 2.4% 9.8% 53.1% 64.9% 75.4%
Maple Ridge $700,000 235.4 1.2% 2.9% 7.5% 22.1% 74.4% 77.4% 69.4%
New Westminster $675,600 289.6 1.2% 3.7% 7.3% 26.1% 75.8% 88.2% 92.9%
North Vancouver $1,093,400 245.7 0.2% 0.0% 0.6% 12.6% 56.7% 71.9% 76.0%
Pitt Meadows $699,600 255.9 1.6% 4.5% 10.7% 25.1% 72.6% 85.6% 80.3%
Port Coquitlam $736,500 259.8 0.4% 2.3% 4.6% 24.7% 73.7% 83.1% 79.2%
Port Moody $929,100 256.8 0.6% 2.6% 7.3% 21.2% 69.7% 86.4% 81.9%
Richmond $1,014,800 296.3 1.1% 3.0% 5.0% 17.0% 67.1% 80.0% 105.5%
Squamish $804,700 257.6 -1.0% -1.2% 8.9% 19.5% 82.2% 108.9% 96.8%
Sunshine Coast $585,100 205.0 0.3% -0.6% 3.1% 15.6% 65.7% 64.8% 49.2%
Tsawwassen $998,600 250.8 -1.2% -0.2% 1.2% 9.5% 59.6% 70.4% 79.4%
Vancouver East $1,094,200 320.4 0.5% 0.9% 1.9% 14.8% 64.5% 84.6% 113.3%
Vancouver West $1,355,400 285.8 0.3% -0.5% 0.8% 13.7% 55.6% 73.7% 89.5%
West Vancouver $2,610,100 280.6 0.2% 0.2% -1.6% 7.4% 49.3% 69.6% 93.1%
Whistler $942,400 207.2 -1.5% -2.6% 11.8% 20.5% 77.5% 98.7% 59.3%
Single Family Detached Lower Mainland $1,323,100 280.7 0.1% 0.1% 0.2% 10.6% 62.3% 78.6% 99.2%
Greater Vancouver $1,601,500 294.3 -0.3% -0.5% -0.7% 8.3% 58.0% 76.9% 105.7%
Bowen Island $941,400 204.1 -1.3% -1.8% 3.1% 13.4% 62.1% 64.3% 49.6%
Burnaby East $1,266,900 283.3 -2.0% 0.7% -1.5% 10.1% 63.8% 79.6% 100.4%
Burnaby North $1,567,900 303.2 -0.7% -0.6% -1.1% 5.9% 56.0% 75.7% 109.8%
Burnaby South $1,668,000 319.3 -0.7% -2.2% -2.9% 2.0% 57.2% 80.7% 127.3%
Coquitlam $1,280,600 284.2 -0.2% 0.2% 0.3% 15.5% 64.6% 84.1% 103.6%
Ladner $1,017,200 245.2 -1.2% -1.0% 0.7% 5.1% 53.0% 66.9% 79.9%
Maple Ridge $833,600 237.5 0.8% 2.7% 5.0% 17.1% 73.4% 81.7% 74.5%
New Westminster $1,148,500 286.5 -0.9% 1.4% -0.2% 12.4% 67.5% 79.5% 102.2%
North Vancouver $1,670,100 261.2 -0.6% -1.8% -2.7% 5.5% 59.1% 80.0% 89.1%
Pitt Meadows $904,600 254.9 1.2% 2.9% 4.2% 17.4% 69.6% 83.6% 84.4%
Port Coquitlam $978,500 260.9 -1.7% -1.6% -1.7% 16.9% 65.5% 78.6% 87.3%
Port Moody $1,494,500 276.0 -0.5% -1.0% 3.3% 11.3% 62.1% 84.1% 95.3%
Richmond $1,690,500 339.5 -0.1% 0.0% 0.5% 8.2% 63.8% 80.2% 132.9%
Squamish $1,003,000 256.0 -1.3% 2.0% 3.4% 18.2% 79.5% 106.6% 97.4%
Sunshine Coast $583,400 204.4 0.6% -0.2% 3.4% 16.1% 66.3% 64.8% 48.8%
Tsawwassen $1,261,800 271.7 -1.6% -1.1% -0.1% 8.5% 66.0% 81.3% 94.2%
Vancouver East $1,564,000 345.7 0.3% -0.2% 0.1% 8.6% 60.5% 91.1% 140.2%
Vancouver West $3,548,400 364.3 -0.2% -2.1% -3.2% 3.8% 50.9% 77.6% 129.1%
West Vancouver $3,099,500 292.6 0.2% 0.1% -2.5% 5.7% 47.9% 70.8% 99.3%
Whistler $1,680,700 213.1 1.5% 3.1% 5.4% 18.4% 69.9% 86.6% 64.2%
HOW TO READ THE TABLE:
• Benchmark Price: Estimated sale price of a benchmark property. Benchmarks represent a typical property within each market.
• Price Index: Index numbers estimate the percentage change in price on typical and constant quality properties over time. All figures are based on past sales.
• x Month/Year Change %: Percentage change of index over a period of x month(s)/year(s) *
In January 2005, the indexes are set to 100.
Townhome properties are similar to Attached properties, a category that was used in the previous MLSLink HPI, but do not included duplexes.
The above info is deemed reliable, but is not guaranteed. All dollar amounts in CDN.
January 2018*
* MLS®, Multiple Listing Service®, and all related graphics are trademarks of The Canadian Real Estate Association 1 of 15
Property Type Area
Benchmark
Price
Price
Index
1 Month
Change %
3 Month
Change %
6 Month
Change %
1 Year
Change %
3 Year
Change %
5 Year
Change %
10 Year
Change %
January 2018*
Townhouse Lower Mainland $680,900 246.1 0.5% 1.5% 5.8% 19.6% 64.9% 72.5% 74.7%
Greater Vancouver $803,700 259.3 0.0% 0.2% 5.2% 17.5% 61.7% 73.3% 83.0%
Burnaby East $667,900 246.7 1.3% 3.2% 8.7% 20.5% 55.5% 64.8% 73.6%
Burnaby North $733,800 273.9 0.8% 2.1% 6.5% 23.2% 60.7% 75.5% 86.7%
Burnaby South $786,400 270.9 2.8% 3.2% 4.1% 15.5% 60.2% 74.1% 89.7%
Coquitlam $662,600 243.1 0.0% 1.8% 5.0% 20.9% 62.4% 72.0% 75.4%
Ladner $776,000 270.6 -0.1% 4.2% 5.1% 21.5% 63.6% 77.9% 84.5%
Maple Ridge $533,800 247.8 1.2% 0.8% 6.6% 28.7% 78.5% 76.5% 74.4%
New Westminster $694,200 274.5 0.1% 2.3% 7.4% 21.2% 60.7% 75.1% 90.1%
North Vancouver $991,800 241.0 0.9% 1.5% 4.4% 17.6% 61.4% 71.7% 77.5%
Pitt Meadows $590,300 255.4 0.4% 2.8% 8.5% 22.1% 70.2% 87.7% 80.9%
Port Coquitlam $635,600 239.8 0.5% -1.2% 1.7% 17.5% 66.6% 71.8% 68.5%
Port Moody $632,600 213.8 0.6% 4.3% 5.9% 23.4% 48.4% 54.1% 50.5%
Richmond $822,500 270.3 1.8% 2.8% 4.4% 14.8% 59.5% 72.2% 92.0%
Squamish $786,900 285.9 -6.7% -12.5% 17.6% 11.7% 85.6% 124.4% 119.9%
Tsawwassen $763,300 284.3 1.1% 3.1% 5.1% 22.9% 69.4% 80.2% 93.8%
Vancouver East $857,600 281.5 -2.5% 0.3% 0.3% 15.0% 56.4% 64.5% 85.2%
Vancouver West $1,247,900 275.6 0.4% -1.4% 1.3% 11.6% 57.8% 77.1% 92.2%
Whistler $914,300 244.5 -8.5% -13.0% 19.1% 13.0% 70.0% 96.4% 92.1%
Apartment Lower Mainland $622,800 272.3 2.1% 4.9% 10.1% 30.7% 77.3% 85.6% 81.2%
Greater Vancouver $665,400 267.4 1.5% 3.6% 7.9% 27.4% 71.9% 82.5% 79.8%
Burnaby East $687,700 261.1 0.9% 4.0% 6.2% 28.9% 66.7% 86.6% 64.4%
Burnaby North $618,400 264.0 2.5% 5.3% 12.2% 27.9% 80.8% 88.8% 81.4%
Burnaby South $697,400 280.0 1.8% 5.0% 9.3% 26.5% 75.7% 91.4% 92.0%
Coquitlam $512,600 281.3 1.9% 5.3% 11.6% 35.5% 86.2% 102.8% 89.0%
Ladner $431,300 204.4 -1.2% 2.0% 6.1% 13.2% 39.4% 41.0% 47.4%
Maple Ridge $291,500 210.5 3.3% 8.2% 23.0% 40.7% 76.7% 61.9% 40.1%
New Westminster $513,000 292.4 1.9% 4.5% 9.8% 32.2% 81.2% 93.1% 90.6%
North Vancouver $567,200 230.9 1.2% 1.9% 4.1% 22.9% 55.6% 64.7% 62.0%
Pitt Meadows $436,200 257.8 3.2% 8.0% 22.5% 40.9% 77.8% 86.3% 71.5%
Port Coquitlam $451,700 270.1 2.3% 8.0% 12.6% 37.6% 87.7% 95.7% 74.5%
Port Moody $642,600 267.8 1.6% 4.8% 11.4% 30.3% 90.5% 109.1% 91.1%
Richmond $649,900 277.4 2.0% 6.6% 11.6% 33.0% 81.7% 89.1% 90.9%
Squamish $490,400 236.2 5.5% 8.0% 10.0% 32.1% 86.1% 116.3% 75.9%
Tsawwassen $460,500 194.2 -0.4% 1.8% 5.7% 13.6% 44.3% 41.8% 40.0%
Vancouver East $552,300 304.7 1.2% 2.6% 5.3% 25.9% 74.6% 84.4% 91.4%
Vancouver West $812,400 263.6 0.6% 0.7% 3.7% 21.9% 63.3% 76.0% 76.9%
West Vancouver $1,179,400 238.9 0.7% 1.4% 3.7% 20.0% 62.8% 66.2% 70.9%
Whistler $533,800 175.0 5.2% 7.1% 8.7% 32.7% 111.1% 150.0% 31.8%
HOW TO READ THE TABLE:
• Benchmark Price: Estimated sale price of a benchmark property. Benchmarks represent a typical property within each market.
• Price Index: Index numbers estimate the percentage change in price on typical and constant quality properties over time. All figures are based on past sales.
• x Month/Year Change %: Percentage change of index over a period of x month(s)/year(s)
In January 2005, the indexes are set to 100. *
Townhome properties are similar to attached properties, a category that was used in the previous MLSLink HPI, but do not included duplexes.
Lower Mainland includes areas serviced by both Real Estate Board of Greater Vancouver & Fraser Valley Real Estate Board.
The above info is deemed reliable, but is not guaranteed. All dollar amounts in CDN.
* MLS®, Multiple Listing Service®, and all related graphics are trademarks of The Canadian Real Estate Association 2 of 15
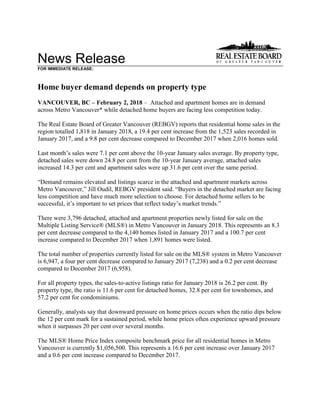
C:DATAMonthEndHpiexporthi_resgv-hpi2.tifGreaterVancouver
5YearTrend
60
110
160
210
260
310
Jan 2013
Mar 2013
May 2013
Jul 2013
Sep 2013
Nov 2013
Jan 2014
Mar 2014
May 2014
Jul 2014
Sep 2014
Nov 2014
Jan 2015
Mar 2015
May 2015
Jul 2015
Sep 2015
Nov 2015
Jan 2016
Mar 2016
May 2016
Jul 2016
Sep 2016
Nov 2016
Jan 2017
Mar 2017
May 2017
Jul 2017
Sep 2017
Nov 2017
Jan 2018
Price
Index
ResidentialDetachedTownhouseApartment
Jan2005HPI=100
1252018MLS®
SALESFacts
Burnaby
Coquitlam
Delta-South
Islands-Gulf
MapleRidge/PittMeadows
NewWestminster
NorthVancouver
PortCoquitlam
PortMoody/Belcarra
Richmond
Squamish
SunshineCoast
VancouverEast
VancouverWest
WestVancouver/HoweSound
Whistler/Pemberton
Detached56561417411301336663645461515487
Attached3519804213271611611052524419319
Apartment112801308272752932145666724323271,012
Detached$1,650,000$1,265,000n/an/a$879,960n/a$1,637,500n/an/a$1,760,000n/a$624,500$1,596,000$3,600,000n/an/a
Attached$730,000n/an/an/a$548,500n/a$879,000n/an/a$885,000n/an/a$899,900$1,519,000n/an/an/a
Apartment$650,000$552,500n/an/a$351,250$501,000$691,500$425,000$595,450$600,000n/an/a$619,450$880,000$1,449,000$259,000
Detached4450261821770201067144988363013617
Attached4532804014211715771853326119371
Apartment1457950408578321114111611625110181,028
Detached$1,585,000$1,390,400$1,002,500n/a$865,000n/a$1,707,500$948,700n/a$1,688,800n/a$695,000$1,650,000$3,200,000$3,600,000n/a
Attached$795,000$749,400n/an/a$539,000n/a$965,000n/an/a$825,800n/an/a$1,190,000$1,610,000n/an/an/a
Apartment$539,500$529,950n/an/a$339,000$478,000$622,500$439,000n/a$545,000n/an/a$608,500$788,000n/an/a
Detached403519457113414855163251362012444
Attached271981295131413471161224322254
Apartment10860110354759312212387752111315825
Detached$1,500,000$1,055,000n/an/a$679,250n/a$1,600,000n/an/a$1,560,000n/a$451,191$1,355,000$2,820,000$2,675,000n/a
Attached$690,000n/an/an/a$415,500n/an/an/an/a$765,000n/an/an/a$1,231,900n/a$767,500n/a
Apartment$490,250$451,200n/an/a$294,000$408,500$552,500$300,000$472,450$414,900n/an/a$489,900$670,000n/an/a
Detached56561417411301336663645461515487
Attached3519804213271611611052524419319
Apartment112801308272752932145666724323271,012
Detached$1,650,000$1,265,000n/an/a$879,960n/a$1,637,500n/an/a$1,760,000n/a$624,500$1,596,000$3,600,000n/an/a
Attached$730,000n/an/an/a$548,500n/a$879,000n/an/a$885,000n/an/a$899,900$1,519,000n/an/an/a
Apartment$650,000$552,500n/an/a$351,250$501,000$691,500$425,000$595,450$600,000n/an/a$619,450$880,000$1,449,000$259,000
Detached403519457113414855163251362012444
Attached271981295131413471161224322254
Apartment10860110354759312212387752111315825
Detached$1,500,000$1,055,000n/an/a$679,250n/a$1,600,000n/an/a$1,560,000n/a$451,191$1,355,000$2,820,000$2,675,000n/a
Attached$690,000n/an/an/a$415,500n/an/an/an/a$765,000n/an/an/a$1,231,900n/a$767,500n/a
Apartment$490,250$451,200n/an/a$294,000$408,500$552,500$300,000$472,450$414,900n/an/a$489,900$670,000n/an/a
Note:MedianSellingPricesarenotreportedforareaswithlessthan20salesorfortheGulfIslands
Median
Selling
Price
Number
of
Sales
Median
Selling
Price
December
2017
January
2017
Jan.-
Jan.2018
Jan.-
Jan.2017
Median
Selling
Price
Number
of
Sales
Median
Selling
Price
Number
of
Sales
January
2018
Number
of
Sales
Median
Selling
Price
Number
of
Sales
January
2018
Year-to-date
Year-to-date
1252018MLS®
LISTINGSFacts
Burnaby
Coquitlam
Delta-South
Islands-Gulf
MapleRidge/PittMeadows
NewWestminster
NorthVancouver
PortCoquitlam
PortMoody/Belcarra
Richmond
Squamish
SunshineCoast
VancouverEast
VancouverWest
WestVancouver/HoweSound
Whistler/Pemberton
Detached1641398481172714437202363966176268137131,675
Attached7842142632834291410416473811620618
Apartment1808518058831113633198251014345331391,503
Detached34%40%17%13%63%41%21%35%15%28%15%55%26%17%11%115%
Attached45%45%57%0%67%46%79%55%79%59%63%125%34%30%25%95%n/a
Apartment62%94%72%n/a141%87%68%81%97%73%24%60%47%54%74%69%
Detached7859182532647205100144088723520677
Attached412050311520111666632423311295
Apartment1128260725454311313256932291020919
Detached56%85%144%50%155%65%149%100%200%67%100%123%100%50%86%65%
Attached110%160%160%n/a129%93%105%155%94%117%300%167%138%113%33%173%n/a
Apartment129%96%83%n/a56%157%144%103%85%107%220%100%125%110%100%90%
Detached17811510661341913744243443166219309166231,921
Attached7138250621732228106341041731026575
Apartment2051232604796126513521014715349421361,644
Detached22%30%18%67%43%58%25%32%33%16%52%48%23%12%12%52%
Attached38%50%32%n/a47%29%41%64%163%44%32%60%29%33%30%85%n/a
Apartment53%49%42%n/a74%49%47%61%63%59%57%100%49%43%62%42%
Detached1641398481172714437202363966176268137131,675
Attached7842142632834291410416473811620618
Apartment1808518058831113633198251014345331391,503
Detached34%40%17%13%63%41%21%35%15%28%15%55%26%17%11%115%
Attached45%45%57%0%67%46%79%55%79%59%63%125%34%30%25%95%n/a
Apartment62%94%72%n/a141%87%68%81%97%73%24%60%47%54%74%69%
Detached17811510661341913744243443166219309166231,921
Attached7138250621732228106341041731026575
Apartment2051232604796126513521014715349421361,644
Detached22%30%18%67%43%58%25%32%33%16%52%48%23%12%12%52%
Attached38%50%32%n/a47%29%41%64%163%44%32%60%29%33%30%85%n/a
Apartment53%49%42%n/a74%49%47%61%63%59%57%100%49%43%62%42%
*Year-to-datelistingsrepresentacumulativetotaloflistingsratherthantotalactivelistings.
Number
of
Listings
January
2018
Number
of
Listings
%Salesto
Listings
Number
of
Listings
%Salesto
Listings
Number
of
Listings
%Salesto
Listings
December
2017
January
2017
Jan.-
Jan.2018
Jan.-
Jan.2017
%Salesto
Listings
Number
of
Listings
%Salesto
Listings
January
2018
Year-to-date*
Year-to-date*
Listing & Sales Activity Summary
Listings Sales
1 2 3 Col. 2 & 3 5 6 7 Col. 6 & 7 9 10 Col. 9 & 10
Jan Dec Jan Percentage Jan Dec Jan Percentage Nov 2016 - Nov 2017 - Percentage
2017 2017 2018 Variance 2017 2017 2018 Variance Jan 2017 Jan 2018 Variance
BURNABY % % %
DETACHED 178 78 164 110.3 40 44 56 27.3 130 176 35.4
ATTACHED 71 41 78 90.2 27 45 35 -22.2 90 127 41.1
APARTMENTS 205 112 180 60.7 108 145 112 -22.8 381 454 19.2
COQUITLAM
DETACHED 115 59 139 135.6 35 50 56 12.0 136 186 36.8
ATTACHED 38 20 42 110.0 19 32 19 -40.6 68 93 36.8
APARTMENTS 123 82 85 3.7 60 79 80 1.3 211 265 25.6
DELTA
DETACHED 106 18 84 366.7 19 26 14 -46.2 72 77 6.9
ATTACHED 25 5 14 180.0 8 8 8 0.0 26 23 -11.5
APARTMENTS 26 6 18 200.0 11 5 13 160.0 33 24 -27.3
MAPLE RIDGE/PITT MEADOWS
DETACHED 134 53 117 120.8 57 82 74 -9.8 206 269 30.6
ATTACHED 62 31 63 103.2 29 40 42 5.0 113 123 8.8
APARTMENTS 47 72 58 -19.4 35 40 82 105.0 108 179 65.7
NORTH VANCOUVER
DETACHED 137 47 144 206.4 34 70 30 -57.1 143 176 23.1
ATTACHED 32 20 34 70.0 13 21 27 28.6 55 85 54.5
APARTMENTS 126 54 111 105.6 59 78 75 -3.8 218 288 32.1
NEW WESTMINSTER
DETACHED 19 26 27 3.8 11 17 11 -35.3 33 54 63.6
ATTACHED 17 15 28 86.7 5 14 13 -7.1 22 40 81.8
APARTMENTS 96 54 83 53.7 47 85 72 -15.3 188 285 51.6
PORT MOODY/BELCARRA
DETACHED 24 5 20 300.0 8 10 3 -70.0 28 31 10.7
ATTACHED 8 16 14 -12.5 13 15 11 -26.7 30 42 40.0
APARTMENTS 35 13 33 153.8 22 11 32 190.9 63 82 30.2
PORT COQUITLAM
DETACHED 44 20 37 85.0 14 20 13 -35.0 60 60 0.0
ATTACHED 22 11 29 163.6 14 17 16 -5.9 46 57 23.9
APARTMENTS 51 31 36 16.1 31 32 29 -9.4 107 104 -2.8
RICHMOND
DETACHED 344 100 236 136.0 55 67 66 -1.5 179 207 15.6
ATTACHED 106 66 104 57.6 47 77 61 -20.8 149 222 49.0
APARTMENTS 210 132 198 50.0 123 141 145 2.8 393 477 21.4
SUNSHINE COAST
DETACHED 66 40 66 65.0 32 49 36 -26.5 116 135 16.4
ATTACHED 10 3 4 33.3 6 5 5 0.0 13 19 46.2
APARTMENTS 7 6 10 66.7 7 6 6 0.0 25 19 -24.0
SQUAMISH
DETACHED 31 14 39 178.6 16 14 6 -57.1 37 42 13.5
ATTACHED 34 6 16 166.7 11 18 10 -44.4 38 38 0.0
APARTMENTS 14 5 25 400.0 8 11 6 -45.5 36 30 -16.7
VANCOUVER EAST
DETACHED 219 88 176 100.0 51 88 45 -48.9 191 227 18.8
ATTACHED 41 24 73 204.2 12 33 25 -24.2 64 109 70.3
APARTMENTS 153 93 143 53.8 75 116 67 -42.2 316 353 11.7
VANCOUVER WEST
DETACHED 309 72 268 272.2 36 36 46 27.8 168 165 -1.8
ATTACHED 73 23 81 252.2 24 26 24 -7.7 91 92 1.1
APARTMENTS 494 229 453 97.8 211 251 243 -3.2 744 874 17.5
WHISTLER/PEMBERTON
DETACHED 23 20 13 -35.0 12 13 15 15.4 34 47 38.2
ATTACHED 26 11 20 81.8 22 19 19 0.0 72 54 -25.0
APARTMENTS 36 20 39 95.0 15 18 27 50.0 81 68 -16.0
WEST VANCOUVER/HOWE SOUND
DETACHED 166 35 137 291.4 20 30 15 -50.0 77 82 6.5
ATTACHED 10 3 16 433.3 3 1 4 300.0 10 12 20.0
APARTMENTS 21 10 31 210.0 13 10 23 130.0 36 46 27.8
GRAND TOTALS
DETACHED 1915 675 1667 147.0 440 616 486 -21.1 1610 1934 20.1
ATTACHED 575 295 616 108.8 253 371 319 -14.0 887 1136 28.1
APARTMENTS 1644 919 1503 63.5 825 1028 1012 -1.6 2940 3548 20.7
ResidentialAverageSalePrices-January1977toJanuary2018
0
200
400
600
800
1000
1200
1400
1600
1800
2000
1977
1978
1979
1980
1981
1982
1983
1984
1985
1986
1987
1988
1989
1990
1991
1992
1993
1994
1995
1996
1997
1998
1999
2000
2001
2002
2003
2004
2005
2006
2007
2008
2009
2010
2011
2012
2013
2014
2015
2016
2017
2018
DETACHEDCONDOMINIUMATTACHEDAPARTMENTS
INTHOUSANDS($)
NOTE:From1977-1984condominiumaverageswerenotseparatedintoattached&apartment.
$903,998
$751,358
$1,732,992

More Related Content

What's hot

June 2017 REBGV Statistics Package
June 2017 REBGV Statistics PackageJune 2017 REBGV Statistics Package
June 2017 REBGV Statistics PackageMike Stewart
 
Rebgv stats-pkg-november-2018
Rebgv stats-pkg-november-2018Rebgv stats-pkg-november-2018
Rebgv stats-pkg-november-2018Kathryn Huang
 
Rebgv stats-pkg-february-2018
Rebgv stats-pkg-february-2018Rebgv stats-pkg-february-2018
Rebgv stats-pkg-february-2018Kathryn Huang
 
March 2017 Rebgv Stats Package Mike Stewart
March 2017 Rebgv Stats Package Mike StewartMarch 2017 Rebgv Stats Package Mike Stewart
March 2017 Rebgv Stats Package Mike StewartMike Stewart
 
REBGV STATS PACKAGE JULY 2017
REBGV STATS PACKAGE JULY 2017REBGV STATS PACKAGE JULY 2017
REBGV STATS PACKAGE JULY 2017Marcella Riccardi
 
Rebgv stats-pkg-february-2020
Rebgv stats-pkg-february-2020Rebgv stats-pkg-february-2020
Rebgv stats-pkg-february-2020Vicky Aulakh
 
December 2016 rebgv statistics package mike stewart vancouver realtor
December 2016 rebgv statistics package mike stewart vancouver realtorDecember 2016 rebgv statistics package mike stewart vancouver realtor
December 2016 rebgv statistics package mike stewart vancouver realtorMike Stewart
 
Rebgv stats-pkg-october-2019
Rebgv stats-pkg-october-2019Rebgv stats-pkg-october-2019
Rebgv stats-pkg-october-2019Vicky Aulakh
 
April 2017 Real Estate Board of Greater Vancouver Statistics Package with Charts
April 2017 Real Estate Board of Greater Vancouver Statistics Package with ChartsApril 2017 Real Estate Board of Greater Vancouver Statistics Package with Charts
April 2017 Real Estate Board of Greater Vancouver Statistics Package with ChartsMike Stewart
 
Real Estate Board of Greater Vancouver Statistics Package July 2021
Real Estate Board of Greater Vancouver Statistics Package July 2021Real Estate Board of Greater Vancouver Statistics Package July 2021
Real Estate Board of Greater Vancouver Statistics Package July 2021Vicky Aulakh
 
REBGV Statistics Package August 2020
REBGV Statistics Package August 2020REBGV Statistics Package August 2020
REBGV Statistics Package August 2020Vicky Aulakh
 
Real Estate Board of Greater Vancouver Statistics Package October 2021
Real Estate Board of Greater Vancouver Statistics Package October 2021Real Estate Board of Greater Vancouver Statistics Package October 2021
Real Estate Board of Greater Vancouver Statistics Package October 2021VickyAulakh1
 
Rebgv stats-pkg-july-2019
Rebgv stats-pkg-july-2019Rebgv stats-pkg-july-2019
Rebgv stats-pkg-july-2019Vicky Aulakh
 
May 2021 Real Estate Board of Greater Vancouver Statistics Package
May 2021 Real Estate Board of Greater Vancouver Statistics PackageMay 2021 Real Estate Board of Greater Vancouver Statistics Package
May 2021 Real Estate Board of Greater Vancouver Statistics PackageVicky Aulakh
 
January 2017 Rebgv Statistics Package Mike Stewart Vancouver Realtor
January 2017 Rebgv Statistics Package Mike Stewart Vancouver RealtorJanuary 2017 Rebgv Statistics Package Mike Stewart Vancouver Realtor
January 2017 Rebgv Statistics Package Mike Stewart Vancouver RealtorMike Stewart
 
REBGV Statistics Package April 2021
REBGV Statistics Package April 2021REBGV Statistics Package April 2021
REBGV Statistics Package April 2021Vicky Aulakh
 
2021 June - REBGV Statistics Package
2021 June - REBGV Statistics Package2021 June - REBGV Statistics Package
2021 June - REBGV Statistics PackageVicky Aulakh
 
Rebgv stats-pkg-april-2019
Rebgv stats-pkg-april-2019Rebgv stats-pkg-april-2019
Rebgv stats-pkg-april-2019Kathryn Huang
 
October 2016 REBGV Statistics Package Vancouver BC Mike Stewart Realtor
October 2016 REBGV Statistics Package Vancouver BC Mike Stewart RealtorOctober 2016 REBGV Statistics Package Vancouver BC Mike Stewart Realtor
October 2016 REBGV Statistics Package Vancouver BC Mike Stewart RealtorMike Stewart
 
REBGV Statistic Package December 2020
REBGV Statistic Package December 2020REBGV Statistic Package December 2020
REBGV Statistic Package December 2020Vicky Aulakh
 

What's hot (20)

June 2017 REBGV Statistics Package
June 2017 REBGV Statistics PackageJune 2017 REBGV Statistics Package
June 2017 REBGV Statistics Package
 
Rebgv stats-pkg-november-2018
Rebgv stats-pkg-november-2018Rebgv stats-pkg-november-2018
Rebgv stats-pkg-november-2018
 
Rebgv stats-pkg-february-2018
Rebgv stats-pkg-february-2018Rebgv stats-pkg-february-2018
Rebgv stats-pkg-february-2018
 
March 2017 Rebgv Stats Package Mike Stewart
March 2017 Rebgv Stats Package Mike StewartMarch 2017 Rebgv Stats Package Mike Stewart
March 2017 Rebgv Stats Package Mike Stewart
 
REBGV STATS PACKAGE JULY 2017
REBGV STATS PACKAGE JULY 2017REBGV STATS PACKAGE JULY 2017
REBGV STATS PACKAGE JULY 2017
 
Rebgv stats-pkg-february-2020
Rebgv stats-pkg-february-2020Rebgv stats-pkg-february-2020
Rebgv stats-pkg-february-2020
 
December 2016 rebgv statistics package mike stewart vancouver realtor
December 2016 rebgv statistics package mike stewart vancouver realtorDecember 2016 rebgv statistics package mike stewart vancouver realtor
December 2016 rebgv statistics package mike stewart vancouver realtor
 
Rebgv stats-pkg-october-2019
Rebgv stats-pkg-october-2019Rebgv stats-pkg-october-2019
Rebgv stats-pkg-october-2019
 
April 2017 Real Estate Board of Greater Vancouver Statistics Package with Charts
April 2017 Real Estate Board of Greater Vancouver Statistics Package with ChartsApril 2017 Real Estate Board of Greater Vancouver Statistics Package with Charts
April 2017 Real Estate Board of Greater Vancouver Statistics Package with Charts
 
Real Estate Board of Greater Vancouver Statistics Package July 2021
Real Estate Board of Greater Vancouver Statistics Package July 2021Real Estate Board of Greater Vancouver Statistics Package July 2021
Real Estate Board of Greater Vancouver Statistics Package July 2021
 
REBGV Statistics Package August 2020
REBGV Statistics Package August 2020REBGV Statistics Package August 2020
REBGV Statistics Package August 2020
 
Real Estate Board of Greater Vancouver Statistics Package October 2021
Real Estate Board of Greater Vancouver Statistics Package October 2021Real Estate Board of Greater Vancouver Statistics Package October 2021
Real Estate Board of Greater Vancouver Statistics Package October 2021
 
Rebgv stats-pkg-july-2019
Rebgv stats-pkg-july-2019Rebgv stats-pkg-july-2019
Rebgv stats-pkg-july-2019
 
May 2021 Real Estate Board of Greater Vancouver Statistics Package
May 2021 Real Estate Board of Greater Vancouver Statistics PackageMay 2021 Real Estate Board of Greater Vancouver Statistics Package
May 2021 Real Estate Board of Greater Vancouver Statistics Package
 
January 2017 Rebgv Statistics Package Mike Stewart Vancouver Realtor
January 2017 Rebgv Statistics Package Mike Stewart Vancouver RealtorJanuary 2017 Rebgv Statistics Package Mike Stewart Vancouver Realtor
January 2017 Rebgv Statistics Package Mike Stewart Vancouver Realtor
 
REBGV Statistics Package April 2021
REBGV Statistics Package April 2021REBGV Statistics Package April 2021
REBGV Statistics Package April 2021
 
2021 June - REBGV Statistics Package
2021 June - REBGV Statistics Package2021 June - REBGV Statistics Package
2021 June - REBGV Statistics Package
 
Rebgv stats-pkg-april-2019
Rebgv stats-pkg-april-2019Rebgv stats-pkg-april-2019
Rebgv stats-pkg-april-2019
 
October 2016 REBGV Statistics Package Vancouver BC Mike Stewart Realtor
October 2016 REBGV Statistics Package Vancouver BC Mike Stewart RealtorOctober 2016 REBGV Statistics Package Vancouver BC Mike Stewart Realtor
October 2016 REBGV Statistics Package Vancouver BC Mike Stewart Realtor
 
REBGV Statistic Package December 2020
REBGV Statistic Package December 2020REBGV Statistic Package December 2020
REBGV Statistic Package December 2020
 

Similar to Rebgv stats-pkg-january-2018 2

Rebgv stats-pkg-august-2018
Rebgv stats-pkg-august-2018Rebgv stats-pkg-august-2018
Rebgv stats-pkg-august-2018Kathryn Huang
 
July 2017 Real Estate Board of Greater Vancouver Stats Package Mike Stewart r...
July 2017 Real Estate Board of Greater Vancouver Stats Package Mike Stewart r...July 2017 Real Estate Board of Greater Vancouver Stats Package Mike Stewart r...
July 2017 Real Estate Board of Greater Vancouver Stats Package Mike Stewart r...Mike Stewart
 
Rebgv stats-pkg-september-2018
Rebgv stats-pkg-september-2018Rebgv stats-pkg-september-2018
Rebgv stats-pkg-september-2018Kathryn Huang
 
May-2019 Stats Package for Greater Vancouver
May-2019 Stats Package for Greater VancouverMay-2019 Stats Package for Greater Vancouver
May-2019 Stats Package for Greater VancouverBC PRIME Realty
 
Rebgv stats-pkg-may-2019
Rebgv stats-pkg-may-2019Rebgv stats-pkg-may-2019
Rebgv stats-pkg-may-2019Kathryn Huang
 
Rebgv stats-pkg-september-2019
Rebgv stats-pkg-september-2019Rebgv stats-pkg-september-2019
Rebgv stats-pkg-september-2019Vicky Aulakh
 
Rebgv Stats Package September 2020
Rebgv Stats Package September 2020Rebgv Stats Package September 2020
Rebgv Stats Package September 2020Vicky Aulakh
 
Rebgv stats-pkg-november-2019-f
Rebgv stats-pkg-november-2019-fRebgv stats-pkg-november-2019-f
Rebgv stats-pkg-november-2019-fVicky Aulakh
 
Rebgv stats-pkg-october-2018 .pdf
Rebgv stats-pkg-october-2018 .pdf Rebgv stats-pkg-october-2018 .pdf
Rebgv stats-pkg-october-2018 .pdf Kathryn Huang
 
REBGV Statistics package July 2020
REBGV Statistics package July 2020REBGV Statistics package July 2020
REBGV Statistics package July 2020Vicky Aulakh
 
Rebgv stats-pkg-august-2019
Rebgv stats-pkg-august-2019Rebgv stats-pkg-august-2019
Rebgv stats-pkg-august-2019Vicky Aulakh
 
REBGV Statistics Package October 2020
REBGV Statistics Package October 2020REBGV Statistics Package October 2020
REBGV Statistics Package October 2020Vicky Aulakh
 
Rebgv stats-pkg-june-2019
Rebgv stats-pkg-june-2019Rebgv stats-pkg-june-2019
Rebgv stats-pkg-june-2019Vicky Aulakh
 
REBGV September 2016 Stats Package Mike Stewart Vancouver Realtor
REBGV September 2016 Stats Package Mike Stewart Vancouver RealtorREBGV September 2016 Stats Package Mike Stewart Vancouver Realtor
REBGV September 2016 Stats Package Mike Stewart Vancouver RealtorMike Stewart
 
REBGV Statistics Package May 2020
REBGV Statistics Package May 2020REBGV Statistics Package May 2020
REBGV Statistics Package May 2020Vicky Aulakh
 
Real Estate Board of Greater Vancouver Statistics Package January 2021
Real Estate Board of Greater Vancouver Statistics Package January 2021 Real Estate Board of Greater Vancouver Statistics Package January 2021
Real Estate Board of Greater Vancouver Statistics Package January 2021 Vicky Aulakh
 
Rebgv stats-pkg-march-2019
Rebgv stats-pkg-march-2019Rebgv stats-pkg-march-2019
Rebgv stats-pkg-march-2019Kathryn Huang
 
Rebgv stats-pkg-march-2019
Rebgv stats-pkg-march-2019Rebgv stats-pkg-march-2019
Rebgv stats-pkg-march-2019Sherryl Jacobs
 

Similar to Rebgv stats-pkg-january-2018 2 (19)

Rebgv stats-pkg-august-2018
Rebgv stats-pkg-august-2018Rebgv stats-pkg-august-2018
Rebgv stats-pkg-august-2018
 
July 2017 Real Estate Board of Greater Vancouver Stats Package Mike Stewart r...
July 2017 Real Estate Board of Greater Vancouver Stats Package Mike Stewart r...July 2017 Real Estate Board of Greater Vancouver Stats Package Mike Stewart r...
July 2017 Real Estate Board of Greater Vancouver Stats Package Mike Stewart r...
 
Rebgv stats-pkg-september-2018
Rebgv stats-pkg-september-2018Rebgv stats-pkg-september-2018
Rebgv stats-pkg-september-2018
 
May-2019 Stats Package for Greater Vancouver
May-2019 Stats Package for Greater VancouverMay-2019 Stats Package for Greater Vancouver
May-2019 Stats Package for Greater Vancouver
 
Rebgv stats-pkg-may-2019
Rebgv stats-pkg-may-2019Rebgv stats-pkg-may-2019
Rebgv stats-pkg-may-2019
 
Rebgv stats-pkg-september-2019
Rebgv stats-pkg-september-2019Rebgv stats-pkg-september-2019
Rebgv stats-pkg-september-2019
 
Rebgv Stats Package September 2020
Rebgv Stats Package September 2020Rebgv Stats Package September 2020
Rebgv Stats Package September 2020
 
Rebgv stats-pkg-november-2019-f
Rebgv stats-pkg-november-2019-fRebgv stats-pkg-november-2019-f
Rebgv stats-pkg-november-2019-f
 
Rebgv stats-pkg-october-2018 .pdf
Rebgv stats-pkg-october-2018 .pdf Rebgv stats-pkg-october-2018 .pdf
Rebgv stats-pkg-october-2018 .pdf
 
REBGV Statistics package July 2020
REBGV Statistics package July 2020REBGV Statistics package July 2020
REBGV Statistics package July 2020
 
Rebgv stats-pkg-august-2019
Rebgv stats-pkg-august-2019Rebgv stats-pkg-august-2019
Rebgv stats-pkg-august-2019
 
REBGV Statistics Package October 2020
REBGV Statistics Package October 2020REBGV Statistics Package October 2020
REBGV Statistics Package October 2020
 
Rebgv stats-pkg-october-2020
Rebgv stats-pkg-october-2020Rebgv stats-pkg-october-2020
Rebgv stats-pkg-october-2020
 
Rebgv stats-pkg-june-2019
Rebgv stats-pkg-june-2019Rebgv stats-pkg-june-2019
Rebgv stats-pkg-june-2019
 
REBGV September 2016 Stats Package Mike Stewart Vancouver Realtor
REBGV September 2016 Stats Package Mike Stewart Vancouver RealtorREBGV September 2016 Stats Package Mike Stewart Vancouver Realtor
REBGV September 2016 Stats Package Mike Stewart Vancouver Realtor
 
REBGV Statistics Package May 2020
REBGV Statistics Package May 2020REBGV Statistics Package May 2020
REBGV Statistics Package May 2020
 
Real Estate Board of Greater Vancouver Statistics Package January 2021
Real Estate Board of Greater Vancouver Statistics Package January 2021 Real Estate Board of Greater Vancouver Statistics Package January 2021
Real Estate Board of Greater Vancouver Statistics Package January 2021
 
Rebgv stats-pkg-march-2019
Rebgv stats-pkg-march-2019Rebgv stats-pkg-march-2019
Rebgv stats-pkg-march-2019
 
Rebgv stats-pkg-march-2019
Rebgv stats-pkg-march-2019Rebgv stats-pkg-march-2019
Rebgv stats-pkg-march-2019
 

More from Kathryn Huang

Disclosureof representationintradingservices english-recbc (4)
Disclosureof representationintradingservices english-recbc (4)Disclosureof representationintradingservices english-recbc (4)
Disclosureof representationintradingservices english-recbc (4)Kathryn Huang
 
Property disclosure statement strata title properties mike stewart prec
Property disclosure statement strata title properties mike stewart precProperty disclosure statement strata title properties mike stewart prec
Property disclosure statement strata title properties mike stewart precKathryn Huang
 
Privacy noticeandconsent (3)
Privacy noticeandconsent (3)Privacy noticeandconsent (3)
Privacy noticeandconsent (3)Kathryn Huang
 
Rebgv stats-pkg-february-2019
Rebgv stats-pkg-february-2019Rebgv stats-pkg-february-2019
Rebgv stats-pkg-february-2019Kathryn Huang
 
Rebgv stats-pkg-january-2019
Rebgv stats-pkg-january-2019Rebgv stats-pkg-january-2019
Rebgv stats-pkg-january-2019Kathryn Huang
 
Rebgv stats-pkg-december-2018
Rebgv stats-pkg-december-2018Rebgv stats-pkg-december-2018
Rebgv stats-pkg-december-2018Kathryn Huang
 
Broadway corridor-planning-program-presentation-may-2018
Broadway corridor-planning-program-presentation-may-2018Broadway corridor-planning-program-presentation-may-2018
Broadway corridor-planning-program-presentation-may-2018Kathryn Huang
 
2018 03-metro-vancouver
2018 03-metro-vancouver 2018 03-metro-vancouver
2018 03-metro-vancouver Kathryn Huang
 
2017 Real Estate Board of Greater Vancouver Statistics Package with Charts & ...
2017 Real Estate Board of Greater Vancouver Statistics Package with Charts & ...2017 Real Estate Board of Greater Vancouver Statistics Package with Charts & ...
2017 Real Estate Board of Greater Vancouver Statistics Package with Charts & ...Kathryn Huang
 

More from Kathryn Huang (11)

Disclosureof representationintradingservices english-recbc (4)
Disclosureof representationintradingservices english-recbc (4)Disclosureof representationintradingservices english-recbc (4)
Disclosureof representationintradingservices english-recbc (4)
 
Property disclosure statement strata title properties mike stewart prec
Property disclosure statement strata title properties mike stewart precProperty disclosure statement strata title properties mike stewart prec
Property disclosure statement strata title properties mike stewart prec
 
2516 bc
2516 bc2516 bc
2516 bc
 
Privacy noticeandconsent (3)
Privacy noticeandconsent (3)Privacy noticeandconsent (3)
Privacy noticeandconsent (3)
 
Rebgv stats-pkg-february-2019
Rebgv stats-pkg-february-2019Rebgv stats-pkg-february-2019
Rebgv stats-pkg-february-2019
 
Rebgv stats-pkg-january-2019
Rebgv stats-pkg-january-2019Rebgv stats-pkg-january-2019
Rebgv stats-pkg-january-2019
 
Rebgv stats-pkg-december-2018
Rebgv stats-pkg-december-2018Rebgv stats-pkg-december-2018
Rebgv stats-pkg-december-2018
 
2440 bc
2440 bc2440 bc
2440 bc
 
Broadway corridor-planning-program-presentation-may-2018
Broadway corridor-planning-program-presentation-may-2018Broadway corridor-planning-program-presentation-may-2018
Broadway corridor-planning-program-presentation-may-2018
 
2018 03-metro-vancouver
2018 03-metro-vancouver 2018 03-metro-vancouver
2018 03-metro-vancouver
 
2017 Real Estate Board of Greater Vancouver Statistics Package with Charts & ...
2017 Real Estate Board of Greater Vancouver Statistics Package with Charts & ...2017 Real Estate Board of Greater Vancouver Statistics Package with Charts & ...
2017 Real Estate Board of Greater Vancouver Statistics Package with Charts & ...
 

Recently uploaded

The Omaxe State Dwarka Delhi-broucher.pdf.pdf
The Omaxe State Dwarka Delhi-broucher.pdf.pdfThe Omaxe State Dwarka Delhi-broucher.pdf.pdf
The Omaxe State Dwarka Delhi-broucher.pdf.pdfkratirudram
 
Cashpay_Call Girls In Gaur City Mall Noida ❤️8860477959 Escorts Service In 24...
Cashpay_Call Girls In Gaur City Mall Noida ❤️8860477959 Escorts Service In 24...Cashpay_Call Girls In Gaur City Mall Noida ❤️8860477959 Escorts Service In 24...
Cashpay_Call Girls In Gaur City Mall Noida ❤️8860477959 Escorts Service In 24...lizamodels9
 
8 Key Elements for Comfortable Farmland Living
8 Key Elements for Comfortable Farmland Living 8 Key Elements for Comfortable Farmland Living
8 Key Elements for Comfortable Farmland Living Farmland Bazaar
 
call girls in Shahdara (DELHI) 🔝 >༒9953330565🔝 genuine Escort Service 🔝✔️✔️
call girls in Shahdara (DELHI) 🔝 >༒9953330565🔝 genuine Escort Service 🔝✔️✔️call girls in Shahdara (DELHI) 🔝 >༒9953330565🔝 genuine Escort Service 🔝✔️✔️
call girls in Shahdara (DELHI) 🔝 >༒9953330565🔝 genuine Escort Service 🔝✔️✔️9953056974 Low Rate Call Girls In Saket, Delhi NCR
 
9990771857 Call Girls in Noida Sector 06 Noida (Call Girls) Delhi
9990771857 Call Girls in Noida Sector 06 Noida (Call Girls) Delhi9990771857 Call Girls in Noida Sector 06 Noida (Call Girls) Delhi
9990771857 Call Girls in Noida Sector 06 Noida (Call Girls) Delhidelhimodel235
 
9990771857 Call Girls in Noida Sector 34 Noida (Call Girls) Delhi
9990771857 Call Girls in Noida Sector 34 Noida (Call Girls) Delhi9990771857 Call Girls in Noida Sector 34 Noida (Call Girls) Delhi
9990771857 Call Girls in Noida Sector 34 Noida (Call Girls) Delhidelhimodel235
 
Call Girls In Hari Nagar Dadb Block {8447779280}Hari Nagar {West Delhi Escort...
Call Girls In Hari Nagar Dadb Block {8447779280}Hari Nagar {West Delhi Escort...Call Girls In Hari Nagar Dadb Block {8447779280}Hari Nagar {West Delhi Escort...
Call Girls In Hari Nagar Dadb Block {8447779280}Hari Nagar {West Delhi Escort...asmaqueen5
 
Omaxe Dwarka In Delhi E Brochure Pdf
Omaxe Dwarka In Delhi E Brochure     PdfOmaxe Dwarka In Delhi E Brochure     Pdf
Omaxe Dwarka In Delhi E Brochure Pdfashiyadav24
 
Call Girls in Model Town Delhi 💯Call Us 🔝8264348440🔝
Call Girls in Model Town Delhi 💯Call Us 🔝8264348440🔝Call Girls in Model Town Delhi 💯Call Us 🔝8264348440🔝
Call Girls in Model Town Delhi 💯Call Us 🔝8264348440🔝soniya singh
 
SVN Live 4.22.24 Weekly Property Broadcast
SVN Live 4.22.24 Weekly Property BroadcastSVN Live 4.22.24 Weekly Property Broadcast
SVN Live 4.22.24 Weekly Property BroadcastSVN International Corp.
 
Call Girls in Nehru Place Delhi 💯Call Us 🔝8264348440🔝
Call Girls in Nehru Place Delhi 💯Call Us 🔝8264348440🔝Call Girls in Nehru Place Delhi 💯Call Us 🔝8264348440🔝
Call Girls in Nehru Place Delhi 💯Call Us 🔝8264348440🔝soniya singh
 
Low Rate Call Girls in Akshardham Delhi Call 9990771857
Low Rate Call Girls in Akshardham   Delhi Call 9990771857Low Rate Call Girls in Akshardham   Delhi Call 9990771857
Low Rate Call Girls in Akshardham Delhi Call 9990771857delhimodel235
 
9990771857 Call Girls in Noida Sector 1 Noida (Call Girls) Delhi
9990771857 Call Girls in Noida Sector 1 Noida (Call Girls) Delhi9990771857 Call Girls in Noida Sector 1 Noida (Call Girls) Delhi
9990771857 Call Girls in Noida Sector 1 Noida (Call Girls) Delhidelhimodel235
 
Rustomjee The Panorama At Pali Hill, Bandra West, Mumbai - Brochure.pdf
Rustomjee The Panorama At Pali Hill, Bandra West, Mumbai - Brochure.pdfRustomjee The Panorama At Pali Hill, Bandra West, Mumbai - Brochure.pdf
Rustomjee The Panorama At Pali Hill, Bandra West, Mumbai - Brochure.pdfmonikasharma630
 
9990771857 Call Girls in Noida Sector 03 Noida (Call Girls) Delhi
9990771857 Call Girls in Noida Sector 03 Noida (Call Girls) Delhi9990771857 Call Girls in Noida Sector 03 Noida (Call Girls) Delhi
9990771857 Call Girls in Noida Sector 03 Noida (Call Girls) Delhidelhimodel235
 
Call Girls In Madipur Metro Delhi꧁ +91)8447779280꧂Low Rate 2 short 2000 full ...
Call Girls In Madipur Metro Delhi꧁ +91)8447779280꧂Low Rate 2 short 2000 full ...Call Girls In Madipur Metro Delhi꧁ +91)8447779280꧂Low Rate 2 short 2000 full ...
Call Girls In Madipur Metro Delhi꧁ +91)8447779280꧂Low Rate 2 short 2000 full ...asmaqueen5
 
Call Girls in laxmi Nagar Delhi 💯Call Us 🔝 9582086666🔝 South Delhi Escorts Se...
Call Girls in laxmi Nagar Delhi 💯Call Us 🔝 9582086666🔝 South Delhi Escorts Se...Call Girls in laxmi Nagar Delhi 💯Call Us 🔝 9582086666🔝 South Delhi Escorts Se...
Call Girls in laxmi Nagar Delhi 💯Call Us 🔝 9582086666🔝 South Delhi Escorts Se...delhimodel235
 
Model Call Girl in Shastri Nagar Delhi reach out to us at 🔝8264348440🔝
Model Call Girl in Shastri Nagar Delhi reach out to us at 🔝8264348440🔝Model Call Girl in Shastri Nagar Delhi reach out to us at 🔝8264348440🔝
Model Call Girl in Shastri Nagar Delhi reach out to us at 🔝8264348440🔝soniya singh
 
Call Girls In Mundka Industrial Metro@꧂8447779280 ↬Enjoy ꧂Escort Service in ...
Call Girls In Mundka Industrial Metro@꧂8447779280 ↬Enjoy ꧂Escort Service in  ...Call Girls In Mundka Industrial Metro@꧂8447779280 ↬Enjoy ꧂Escort Service in  ...
Call Girls In Mundka Industrial Metro@꧂8447779280 ↬Enjoy ꧂Escort Service in ...asmaqueen5
 

Recently uploaded (20)

The Omaxe State Dwarka Delhi-broucher.pdf.pdf
The Omaxe State Dwarka Delhi-broucher.pdf.pdfThe Omaxe State Dwarka Delhi-broucher.pdf.pdf
The Omaxe State Dwarka Delhi-broucher.pdf.pdf
 
Cashpay_Call Girls In Gaur City Mall Noida ❤️8860477959 Escorts Service In 24...
Cashpay_Call Girls In Gaur City Mall Noida ❤️8860477959 Escorts Service In 24...Cashpay_Call Girls In Gaur City Mall Noida ❤️8860477959 Escorts Service In 24...
Cashpay_Call Girls In Gaur City Mall Noida ❤️8860477959 Escorts Service In 24...
 
8 Key Elements for Comfortable Farmland Living
8 Key Elements for Comfortable Farmland Living 8 Key Elements for Comfortable Farmland Living
8 Key Elements for Comfortable Farmland Living
 
call girls in Shahdara (DELHI) 🔝 >༒9953330565🔝 genuine Escort Service 🔝✔️✔️
call girls in Shahdara (DELHI) 🔝 >༒9953330565🔝 genuine Escort Service 🔝✔️✔️call girls in Shahdara (DELHI) 🔝 >༒9953330565🔝 genuine Escort Service 🔝✔️✔️
call girls in Shahdara (DELHI) 🔝 >༒9953330565🔝 genuine Escort Service 🔝✔️✔️
 
9990771857 Call Girls in Noida Sector 06 Noida (Call Girls) Delhi
9990771857 Call Girls in Noida Sector 06 Noida (Call Girls) Delhi9990771857 Call Girls in Noida Sector 06 Noida (Call Girls) Delhi
9990771857 Call Girls in Noida Sector 06 Noida (Call Girls) Delhi
 
9990771857 Call Girls in Noida Sector 34 Noida (Call Girls) Delhi
9990771857 Call Girls in Noida Sector 34 Noida (Call Girls) Delhi9990771857 Call Girls in Noida Sector 34 Noida (Call Girls) Delhi
9990771857 Call Girls in Noida Sector 34 Noida (Call Girls) Delhi
 
Call Girls In Hari Nagar Dadb Block {8447779280}Hari Nagar {West Delhi Escort...
Call Girls In Hari Nagar Dadb Block {8447779280}Hari Nagar {West Delhi Escort...Call Girls In Hari Nagar Dadb Block {8447779280}Hari Nagar {West Delhi Escort...
Call Girls In Hari Nagar Dadb Block {8447779280}Hari Nagar {West Delhi Escort...
 
Omaxe Dwarka In Delhi E Brochure Pdf
Omaxe Dwarka In Delhi E Brochure     PdfOmaxe Dwarka In Delhi E Brochure     Pdf
Omaxe Dwarka In Delhi E Brochure Pdf
 
Call Girls in Model Town Delhi 💯Call Us 🔝8264348440🔝
Call Girls in Model Town Delhi 💯Call Us 🔝8264348440🔝Call Girls in Model Town Delhi 💯Call Us 🔝8264348440🔝
Call Girls in Model Town Delhi 💯Call Us 🔝8264348440🔝
 
Call Girls in Mahavir Nagar whatsaap call US +919953056974
Call Girls in Mahavir Nagar  whatsaap call US  +919953056974Call Girls in Mahavir Nagar  whatsaap call US  +919953056974
Call Girls in Mahavir Nagar whatsaap call US +919953056974
 
SVN Live 4.22.24 Weekly Property Broadcast
SVN Live 4.22.24 Weekly Property BroadcastSVN Live 4.22.24 Weekly Property Broadcast
SVN Live 4.22.24 Weekly Property Broadcast
 
Call Girls in Nehru Place Delhi 💯Call Us 🔝8264348440🔝
Call Girls in Nehru Place Delhi 💯Call Us 🔝8264348440🔝Call Girls in Nehru Place Delhi 💯Call Us 🔝8264348440🔝
Call Girls in Nehru Place Delhi 💯Call Us 🔝8264348440🔝
 
Low Rate Call Girls in Akshardham Delhi Call 9990771857
Low Rate Call Girls in Akshardham   Delhi Call 9990771857Low Rate Call Girls in Akshardham   Delhi Call 9990771857
Low Rate Call Girls in Akshardham Delhi Call 9990771857
 
9990771857 Call Girls in Noida Sector 1 Noida (Call Girls) Delhi
9990771857 Call Girls in Noida Sector 1 Noida (Call Girls) Delhi9990771857 Call Girls in Noida Sector 1 Noida (Call Girls) Delhi
9990771857 Call Girls in Noida Sector 1 Noida (Call Girls) Delhi
 
Rustomjee The Panorama At Pali Hill, Bandra West, Mumbai - Brochure.pdf
Rustomjee The Panorama At Pali Hill, Bandra West, Mumbai - Brochure.pdfRustomjee The Panorama At Pali Hill, Bandra West, Mumbai - Brochure.pdf
Rustomjee The Panorama At Pali Hill, Bandra West, Mumbai - Brochure.pdf
 
9990771857 Call Girls in Noida Sector 03 Noida (Call Girls) Delhi
9990771857 Call Girls in Noida Sector 03 Noida (Call Girls) Delhi9990771857 Call Girls in Noida Sector 03 Noida (Call Girls) Delhi
9990771857 Call Girls in Noida Sector 03 Noida (Call Girls) Delhi
 
Call Girls In Madipur Metro Delhi꧁ +91)8447779280꧂Low Rate 2 short 2000 full ...
Call Girls In Madipur Metro Delhi꧁ +91)8447779280꧂Low Rate 2 short 2000 full ...Call Girls In Madipur Metro Delhi꧁ +91)8447779280꧂Low Rate 2 short 2000 full ...
Call Girls In Madipur Metro Delhi꧁ +91)8447779280꧂Low Rate 2 short 2000 full ...
 
Call Girls in laxmi Nagar Delhi 💯Call Us 🔝 9582086666🔝 South Delhi Escorts Se...
Call Girls in laxmi Nagar Delhi 💯Call Us 🔝 9582086666🔝 South Delhi Escorts Se...Call Girls in laxmi Nagar Delhi 💯Call Us 🔝 9582086666🔝 South Delhi Escorts Se...
Call Girls in laxmi Nagar Delhi 💯Call Us 🔝 9582086666🔝 South Delhi Escorts Se...
 
Model Call Girl in Shastri Nagar Delhi reach out to us at 🔝8264348440🔝
Model Call Girl in Shastri Nagar Delhi reach out to us at 🔝8264348440🔝Model Call Girl in Shastri Nagar Delhi reach out to us at 🔝8264348440🔝
Model Call Girl in Shastri Nagar Delhi reach out to us at 🔝8264348440🔝
 
Call Girls In Mundka Industrial Metro@꧂8447779280 ↬Enjoy ꧂Escort Service in ...
Call Girls In Mundka Industrial Metro@꧂8447779280 ↬Enjoy ꧂Escort Service in  ...Call Girls In Mundka Industrial Metro@꧂8447779280 ↬Enjoy ꧂Escort Service in  ...
Call Girls In Mundka Industrial Metro@꧂8447779280 ↬Enjoy ꧂Escort Service in ...
 

Rebgv stats-pkg-january-2018 2