
Recommended
Recommended
More Related Content
Similar to REBGV-Stats-Pkg-July-2022
Similar to REBGV-Stats-Pkg-July-2022 (20)
More from Vicky Aulakh
More from Vicky Aulakh (20)
Recently uploaded
Recently uploaded (20)
REBGV-Stats-Pkg-July-2022
- 1. News Release FOR IMMEDIATE RELEASE: Home buyer demand continues to ease across Metro Vancouver VANCOUVER, BC – August 3, 2022 – Metro Vancouver’s* housing market has entered a new cycle marked by quieter home buyer demand and a gradual rise in the supply of homes for sale. The Real Estate Board of Greater Vancouver (REBGV) reports that residential home sales in the region totalled 1,887 in July 2022, a 43.3 per cent decrease from the 3,326 sales recorded in July 2021, and a 22.8 per cent decrease from the 2,444 homes sold in June 2022. Last month’s sales were 35.2 per cent below the 10-year July sales average. “Home buyers are exercising more caution in today’s market in response to rising interest rates and inflationary concerns,” Daniel John, REBGV Chair said. “This allowed the selection of homes for sale to increase and prices to edge down in the region over the last three months.” There were 3,960 detached, attached and apartment properties newly listed for sale on the Multiple Listing Service® (MLS®) in Metro Vancouver in July 2022. This represents a 9.5 per cent decrease compared to the 4,377 homes listed in July 2021 and a 24.7 per cent decrease compared to June 2022 when 5,256 homes were listed. The total number of homes currently listed for sale on the MLS® system in Metro Vancouver is 10,288, a 4.4 per cent increase compared to July 2021 (9,850) and a 1.3 per cent decrease compared to June 2022 (10,425). “After two years of market conditions that favoured home sellers, home buyers now have more selection to choose from and more time to make their decision,” John said. “In today’s changing housing market, both home buyers and sellers should invest the time to understand what these changes mean for their personal circumstances.” For all property types, the sales-to-active listings ratio for July 2022 is 18.3 per cent. By property type, the ratio is 11.8 per cent for detached homes, 20 per cent for townhomes, and 24.5 per cent for apartments. Generally, analysts say downward pressure on home prices occurs when the ratio dips below 12 per cent for a sustained period, while home prices often experience upward pressure when it surpasses 20 per cent over several months. The MLS® Home Price Index composite benchmark price for all residential properties in Metro Vancouver is currently $1,207,400. This represents a 10.3 per cent increase over July 2021 and a 2.3 per cent decrease compared to June 2022.
- 2. Sales of detached homes in July 2022 reached 523, a 50.2 per cent decrease from the 1,050 detached sales recorded in July 2021. The benchmark price for a detached home is $2,000,600. This represents an 11 per cent increase from July 2021 and a 2.8 per cent decrease compared to June 2022. Sales of apartment homes reached 1,060 in July 2022, a 36.4 per cent decrease compared to the 1,666 sales in July 2021. The benchmark price of an apartment home is $755,000. This represents an 11.4 per cent increase from July 2021 and a 1.5 per cent decrease compared to June 2022. Attached home sales in July 2022 totalled 304, a 50.2 per cent decrease compared to the 610 sales in July 2021. The benchmark price of an attached home is $1,096,500. This represents a 15.8 per cent increase from July 2021 and a 1.7 per cent decrease compared to June 2022. -30- *Editor’s Note: Areas covered by the Real Estate Board of Greater Vancouver include: Burnaby, Coquitlam, Maple Ridge, New Westminster, North Vancouver, Pitt Meadows, Port Coquitlam, Port Moody, Richmond, South Delta, Squamish, Sunshine Coast, Vancouver, West Vancouver, and Whistler. The real estate industry is a key economic driver in British Columbia. In 2021, 43,999 homes changed ownership in the Board’s area, generating $2.98 billion in economic spin-off activity and an estimated 20,942 jobs. The total dollar value of residential sales transacted through the MLS® system in Greater Vancouver totalled $53.4 billion in 2021. The Real Estate Board of Greater Vancouver is an association representing more than 14,000 REALTORS® and their companies. The Board provides a variety of member services, including the Multiple Listing Service®. For more information on real estate, statistics, and buying or selling a home, contact a local REALTOR® or visit www.rebgv.org. For more information please contact: Mark Moldowan Senior Writer & Communication Strategist Real Estate Board of Greater Vancouver 604.730.3153 mmoldowan@rebgv.org
- 3. Property Type Area Benchmark Price Price Index 1 Month Change % 3 Month Change % 6 Month Change % 1 Year Change % 3 Year Change % 5 Year Change % 10 Year Change % Residential / Composite Lower Mainland $1,201,400 364.1 -2.6% -6.0% 0.6% 14.5% 42.8% 33.2% 120.3% Greater Vancouver $1,207,400 341.1 -2.3% -4.5% 1.5% 10.3% 35.7% 14.2% 83.1% Bowen Island $1,619,000 341.3 -2.8% -3.3% 9.4% 19.5% 78.4% 76.3% 178.6% Burnaby East $1,154,200 361.1 -2.1% -5.4% 1.9% 13.1% 28.9% 15.3% 99.0% Burnaby North $1,051,100 349.3 -1.8% -2.3% 5.6% 12.0% 37.1% 20.2% 101.9% Burnaby South $1,100,600 344.3 -4.2% -7.2% -0.3% 9.1% 29.6% 15.3% 94.7% Coquitlam $1,134,600 353.1 -1.7% -6.6% 1.3% 13.3% 42.1% 30.0% 116.9% Ladner $1,169,300 338.9 -1.7% -5.2% -0.5% 15.7% 49.2% 37.0% 116.7% Maple Ridge $1,041,700 359.5 -2.8% -8.5% -2.1% 16.2% 60.2% 57.7% 163.6% New Westminster $834,200 375.3 -1.3% -3.7% 3.8% 13.8% 37.8% 31.5% 115.4% North Vancouver $1,410,500 325.0 -2.0% -4.7% 1.8% 10.4% 35.1% 16.7% 99.3% Pitt Meadows $955,500 373.7 -3.3% -7.5% -2.1% 19.4% 56.5% 56.2% 159.9% Port Coquitlam $946,100 364.3 -3.6% -8.7% 0.2% 15.7% 49.6% 43.7% 141.3% Port Moody $1,197,300 377.3 -1.0% -2.1% 10.7% 19.3% 55.5% 42.1% 150.9% Richmond $1,162,400 380.0 -2.1% -3.1% 2.4% 11.9% 35.7% 13.6% 89.1% Squamish $1,189,400 391.0 -0.9% 1.2% 9.6% 18.8% 56.3% 62.8% 185.6% Sunshine Coast $920,400 339.0 -2.3% -1.9% 9.2% 20.1% 69.9% 74.7% 175.8% Tsawwassen $1,257,800 327.7 -4.8% -6.5% 0.8% 14.2% 38.0% 22.3% 100.7% Vancouver East $1,196,600 372.0 -2.2% -4.4% 1.6% 9.2% 33.9% 15.1% 95.2% Vancouver West $1,315,300 308.6 -2.2% -4.9% -2.3% 1.9% 17.3% -8.9% 47.7% West Vancouver $2,809,500 303.5 -3.3% -1.1% 3.1% 6.0% 32.9% -3.1% 59.8% Whistler $1,560,700 343.8 -0.8% 2.0% 9.8% 20.2% 64.9% 81.3% 180.0% Single Family Detached Lower Mainland $1,868,800 409.2 -3.3% -7.6% -1.8% 14.8% 52.9% 41.0% 144.0% Greater Vancouver $2,000,600 372.5 -2.8% -4.8% 1.0% 11.0% 41.0% 15.2% 88.0% Bowen Island $1,619,100 341.2 -2.8% -3.2% 9.4% 19.5% 78.4% 76.4% 178.8% Burnaby East $1,805,400 384.0 -4.4% -8.7% -3.2% 13.9% 32.8% 21.0% 116.1% Burnaby North $2,076,700 396.8 -2.4% -2.3% 7.6% 15.1% 47.6% 25.2% 117.1% Burnaby South $2,108,600 391.6 -7.2% -9.9% -2.3% 9.3% 35.5% 11.9% 103.4% Coquitlam $1,853,500 424.0 -1.1% -5.5% 2.4% 16.7% 52.1% 41.9% 155.6% Ladner $1,460,300 352.6 -1.5% -5.7% -3.2% 15.6% 55.7% 41.8% 125.0% Maple Ridge $1,343,800 392.9 -2.6% -8.6% -3.4% 16.4% 63.4% 65.4% 181.9% New Westminster $1,487,200 371.7 -3.5% -8.2% -2.1% 11.8% 39.4% 26.0% 114.7% North Vancouver $2,276,300 355.1 -2.1% -4.8% 1.4% 10.7% 41.9% 22.4% 120.3% Pitt Meadows $1,335,900 394.7 -3.9% -9.3% -7.2% 17.1% 55.1% 57.1% 169.2% Port Coquitlam $1,395,500 394.4 -2.3% -9.3% -3.5% 17.1% 56.9% 47.1% 159.6% Port Moody $2,181,900 413.2 -0.9% -1.6% 11.3% 21.1% 58.0% 45.1% 164.7% Richmond $2,129,600 434.7 -1.4% -3.1% 2.7% 11.5% 37.1% 16.3% 101.5% Squamish $1,787,300 443.2 -1.5% 1.1% 7.5% 17.4% 63.3% 71.5% 238.8% Sunshine Coast $997,000 347.6 -2.8% -3.0% 8.2% 20.0% 73.6% 79.3% 181.5% Tsawwassen $1,595,700 353.4 -5.5% -7.8% -1.2% 13.6% 44.2% 30.3% 119.1% Vancouver East $1,823,500 408.0 -4.2% -6.1% -0.6% 8.7% 37.0% 18.6% 116.6% Vancouver West $3,381,800 352.9 -3.4% -4.3% -1.0% 1.3% 20.4% -7.5% 57.2% West Vancouver $3,376,200 314.0 -3.3% -0.3% 3.3% 6.9% 31.9% -0.9% 65.3% Whistler $2,805,600 378.9 -0.1% 2.0% 7.2% 22.7% 69.8% 75.9% 198.6% HOW TO READ THE TABLE: • Benchmark Price: Estimated sale price of a benchmark property. Benchmarks represent a typical property within each market. • Price Index: Index numbers estimate the percentage change in price on typical and constant quality properties over time. All figures are based on past sales. • x Month/Year Change %: Percentage change of index over a period of x month(s)/year(s) * In January 2005, the indexes are set to 100. Townhome properties are similar to Attached properties, a category that was used in the previous MLSLink HPI, but do not included duplexes. The above info is deemed reliable, but is not guaranteed. All dollar amounts in CDN. July 2022 * * MLS®, Multiple Listing Service®, and all related graphics are trademarks of The Canadian Real Estate Association 1 of 19
- 4. Property Type Area Benchmark Price Price Index 1 Month Change % 3 Month Change % 6 Month Change % 1 Year Change % 3 Year Change % 5 Year Change % 10 Year Change % July 2022 * Townhouse Lower Mainland $989,700 374.4 -2.0% -5.3% 4.1% 19.5% 48.3% 53.5% 149.3% Greater Vancouver $1,096,500 377.7 -1.7% -4.5% 4.3% 15.8% 40.4% 39.9% 132.3% Burnaby East $904,000 380.6 1.8% 1.9% 7.4% 17.7% 34.5% 40.5% 131.1% Burnaby North $942,600 382.7 -4.0% -1.1% 11.8% 18.3% 36.6% 44.9% 138.4% Burnaby South $990,500 368.1 -4.9% -5.8% 4.4% 12.2% 30.3% 31.6% 124.5% Coquitlam $1,080,700 418.6 -0.5% -6.0% 4.9% 18.7% 50.7% 52.7% 170.8% Ladner $974,800 374.3 -1.6% -5.0% 0.9% 16.2% 38.2% 37.3% 134.4% Maple Ridge $792,900 393.9 -4.9% -10.2% 0.7% 15.8% 54.8% 61.6% 187.3% New Westminster $945,300 402.4 -0.7% -0.7% 6.3% 21.3% 48.0% 49.1% 142.4% North Vancouver $1,336,400 363.0 -0.8% -3.6% 4.9% 18.9% 47.3% 40.0% 133.6% Pitt Meadows $855,000 414.2 -3.0% -7.2% 0.9% 17.1% 54.3% 56.6% 182.5% Port Coquitlam $915,000 366.4 -6.7% -11.3% 1.1% 13.4% 43.8% 46.5% 152.0% Port Moody $1,122,000 426.0 0.5% -1.3% 13.2% 23.4% 55.9% 63.8% 185.1% Richmond $1,079,900 387.3 -2.6% -4.2% 3.3% 16.3% 37.3% 33.7% 122.5% Squamish $1,077,700 388.5 0.9% -1.5% 9.6% 16.1% 48.6% 66.9% 210.3% Sunshine Coast $773,700 350.9 0.4% -1.9% 10.0% 15.7% 52.6% 71.8% 183.4% Tsawwassen $989,600 310.5 -1.4% -4.6% 1.0% 15.8% 22.5% 14.2% 90.7% Vancouver East $1,149,800 376.5 1.7% -0.3% 8.1% 15.6% 35.5% 30.1% 116.0% Vancouver West $1,463,100 327.2 -1.5% -5.5% -2.9% 7.0% 21.0% 13.3% 91.0% Whistler $1,536,400 391.6 0.3% -1.9% 12.2% 18.8% 57.5% 88.0% 224.4% Apartment Lower Mainland $766,200 379.6 -1.8% -3.7% 3.7% 14.6% 30.8% 39.4% 132.7% Greater Vancouver $755,000 344.9 -1.5% -2.8% 3.6% 11.4% 25.2% 25.6% 107.9% Burnaby East $814,700 342.2 -0.2% -3.4% 6.6% 13.0% 26.9% 24.1% 100.6% Burnaby North $734,800 370.9 -0.8% -1.4% 5.7% 14.9% 32.1% 40.4% 121.2% Burnaby South $778,600 370.6 -1.1% -3.6% 2.9% 11.0% 25.5% 29.6% 119.7% Coquitlam $680,600 386.0 -2.8% -5.9% 2.7% 12.4% 27.7% 37.7% 142.3% Ladner $704,700 358.4 -4.2% -3.6% 10.8% 13.6% 48.5% 53.9% 128.0% Maple Ridge $558,300 385.6 -1.1% -2.7% 7.0% 25.2% 48.4% 79.0% 179.8% New Westminster $661,500 396.6 -0.4% -1.7% 7.1% 15.0% 30.2% 39.2% 134.8% North Vancouver $803,300 320.8 -2.0% -3.2% 4.2% 12.1% 24.4% 22.2% 112.5% Pitt Meadows $631,800 426.0 -1.0% -3.3% 5.9% 22.4% 41.7% 69.5% 193.0% Port Coquitlam $626,600 426.0 -3.3% -5.0% 6.9% 16.1% 40.0% 52.9% 177.0% Port Moody $726,300 387.2 -2.8% -3.8% 5.6% 12.2% 31.7% 43.6% 145.4% Richmond $724,400 391.4 -2.9% -1.1% 3.7% 13.3% 27.6% 36.6% 122.5% Squamish $672,100 398.6 -2.5% 6.4% 18.5% 28.2% 59.8% 70.4% 205.4% Sunshine Coast $650,700 372.9 -1.0% 7.2% 16.2% 24.5% 53.0% 49.6% 159.1% Tsawwassen $731,900 341.7 -4.1% -2.8% 10.4% 12.8% 35.9% 34.4% 114.6% Vancouver East $720,000 412.4 0.5% -1.2% 4.9% 9.6% 24.1% 23.1% 120.4% Vancouver West $844,300 318.7 -1.2% -4.0% -0.3% 6.4% 15.3% 11.3% 92.9% West Vancouver $1,243,300 242.8 -1.0% -6.0% 2.9% 5.5% 11.4% 7.3% 70.3% Whistler $758,600 327.0 -2.9% 8.0% 17.3% 29.3% 70.8% 85.3% 182.1% HOW TO READ THE TABLE: • Benchmark Price: Estimated sale price of a benchmark property. Benchmarks represent a typical property within each market. • Price Index: Index numbers estimate the percentage change in price on typical and constant quality properties over time. All figures are based on past sales. • x Month/Year Change %: Percentage change of index over a period of x month(s)/year(s) In January 2005, the indexes are set to 100. * Townhome properties are similar to attached properties, a category that was used in the previous MLSLink HPI, but do not included duplexes. Lower Mainland includes areas serviced by both Real Estate Board of Greater Vancouver & Fraser Valley Real Estate Board. The above info is deemed reliable, but is not guaranteed. All dollar amounts in CDN. * MLS®, Multiple Listing Service®, and all related graphics are trademarks of The Canadian Real Estate Association 2 of 19
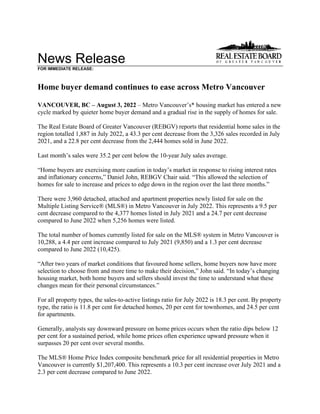
- 5. C:DATAMonthEndHpiexporthi_resgv-hpi2.tif Greater Vancouver 5 Year Trend 60 110 160 210 260 310 360 410 460 Jul 2017 Sep 2017 Nov 2017 Jan 2018 Mar 2018 May 2018 Jul 2018 Sep 2018 Nov 2018 Jan 2019 Mar 2019 May 2019 Jul 2019 Sep 2019 Nov 2019 Jan 2020 Mar 2020 May 2020 Jul 2020 Sep 2020 Nov 2020 Jan 2021 Mar 2021 May 2021 Jul 2021 Sep 2021 Nov 2021 Jan 2022 Mar 2022 May 2022 Jul 2022 Price Index Residential Detached Townhouse Apartment Jan 2005 HPI = 100
- 8. Listing & Sales Activity Summary Listings Sales 1 2 3 Col. 2 & 3 5 6 7 Col. 6 & 7 9 10 Col. 9 & 10 Jul Jun Jul Percentage Jul Jun Jul Percentage May 2021 - May 2022 - Percentage 2021 2022 2022 Variance 2021 2022 2022 Variance Jul 2021 Jul 2022 Variance BURNABY % % % DETACHED 109 128 108 -15.6 98 51 54 5.9 315 172 -45.4 ATTACHED 114 89 75 -15.7 90 46 38 -17.4 299 138 -53.8 APARTMENTS 362 364 298 -18.1 251 208 180 -13.5 820 634 -22.7 COQUITLAM DETACHED 99 137 88 -35.8 102 47 49 4.3 383 163 -57.4 ATTACHED 54 60 47 -21.7 48 22 21 -4.5 167 94 -43.7 APARTMENTS 186 163 144 -11.7 142 120 72 -40.0 420 317 -24.5 DELTA DETACHED 54 83 63 -24.1 47 31 24 -22.6 184 94 -48.9 ATTACHED 21 26 11 -57.7 20 17 8 -52.9 74 43 -41.9 APARTMENTS 21 23 19 -17.4 28 21 9 -57.1 101 45 -55.4 MAPLE RIDGE/PITT MEADOWS DETACHED 150 263 183 -30.4 127 65 63 -3.1 453 220 -51.4 ATTACHED 50 112 69 -38.4 57 44 40 -9.1 209 141 -32.5 APARTMENTS 66 76 69 -9.2 41 48 28 -41.7 182 125 -31.3 NORTH VANCOUVER DETACHED 86 173 103 -40.5 72 62 44 -29.0 320 187 -41.6 ATTACHED 48 81 51 -37.0 39 39 24 -38.5 162 106 -34.6 APARTMENTS 162 205 144 -29.8 137 97 105 8.2 443 356 -19.6 NEW WESTMINSTER DETACHED 36 40 26 -35.0 29 14 11 -21.4 103 45 -56.3 ATTACHED 22 26 16 -38.5 20 16 8 -50.0 57 38 -33.3 APARTMENTS 143 116 105 -9.5 113 81 63 -22.2 348 226 -35.1 PORT MOODY/BELCARRA DETACHED 26 42 18 -57.1 21 14 14 0.0 76 40 -47.4 ATTACHED 17 27 21 -22.2 47 22 6 -72.7 105 44 -58.1 APARTMENTS 37 46 40 -13.0 22 21 25 19.0 103 75 -27.2 PORT COQUITLAM DETACHED 43 52 44 -15.4 39 31 21 -32.3 143 79 -44.8 ATTACHED 23 24 38 58.3 24 23 15 -34.8 94 59 -37.2 APARTMENTS 41 75 52 -30.7 39 40 34 -15.0 166 117 -29.5 RICHMOND DETACHED 175 180 145 -19.4 94 72 54 -25.0 382 203 -46.9 ATTACHED 124 118 92 -22.0 98 89 47 -47.2 335 203 -39.4 APARTMENTS 308 319 187 -41.4 236 176 121 -31.3 685 491 -28.3 SUNSHINE COAST DETACHED 95 120 103 -14.2 77 50 34 -32.0 223 139 -37.7 ATTACHED 13 8 8 0.0 7 3 3 0.0 29 20 -31.0 APARTMENTS 15 5 13 160.0 5 3 5 66.7 31 14 -54.8 SQUAMISH DETACHED 23 52 30 -42.3 14 18 14 -22.2 64 51 -20.3 ATTACHED 15 25 21 -16.0 13 17 9 -47.1 71 43 -39.4 APARTMENTS 7 27 21 -22.2 15 10 3 -70.0 64 26 -59.4 VANCOUVER EAST DETACHED 140 233 139 -40.3 144 77 54 -29.9 489 225 -54.0 ATTACHED 73 100 105 5.0 57 51 43 -15.7 190 147 -22.6 APARTMENTS 264 235 190 -19.1 158 137 101 -26.3 601 409 -31.9 VANCOUVER WEST DETACHED 168 206 142 -31.1 93 71 46 -35.2 325 201 -38.2 ATTACHED 87 109 98 -10.1 57 54 28 -48.1 237 149 -37.1 APARTMENTS 654 751 586 -22.0 419 323 294 -9.0 1358 1047 -22.9 WHISTLER/PEMBERTON DETACHED 25 39 30 -23.1 24 10 7 -30.0 68 26 -61.8 ATTACHED 15 32 24 -25.0 24 14 10 -28.6 83 47 -43.4 APARTMENTS 42 40 33 -17.5 38 20 7 -65.0 104 57 -45.2 WEST VANCOUVER/HOWE SOUND DETACHED 117 140 102 -27.1 54 32 30 -6.3 174 108 -37.9 ATTACHED 13 11 10 -9.1 8 8 4 -50.0 23 17 -26.1 APARTMENTS 27 50 32 -36.0 21 20 13 -35.0 61 51 -16.4 GRAND TOTALS DETACHED 1346 1888 1324 -29.9 1035 645 519 -19.5 3702 1953 -47.2 ATTACHED 689 848 686 -19.1 609 465 304 -34.6 2135 1289 -39.6 APARTMENTS 2335 2495 1933 -22.5 1665 1325 1060 -20.0 5487 3990 -27.3