SlideShare a Scribd company logo
1 of 9
Download to read offline
News Release
FOR IMMEDIATE RELEASE:
Metro Vancouver sees fewer home sales and more listings in July
VANCOUVER, BC – August 2, 2017 – Home buyer activity returned to more typical summer
levels in Metro Vancouver* last month.
The Real Estate Board of Greater Vancouver (REBGV) reports that residential property sales in
the region totalled 2,960 in July 2017, an 8.2 per cent decrease from the 3,226 sales recorded in
July 2016, and a decrease of 24 per cent compared to June 2017 when 3,893 homes sold.
Last month’s sales were 0.7 per cent above the 10-year July sales average.
“Housing demand is inconsistent across the region right now. Pockets of the market are still
receiving multiple offers and others are not. It depends on price, property type, and location,” Jill
Oudil, REBGV president said. “For example, it’s taking twice as long, on average, for a detached
home to sell compared to both townhomes and condominiums.”
There were 5,256 detached, attached and apartment properties newly listed for sale on the
Multiple Listing Service® (MLS®) in Metro Vancouver in July 2017. This represents a 0.3 per
cent increase compared to the 5,241 homes listed in July 2016 and an 8.1 per cent decrease
compared to June 2017 when 5,721 homes were listed.
The total number of properties currently listed for sale on the MLS® system in Metro Vancouver
is 9,194, a 10.1 per cent increase compared to July 2016 (8,351) and an eight per cent increase
compared to June 2017 (8,515).
“Because home sale activity decreased to more historically normal levels in July, the selection of
homes for sale in the region was able to edge above 9,000 for the first time this year,” Oudil,
said.
For all property types, the sales-to-active listings ratio for July 2017 is 32.2 per cent. By property
type, the ratio is 16.9 per cent for detached homes, 44.9 per cent for townhomes, and 62 per cent
for condominiums.
Generally, analysts say that downward pressure on home prices occurs when the ratio dips below
the 12 per cent mark for a sustained period, while home prices often experience upward pressure
when it surpasses 20 per cent over several months.
The MLS® Home Price Index composite benchmark price for all residential properties in Metro
Vancouver is currently $1,019,400. This represents an 8.7 per cent increase over July 2016 and a
2.1 per cent increase compared to June 2017.
Sales of detached properties in July 2017 reached 949, a decrease of 11.9 per cent from the 1,077
detached sales recorded in July 2016. The benchmark price for detached properties is
$1,612,400. This represents a 1.9 per cent increase from July 2016 and a 1.5 per cent increase
compared to June 2017.
Sales of apartment properties reached 1,468 in July 2017, a decrease of 8.4 per cent compared to
the 1,602 sales in July 2016. The benchmark price of an apartment property is $616,600. This
represents an 18.5 per cent increase from July 2016 and a 2.7 per cent increase compared to June
2017.
Attached property sales in July 2017 totalled 543, a decrease of 0.7 per cent compared to the 547
sales in July 2016. The benchmark price of an attached unit is $763,700. This represents an 11.9
per cent increase from July 2016 and a 2.4 per cent increase compared to June 2017.
-30-
*Editor’s Note: Areas covered by the Real Estate Board of Greater Vancouver include: Whistler, Sunshine Coast,
Squamish, West Vancouver, North Vancouver, Vancouver, Burnaby, New Westminster, Richmond, Port Moody,
Port Coquitlam, Coquitlam, Pitt Meadows, Maple Ridge, and South Delta.
The real estate industry is a key economic driver in British Columbia. In 2016, 39,943 homes changed ownership in
the Board’s area, generating $2.5 billion in economic spin-off activity and an estimated 17,600 jobs. The total dollar
value of residential sales transacted through the MLS® system in Greater Vancouver totalled $40 billion in 2016.
The Real Estate Board of Greater Vancouver is an association representing more than 13,500 REALTORS® and
their companies. The Board provides a variety of member services, including the Multiple Listing Service®. For
more information on real estate, statistics, and buying or selling a home, contact a local REALTOR® or visit
www.rebgv.org.
For more information please contact:
Craig Munn
Manager, Communication
Real Estate Board of Greater Vancouver
604.730.3146
cmunn@rebgv.org
Property Type Area
Benchmark
Price
Price
Index
1 Month
Change %
3 Month
Change %
6 Month
Change %
1 Year
Change %
3 Year
Change %
5 Year
Change %
10 Year
Change %
Residential / Composite Lower Mainland $919,400 259.4 2.6% 7.4% 13.2% 10.3% 62.4% 65.3% 85.8%
Greater Vancouver $1,019,400 266.5 2.1% 6.7% 12.5% 8.7% 60.5% 64.5% 90.8%
Bowen Island $913,300 198.0 2.4% 4.0% 10.0% 15.2% 53.7% 52.0% 44.9%
Burnaby East $941,200 261.8 2.6% 8.0% 12.5% 9.5% 57.3% 65.0% 87.1%
Burnaby North $862,400 260.4 0.7% 4.5% 10.7% 9.3% 58.1% 64.7% 86.8%
Burnaby South $976,100 275.7 2.0% 6.4% 11.0% 11.2% 63.3% 67.5% 99.1%
Coquitlam $885,300 262.6 2.5% 7.8% 17.0% 11.8% 67.5% 73.8% 91.4%
Ladner $846,800 237.7 2.7% 4.6% 7.2% 0.4% 54.7% 52.9% 77.7%
Maple Ridge $651,000 218.9 3.2% 8.9% 13.5% 14.7% 63.4% 64.6% 62.3%
New Westminster $629,400 269.8 4.6% 10.7% 17.5% 18.2% 64.7% 67.9% 86.2%
North Vancouver $1,087,200 244.3 2.1% 6.7% 11.9% 6.1% 58.7% 64.0% 79.6%
Pitt Meadows $632,100 231.2 2.4% 8.7% 13.1% 16.6% 60.1% 70.0% 65.6%
Port Coquitlam $704,200 248.4 2.8% 9.6% 19.2% 14.9% 69.0% 72.0% 77.4%
Port Moody $866,100 239.4 2.1% 7.3% 13.0% 12.5% 61.5% 69.4% 75.0%
Richmond $966,500 282.2 1.9% 6.3% 11.4% 7.6% 61.0% 64.0% 104.5%
Squamish $738,700 236.5 2.7% 1.9% 9.7% 18.7% 82.3% 84.9% 88.1%
Sunshine Coast $567,400 198.8 1.8% 5.7% 12.1% 20.9% 59.3% 55.4% 45.9%
Tsawwassen $987,100 247.9 2.9% 4.2% 8.3% -0.3% 60.8% 58.8% 83.9%
Vancouver East $1,073,400 314.3 2.6% 7.5% 12.7% 8.8% 65.9% 73.4% 118.4%
Vancouver West $1,344,000 283.4 1.2% 6.4% 12.7% 6.5% 57.7% 64.0% 97.8%
West Vancouver $2,653,800 285.3 1.0% 5.3% 9.2% -4.2% 53.5% 63.1% 98.1%
Whistler $842,800 185.3 3.4% 0.4% 7.8% 16.9% 73.8% 65.9% 50.7%
Single Family Detached Lower Mainland $1,320,300 280.1 2.2% 6.7% 10.4% 4.6% 65.5% 70.6% 103.9%
Greater Vancouver $1,612,400 296.3 1.5% 5.6% 9.0% 1.9% 63.5% 68.5% 114.4%
Bowen Island $913,300 198.0 2.4% 4.0% 10.0% 15.2% 53.7% 52.0% 44.9%
Burnaby East $1,286,100 287.6 2.1% 7.2% 11.8% 2.9% 62.5% 70.0% 109.3%
Burnaby North $1,585,500 306.6 0.7% 3.8% 7.1% -1.2% 61.3% 71.1% 123.0%
Burnaby South $1,718,600 329.0 -0.1% 5.3% 5.1% 0.5% 68.2% 72.0% 140.3%
Coquitlam $1,276,500 283.3 1.6% 7.2% 15.2% 3.9% 69.8% 77.5% 108.6%
Ladner $1,010,200 243.5 3.5% 4.3% 4.4% -2.2% 59.7% 58.2% 84.5%
Maple Ridge $793,600 226.1 2.3% 8.3% 11.5% 12.4% 67.7% 71.7% 71.7%
New Westminster $1,151,300 287.2 2.3% 6.6% 12.6% 5.1% 64.7% 68.7% 108.3%
North Vancouver $1,716,800 268.5 1.6% 5.6% 8.5% 0.5% 67.6% 75.5% 99.9%
Pitt Meadows $868,000 244.6 3.3% 9.1% 12.7% 13.1% 68.6% 75.5% 80.9%
Port Coquitlam $995,400 265.4 0.5% 7.3% 19.0% 7.8% 72.7% 77.2% 95.9%
Port Moody $1,446,300 267.1 0.1% 5.3% 7.7% 3.6% 61.1% 69.4% 94.8%
Richmond $1,682,000 337.8 1.9% 5.0% 7.6% -1.7% 68.6% 70.4% 140.9%
Squamish $970,100 247.6 2.4% 4.9% 14.3% 19.5% 78.8% 86.2% 95.7%
Sunshine Coast $564,300 197.7 2.0% 6.0% 12.3% 20.8% 59.4% 55.2% 45.2%
Tsawwassen $1,263,200 272.0 3.5% 5.0% 8.7% -0.5% 70.6% 71.0% 102.8%
Vancouver East $1,561,700 345.2 1.8% 5.9% 8.4% 2.2% 67.7% 81.1% 149.1%
Vancouver West $3,666,200 376.4 1.1% 4.9% 7.2% 2.1% 61.1% 68.8% 150.3%
West Vancouver $3,180,000 300.2 1.7% 5.1% 8.4% -6.1% 54.7% 64.4% 109.1%
Whistler $1,594,700 202.2 1.8% 4.5% 12.3% 17.8% 65.2% 66.1% 65.5%
HOW TO READ THE TABLE:
• Benchmark Price: Estimated sale price of a benchmark property. Benchmarks represent a typical property within each market.
• Price Index: Index numbers estimate the percentage change in price on typical and constant quality properties over time. All figures are based on past sales.
• x Month/Year Change %: Percentage change of index over a period of x month(s)/year(s) *
In January 2005, the indexes are set to 100.
Townhome properties are similar to Attached properties, a category that was used in the previous MLSLink HPI, but do not included duplexes.
The above info is deemed reliable, but is not guaranteed. All dollar amounts in CDN.
July 2017*
* MLS®, Multiple Listing Service®, and all related graphics are trademarks of The Canadian Real Estate Association 1 of 15
Property Type Area
Benchmark
Price
Price
Index
1 Month
Change %
3 Month
Change %
6 Month
Change %
1 Year
Change %
3 Year
Change %
5 Year
Change %
10 Year
Change %
July 2017*
Townhouse Lower Mainland $643,300 232.5 3.1% 6.6% 13.0% 14.0% 58.2% 58.2% 70.3%
Greater Vancouver $763,700 246.4 2.4% 5.2% 11.6% 11.9% 56.8% 59.8% 80.5%
Burnaby East $614,300 226.9 0.5% 5.2% 10.8% 21.9% 43.3% 46.0% 65.1%
Burnaby North $689,300 257.3 0.2% 6.2% 15.7% 16.6% 55.6% 62.1% 81.1%
Burnaby South $755,400 260.2 1.6% 7.2% 11.0% 16.1% 54.2% 62.8% 89.1%
Coquitlam $631,000 231.5 2.2% 4.5% 15.1% 15.8% 57.8% 61.3% 73.3%
Ladner $738,200 257.4 0.9% 6.5% 15.5% 11.1% 56.7% 61.4% 87.2%
Maple Ridge $500,600 232.4 6.2% 11.3% 20.7% 21.6% 67.9% 67.8% 68.2%
New Westminster $646,600 255.7 0.9% 4.6% 12.9% 11.2% 51.8% 59.7% 84.4%
North Vancouver $950,300 230.9 1.3% 4.3% 12.6% 6.1% 57.0% 59.2% 73.7%
Pitt Meadows $544,000 235.4 1.5% 9.2% 12.5% 16.3% 67.0% 69.1% 67.8%
Port Coquitlam $625,300 235.9 5.7% 9.9% 15.6% 14.6% 63.8% 65.0% 71.2%
Port Moody $597,400 201.9 2.2% 9.3% 16.6% 10.2% 44.3% 44.9% 47.4%
Richmond $787,500 258.8 2.8% 5.8% 9.9% 9.7% 54.0% 57.1% 93.1%
Squamish $669,400 243.2 -1.6% -10.9% -5.0% 10.4% 88.1% 104.5% 98.9%
Tsawwassen $726,200 270.5 -0.8% 5.1% 16.9% 17.0% 63.1% 64.0% 96.7%
Vancouver East $854,900 280.6 5.1% 10.9% 14.7% 10.7% 60.6% 60.9% 91.5%
Vancouver West $1,232,000 272.1 1.7% 4.2% 10.2% 9.5% 56.6% 66.4% 95.9%
Whistler $767,700 205.3 -1.8% -12.0% -5.1% 1.7% 58.5% 61.0% 76.1%
Apartment Lower Mainland $565,700 247.3 3.1% 9.2% 18.7% 20.7% 62.1% 62.7% 71.5%
Greater Vancouver $616,600 247.8 2.7% 8.8% 18.1% 18.5% 60.8% 63.5% 74.1%
Burnaby East $647,400 245.8 7.1% 15.1% 21.4% 17.8% 56.6% 77.0% 64.1%
Burnaby North $550,900 235.2 1.1% 5.1% 14.0% 19.9% 58.1% 63.2% 67.9%
Burnaby South $637,800 256.1 3.3% 7.1% 15.7% 19.2% 65.0% 68.5% 82.9%
Coquitlam $459,400 252.1 3.8% 10.4% 21.4% 26.7% 72.8% 77.9% 78.2%
Ladner $406,600 192.7 2.3% 2.8% 6.8% -1.2% 30.7% 23.4% 41.2%
Maple Ridge $236,900 171.1 1.8% 8.4% 14.4% 22.5% 39.1% 32.6% 16.0%
New Westminster $467,000 266.2 5.9% 13.1% 20.3% 26.0% 67.3% 69.3% 80.0%
North Vancouver $545,100 221.9 3.2% 9.6% 18.2% 17.2% 51.0% 53.2% 60.0%
Pitt Meadows $356,100 210.5 2.1% 8.1% 15.0% 22.5% 44.5% 65.0% 42.7%
Port Coquitlam $401,000 239.8 3.6% 12.0% 22.2% 26.7% 70.8% 73.9% 61.8%
Port Moody $576,600 240.3 4.0% 8.6% 16.9% 25.4% 71.6% 84.0% 76.0%
Richmond $582,200 248.5 1.7% 8.9% 19.2% 26.5% 59.6% 62.8% 78.8%
Squamish $445,800 214.7 7.8% 12.9% 20.1% 31.0% 108.2% 71.6% 65.5%
Tsawwassen $435,900 183.8 1.9% 3.0% 7.5% 1.5% 35.0% 26.5% 34.7%
Vancouver East $524,700 289.5 3.4% 9.2% 19.6% 20.5% 66.8% 68.7% 91.7%
Vancouver West $783,700 254.3 1.4% 8.0% 17.6% 11.7% 60.2% 64.2% 79.6%
West Vancouver $1,137,400 230.4 -2.6% 5.6% 15.7% 14.7% 50.6% 58.8% 58.1%
Whistler $491,100 161.0 10.5% 14.3% 22.1% 39.0% 134.7% 102.0% 24.7%
HOW TO READ THE TABLE:
• Benchmark Price: Estimated sale price of a benchmark property. Benchmarks represent a typical property within each market.
• Price Index: Index numbers estimate the percentage change in price on typical and constant quality properties over time. All figures are based on past sales.
• x Month/Year Change %: Percentage change of index over a period of x month(s)/year(s)
In January 2005, the indexes are set to 100. *
Townhome properties are similar to attached properties, a category that was used in the previous MLSLink HPI, but do not included duplexes.
Lower Mainland includes areas serviced by both Real Estate Board of Greater Vancouver & Fraser Valley Real Estate Board.
The above info is deemed reliable, but is not guaranteed. All dollar amounts in CDN.
* MLS®, Multiple Listing Service®, and all related graphics are trademarks of The Canadian Real Estate Association 2 of 15
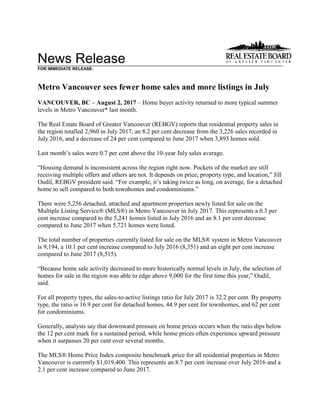
C:DATAMonthEndHpiexporthi_resgv-hpi2.tifGreaterVancouver
5YearTrend
60
110
160
210
260
310
Jul 2012
Sep 2012
Nov 2012
Jan 2013
Mar 2013
May 2013
Jul 2013
Sep 2013
Nov 2013
Jan 2014
Mar 2014
May 2014
Jul 2014
Sep 2014
Nov 2014
Jan 2015
Mar 2015
May 2015
Jul 2015
Sep 2015
Nov 2015
Jan 2016
Mar 2016
May 2016
Jul 2016
Sep 2016
Nov 2016
Jan 2017
Mar 2017
May 2017
Jul 2017
Price
Index
ResidentialDetachedTownhouseApartment
Jan2005HPI=100
7242017MLS®
SALESFacts
Burnaby
Coquitlam
Delta-South
Islands-Gulf
MapleRidge/PittMeadows
NewWestminster
NorthVancouver
PortCoquitlam
PortMoody/Belcarra
Richmond
Squamish
SunshineCoast
VancouverEast
VancouverWest
WestVancouver/HoweSound
Whistler/Pemberton
Detached57925613136208144181022365111744116949
Attached564015058164028211032874550531543
Apartment18213716048113794636199161215039810261,468
Detached$1,695,000$1,275,000$1,172,875n/a$781,000$1,136,500$1,800,000$942,500n/a$1,675,000$949,000$639,250$1,575,000$3,847,500$2,775,000n/a
Attached$735,000$828,000n/an/a$500,000n/a$1,070,000$655,000$651,000$843,000$599,450n/a$1,050,000$1,338,944n/a$720,000n/a
Apartment$532,500$490,000n/an/a$305,000$445,000$690,500$399,400$581,944$536,000n/an/a$532,000$777,000n/a$363,500
Detached103127588172321226621146268815711264181,320
Attached9150120723647401910130145469825668
Apartment25514329081128128685025510823846020321,905
Detached$1,650,000$1,350,000$1,135,000n/a$830,000$1,204,875$1,683,500$973,500$1,218,000$1,632,500$985,000$635,000$1,600,000$3,500,000$2,867,500n/a
Attached$749,950$775,000n/an/a$505,000$744,500$1,030,900$663,000n/a$825,000$590,000n/a$1,023,000$1,368,888n/a$632,000n/a
Apartment$509,000$480,000$532,500n/a$329,900$465,000$576,250$369,000$539,350$519,444n/an/a$520,050$782,500$1,220,000$514,000
Detached7710553612636994227123237611710844151,077
Attached785314064112629149817114159626547
Apartment23413412057106113663121110913143517361,602
Detached$1,650,000$1,250,000$1,270,000n/a$750,000$1,045,250$1,668,000$884,000$1,500,000$1,700,000$868,800$497,000$1,620,000$3,519,000$3,080,000n/a
Attached$670,000$685,019n/an/a$437,250n/a$917,500$600,000n/a$788,000n/an/a$1,005,000$1,185,000n/a$710,000n/a
Apartment$452,000$411,250n/an/a$260,000$366,800$473,500$316,644$435,000$403,800n/an/a$442,500$675,000n/a$299,500
Detached567676357428901616723131338701824378977063481167,367
Attached451319104143113625320212769016574286389481923,868
Apartment1,41785513004827917273462661,514115681,1382,85613622011,061
Detached$1,614,000$1,265,900$1,108,888$458,750$785,000$1,145,000$1,736,000$932,500$1,321,000$1,650,000$920,000$590,000$1,570,000$3,388,000$3,150,000$1,787,500
Attached$760,000$739,500$688,950n/a$470,000$702,000$994,000$600,000$635,000$820,000$594,900$375,450$998,950$1,350,000$2,012,500$734,000n/a
Apartment$520,450$470,000$519,400n/a$319,000$445,000$585,000$359,950$517,050$488,000$392,500$339,950$524,950$745,000$1,052,000$365,250
Detached9141,108496461,4293099574542421,3352086981,1491,26070213611,443
Attached56740385052110733724716274213974311527572134,492
Apartment1,8151,03713504187808934732731,808133761,1273,67815630313,105
Detached$1,628,000$1,250,000$1,213,750$397,500$719,450$1,100,000$1,660,000$868,000$1,300,000$1,698,000$833,875$490,000$1,551,000$3,538,000$3,250,000$1,360,750
Attached$670,000$685,000$685,000n/a$399,900$550,000$890,000$545,000$595,050$730,350$530,000$289,500$895,000$1,240,000$1,652,500$720,500n/a
Apartment$435,000$371,450$460,500n/a$232,250$348,000$465,000$283,000$440,000$413,000$337,000$271,333$439,950$645,000$845,000$300,000
Note:MedianSellingPricesarenotreportedforareaswithlessthan20salesorfortheGulfIslands
Number
of
Sales
July
2017
Number
of
Sales
Median
Selling
Price
Number
of
Sales
Median
Selling
Price
Number
of
Sales
Median
Selling
Price
June
2017
July
2016
Jan.-
Jul.2017
Jan.-
Jul.2016
Median
Selling
Price
Number
of
Sales
Median
Selling
Price
July
2017
Year-to-date
Year-to-date
7242017MLS®
LISTINGSFacts
Burnaby
Coquitlam
Delta-South
Islands-Gulf
MapleRidge/PittMeadows
NewWestminster
NorthVancouver
PortCoquitlam
PortMoody/Belcarra
Richmond
Squamish
SunshineCoast
VancouverEast
VancouverWest
WestVancouver/HoweSound
Whistler/Pemberton
Detached207214891323939163814729144107263239150282,214
Attached12577130742058322619930871109931882
Apartment279162270541681365143310112320663616382,160
Detached28%43%63%100%57%51%50%54%38%35%52%61%42%31%27%57%
Attached45%52%115%n/a78%80%69%88%81%52%93%88%63%46%56%100%n/a
Apartment65%85%59%n/a89%67%58%90%84%64%145%52%73%63%63%68%
Detached2642341052024955207754835847120342341174282,667
Attached986411160367942211813512781231330884
Apartment25017521065151137714631522820962435412,170
Detached39%54%55%40%69%58%59%88%44%41%55%73%46%33%37%64%
Attached93%78%109%0%120%100%59%95%90%56%86%117%69%56%62%83%n/a
Apartment102%82%138%n/a125%85%93%96%109%81%45%100%114%74%57%78%
Detached234222771523138178815233039123317272165272,401
Attached11455140681543352218632146786933793
Apartment297160150521341396951238211015465426272,047
Detached33%47%69%40%55%95%56%52%52%37%59%62%37%40%27%56%
Attached68%96%100%n/a94%73%60%83%64%53%53%79%61%69%67%79%n/a
Apartment79%84%80%n/a110%79%81%96%61%89%48%90%85%67%65%133%
Detached1,4131,253663811,3802721,2294622622,0043166781,8731,7701,11917114,946
Attached70142410954761753642481521,04021285474667912125,435
Apartment1,8131,03715805319649554213191,884134781,4073,95619925914,115
Detached40%54%54%52%64%59%55%68%51%43%58%64%48%40%31%68%
Attached64%75%95%20%91%78%70%81%84%66%78%87%60%58%53%91%n/a
Apartment78%82%82%n/a91%82%76%82%83%80%86%87%81%72%68%85%
Detached1,6811,718811951,8374321,3916613552,5173298242,0742,2861,38017718,568
Attached78250214205761244003091911,02118688416683812465,747
Apartment2,0571,22518204599521,1145193382,114180761,3264,68022430315,749
Detached54%64%61%48%78%72%69%69%68%53%63%85%55%55%51%77%
Attached73%80%60%n/a90%86%84%80%85%73%75%84%75%77%70%87%n/a
Apartment88%85%74%n/a91%82%80%91%81%86%74%100%85%79%70%100%
*Year-to-datelistingsrepresentacumulativetotaloflistingsratherthantotalactivelistings.
%Salesto
Listings
Number
of
Listings
%Salesto
Listings
June
2017
July
2016
Jan.-
Jul.2017
Jan.-
Jul.2016
%Salesto
Listings
Number
of
Listings
%Salesto
Listings
Number
of
Listings
July
2017
Number
of
Listings
%Salesto
Listings
Number
of
Listings
July
2017
Year-to-date*
Year-to-date*
Listing & Sales Activity Summary
Listings Sales
1 2 3 Col. 2 & 3 5 6 7 Col. 6 & 7 9 10 Col. 9 & 10
Jul Jun Jul Percentage Jul Jun Jul Percentage May 2016 - May 2017 - Percentage
2016 2017 2017 Variance 2016 2017 2017 Variance Jul 2016 Jul 2017 Variance
BURNABY % % %
DETACHED 234 264 207 -21.6 77 103 57 -44.7 328 276 -15.9
ATTACHED 114 98 125 27.6 78 91 56 -38.5 270 252 -6.7
APARTMENTS 297 250 279 11.6 234 255 182 -28.6 800 714 -10.8
COQUITLAM
DETACHED 222 234 214 -8.5 105 127 92 -27.6 457 363 -20.6
ATTACHED 55 64 77 20.3 53 50 40 -20.0 175 166 -5.1
APARTMENTS 160 175 162 -7.4 134 143 137 -4.2 479 419 -12.5
DELTA
DETACHED 77 105 89 -15.2 53 58 56 -3.4 204 184 -9.8
ATTACHED 14 11 13 18.2 14 12 15 25.0 53 42 -20.8
APARTMENTS 15 21 27 28.6 12 29 16 -44.8 51 64 25.5
MAPLE RIDGE/PITT MEADOWS
DETACHED 231 249 239 -4.0 126 172 136 -20.9 595 492 -17.3
ATTACHED 68 60 74 23.3 64 72 58 -19.4 233 215 -7.7
APARTMENTS 52 65 54 -16.9 57 81 48 -40.7 201 220 9.5
NORTH VANCOUVER
DETACHED 178 207 163 -21.3 99 122 81 -33.6 390 342 -12.3
ATTACHED 43 79 58 -26.6 26 47 40 -14.9 130 137 5.4
APARTMENTS 139 137 136 -0.7 113 128 79 -38.3 404 342 -15.3
NEW WESTMINSTER
DETACHED 38 55 39 -29.1 36 32 20 -37.5 125 89 -28.8
ATTACHED 15 36 20 -44.4 11 36 16 -55.6 50 76 52.0
APARTMENTS 134 151 168 11.3 106 128 113 -11.7 367 407 10.9
PORT MOODY/BELCARRA
DETACHED 52 48 47 -2.1 27 21 18 -14.3 87 69 -20.7
ATTACHED 22 21 26 23.8 14 19 21 10.5 78 73 -6.4
APARTMENTS 51 46 43 -6.5 31 50 36 -28.0 128 128 0.0
PORT COQUITLAM
DETACHED 81 75 81 8.0 42 66 44 -33.3 174 178 2.3
ATTACHED 35 42 32 -23.8 29 40 28 -30.0 102 111 8.8
APARTMENTS 69 71 51 -28.2 66 68 46 -32.4 197 174 -11.7
RICHMOND
DETACHED 330 358 291 -18.7 123 146 102 -30.1 503 415 -17.5
ATTACHED 186 181 199 9.9 98 101 103 2.0 324 344 6.2
APARTMENTS 238 315 310 -1.6 211 255 199 -22.0 869 709 -18.4
SUNSHINE COAST
DETACHED 123 120 107 -10.8 76 88 65 -26.1 314 235 -25.2
ATTACHED 14 12 8 -33.3 11 14 7 -50.0 37 39 5.4
APARTMENTS 10 8 23 187.5 9 8 12 50.0 38 29 -23.7
SQUAMISH
DETACHED 39 47 44 -6.4 23 26 23 -11.5 83 86 3.6
ATTACHED 32 35 30 -14.3 17 30 28 -6.7 72 87 20.8
APARTMENTS 21 22 11 -50.0 10 10 16 60.0 47 58 23.4
VANCOUVER EAST
DETACHED 317 342 263 -23.1 117 157 111 -29.3 496 467 -5.8
ATTACHED 67 78 71 -9.0 41 54 45 -16.7 146 153 4.8
APARTMENTS 154 209 206 -1.4 131 238 150 -37.0 497 600 20.7
VANCOUVER WEST
DETACHED 272 341 239 -29.9 108 112 74 -33.9 451 373 -17.3
ATTACHED 86 123 109 -11.4 59 69 50 -27.5 228 199 -12.7
APARTMENTS 654 624 636 1.9 435 460 398 -13.5 1586 1384 -12.7
WHISTLER/PEMBERTON
DETACHED 27 28 28 0.0 15 18 16 -11.1 47 57 21.3
ATTACHED 33 30 31 3.3 26 25 31 24.0 105 87 -17.1
APARTMENTS 27 41 38 -7.3 36 32 26 -18.8 121 92 -24.0
WEST VANCOUVER/HOWE SOUND
DETACHED 165 174 150 -13.8 44 64 41 -35.9 220 168 -23.6
ATTACHED 9 13 9 -30.8 6 8 5 -37.5 28 21 -25.0
APARTMENTS 26 35 16 -54.3 17 20 10 -50.0 75 58 -22.7
GRAND TOTALS
DETACHED 2386 2647 2201 -16.8 1071 1312 936 -28.7 4474 3794 -15.2
ATTACHED 793 883 882 -0.1 547 668 543 -18.7 2031 2002 -1.4
APARTMENTS 2047 2170 2160 -0.5 1602 1905 1468 -22.9 5860 5398 -7.9
ResidentialAverageSalePrices-January1977toJuly2017
0
200
400
600
800
1000
1200
1400
1600
1800
2000
1977
1978
1979
1980
1981
1982
1983
1984
1985
1986
1987
1988
1989
1990
1991
1992
1993
1994
1995
1996
1997
1998
1999
2000
2001
2002
2003
2004
2005
2006
2007
2008
2009
2010
2011
2012
2013
2014
2015
2016
2017
DETACHEDCONDOMINIUMATTACHEDAPARTMENTS
INTHOUSANDS($)
NOTE:From1977-1984condominiumaverageswerenotseparatedintoattached&apartment.
$851,187
$664,944
$1,701,470

More Related Content

What's hot

Rebgv stats-pkg-june-2018
Rebgv stats-pkg-june-2018Rebgv stats-pkg-june-2018
Rebgv stats-pkg-june-2018Kathryn Huang
 
October 2017 REBGV Stats Mike Stewart Vancouver Realtor
October 2017 REBGV Stats Mike Stewart Vancouver RealtorOctober 2017 REBGV Stats Mike Stewart Vancouver Realtor
October 2017 REBGV Stats Mike Stewart Vancouver RealtorMike Stewart
 
March 2017 Rebgv Stats Package Mike Stewart
March 2017 Rebgv Stats Package Mike StewartMarch 2017 Rebgv Stats Package Mike Stewart
March 2017 Rebgv Stats Package Mike StewartMike Stewart
 
December 2016 rebgv statistics package mike stewart vancouver realtor
December 2016 rebgv statistics package mike stewart vancouver realtorDecember 2016 rebgv statistics package mike stewart vancouver realtor
December 2016 rebgv statistics package mike stewart vancouver realtorMike Stewart
 
January 2017 Rebgv Statistics Package Mike Stewart Vancouver Realtor
January 2017 Rebgv Statistics Package Mike Stewart Vancouver RealtorJanuary 2017 Rebgv Statistics Package Mike Stewart Vancouver Realtor
January 2017 Rebgv Statistics Package Mike Stewart Vancouver RealtorMike Stewart
 
2017 Real Estate Board of Greater Vancouver Statistics Package with Charts & ...
2017 Real Estate Board of Greater Vancouver Statistics Package with Charts & ...2017 Real Estate Board of Greater Vancouver Statistics Package with Charts & ...
2017 Real Estate Board of Greater Vancouver Statistics Package with Charts & ...Kathryn Huang
 
October 2016 REBGV Statistics Package Vancouver BC Mike Stewart Realtor
October 2016 REBGV Statistics Package Vancouver BC Mike Stewart RealtorOctober 2016 REBGV Statistics Package Vancouver BC Mike Stewart Realtor
October 2016 REBGV Statistics Package Vancouver BC Mike Stewart RealtorMike Stewart
 
Rebgv stats-pkg-november-2019-f
Rebgv stats-pkg-november-2019-fRebgv stats-pkg-november-2019-f
Rebgv stats-pkg-november-2019-fVicky Aulakh
 
Real Estate Board of Greater Vancouver Statistics Package November 2020
Real Estate Board of Greater Vancouver Statistics Package November 2020Real Estate Board of Greater Vancouver Statistics Package November 2020
Real Estate Board of Greater Vancouver Statistics Package November 2020Vicky Aulakh
 
Real Estate Board of Greater Vancouver Statistics Package August 2021
Real Estate Board of Greater Vancouver Statistics Package August 2021Real Estate Board of Greater Vancouver Statistics Package August 2021
Real Estate Board of Greater Vancouver Statistics Package August 2021Vicky Aulakh
 
Rebgv stats-pkg-july-2019
Rebgv stats-pkg-july-2019Rebgv stats-pkg-july-2019
Rebgv stats-pkg-july-2019Vicky Aulakh
 
REBGV September 2016 Stats Package Mike Stewart Vancouver Realtor
REBGV September 2016 Stats Package Mike Stewart Vancouver RealtorREBGV September 2016 Stats Package Mike Stewart Vancouver Realtor
REBGV September 2016 Stats Package Mike Stewart Vancouver RealtorMike Stewart
 
Real Estate Board of Greater Vancouver Statistics Package July 2021
Real Estate Board of Greater Vancouver Statistics Package July 2021Real Estate Board of Greater Vancouver Statistics Package July 2021
Real Estate Board of Greater Vancouver Statistics Package July 2021Vicky Aulakh
 
2021 June - REBGV Statistics Package
2021 June - REBGV Statistics Package2021 June - REBGV Statistics Package
2021 June - REBGV Statistics PackageVicky Aulakh
 
REBGV Stats Package June 2016 Mike Stewart Vancouver Realtor
REBGV Stats Package June 2016 Mike Stewart Vancouver RealtorREBGV Stats Package June 2016 Mike Stewart Vancouver Realtor
REBGV Stats Package June 2016 Mike Stewart Vancouver RealtorMike Stewart
 
REBGV Statistics Package April 2021
REBGV Statistics Package April 2021REBGV Statistics Package April 2021
REBGV Statistics Package April 2021Vicky Aulakh
 
Rebgv stats-pkg-may-2021
Rebgv stats-pkg-may-2021Rebgv stats-pkg-may-2021
Rebgv stats-pkg-may-2021BC PRIME Realty
 
January 2016 rebgv stats mike stewart realtor Corrected Feb 5 2016
January 2016 rebgv stats mike stewart realtor Corrected Feb 5 2016January 2016 rebgv stats mike stewart realtor Corrected Feb 5 2016
January 2016 rebgv stats mike stewart realtor Corrected Feb 5 2016Mike Stewart
 

What's hot (18)

Rebgv stats-pkg-june-2018
Rebgv stats-pkg-june-2018Rebgv stats-pkg-june-2018
Rebgv stats-pkg-june-2018
 
October 2017 REBGV Stats Mike Stewart Vancouver Realtor
October 2017 REBGV Stats Mike Stewart Vancouver RealtorOctober 2017 REBGV Stats Mike Stewart Vancouver Realtor
October 2017 REBGV Stats Mike Stewart Vancouver Realtor
 
March 2017 Rebgv Stats Package Mike Stewart
March 2017 Rebgv Stats Package Mike StewartMarch 2017 Rebgv Stats Package Mike Stewart
March 2017 Rebgv Stats Package Mike Stewart
 
December 2016 rebgv statistics package mike stewart vancouver realtor
December 2016 rebgv statistics package mike stewart vancouver realtorDecember 2016 rebgv statistics package mike stewart vancouver realtor
December 2016 rebgv statistics package mike stewart vancouver realtor
 
January 2017 Rebgv Statistics Package Mike Stewart Vancouver Realtor
January 2017 Rebgv Statistics Package Mike Stewart Vancouver RealtorJanuary 2017 Rebgv Statistics Package Mike Stewart Vancouver Realtor
January 2017 Rebgv Statistics Package Mike Stewart Vancouver Realtor
 
2017 Real Estate Board of Greater Vancouver Statistics Package with Charts & ...
2017 Real Estate Board of Greater Vancouver Statistics Package with Charts & ...2017 Real Estate Board of Greater Vancouver Statistics Package with Charts & ...
2017 Real Estate Board of Greater Vancouver Statistics Package with Charts & ...
 
October 2016 REBGV Statistics Package Vancouver BC Mike Stewart Realtor
October 2016 REBGV Statistics Package Vancouver BC Mike Stewart RealtorOctober 2016 REBGV Statistics Package Vancouver BC Mike Stewart Realtor
October 2016 REBGV Statistics Package Vancouver BC Mike Stewart Realtor
 
Rebgv stats-pkg-november-2019-f
Rebgv stats-pkg-november-2019-fRebgv stats-pkg-november-2019-f
Rebgv stats-pkg-november-2019-f
 
Real Estate Board of Greater Vancouver Statistics Package November 2020
Real Estate Board of Greater Vancouver Statistics Package November 2020Real Estate Board of Greater Vancouver Statistics Package November 2020
Real Estate Board of Greater Vancouver Statistics Package November 2020
 
Real Estate Board of Greater Vancouver Statistics Package August 2021
Real Estate Board of Greater Vancouver Statistics Package August 2021Real Estate Board of Greater Vancouver Statistics Package August 2021
Real Estate Board of Greater Vancouver Statistics Package August 2021
 
Rebgv stats-pkg-july-2019
Rebgv stats-pkg-july-2019Rebgv stats-pkg-july-2019
Rebgv stats-pkg-july-2019
 
REBGV September 2016 Stats Package Mike Stewart Vancouver Realtor
REBGV September 2016 Stats Package Mike Stewart Vancouver RealtorREBGV September 2016 Stats Package Mike Stewart Vancouver Realtor
REBGV September 2016 Stats Package Mike Stewart Vancouver Realtor
 
Real Estate Board of Greater Vancouver Statistics Package July 2021
Real Estate Board of Greater Vancouver Statistics Package July 2021Real Estate Board of Greater Vancouver Statistics Package July 2021
Real Estate Board of Greater Vancouver Statistics Package July 2021
 
2021 June - REBGV Statistics Package
2021 June - REBGV Statistics Package2021 June - REBGV Statistics Package
2021 June - REBGV Statistics Package
 
REBGV Stats Package June 2016 Mike Stewart Vancouver Realtor
REBGV Stats Package June 2016 Mike Stewart Vancouver RealtorREBGV Stats Package June 2016 Mike Stewart Vancouver Realtor
REBGV Stats Package June 2016 Mike Stewart Vancouver Realtor
 
REBGV Statistics Package April 2021
REBGV Statistics Package April 2021REBGV Statistics Package April 2021
REBGV Statistics Package April 2021
 
Rebgv stats-pkg-may-2021
Rebgv stats-pkg-may-2021Rebgv stats-pkg-may-2021
Rebgv stats-pkg-may-2021
 
January 2016 rebgv stats mike stewart realtor Corrected Feb 5 2016
January 2016 rebgv stats mike stewart realtor Corrected Feb 5 2016January 2016 rebgv stats mike stewart realtor Corrected Feb 5 2016
January 2016 rebgv stats mike stewart realtor Corrected Feb 5 2016
 

Similar to REBGV STATS PACKAGE JULY 2017

Rebgv stats-pkg-august-2018
Rebgv stats-pkg-august-2018Rebgv stats-pkg-august-2018
Rebgv stats-pkg-august-2018Kathryn Huang
 
Rebgv stats-pkg-may-2018
Rebgv stats-pkg-may-2018Rebgv stats-pkg-may-2018
Rebgv stats-pkg-may-2018Kathryn Huang
 
Rebgv stats-pkg-august-2019
Rebgv stats-pkg-august-2019Rebgv stats-pkg-august-2019
Rebgv stats-pkg-august-2019Vicky Aulakh
 
Rebgv stats-pkg-september-2019
Rebgv stats-pkg-september-2019Rebgv stats-pkg-september-2019
Rebgv stats-pkg-september-2019Vicky Aulakh
 
Rebgv stats-pkg-april-2018
Rebgv stats-pkg-april-2018Rebgv stats-pkg-april-2018
Rebgv stats-pkg-april-2018Kathryn Huang
 
Rebgv stats-pkg-september-2018
Rebgv stats-pkg-september-2018Rebgv stats-pkg-september-2018
Rebgv stats-pkg-september-2018Kathryn Huang
 
May-2019 Stats Package for Greater Vancouver
May-2019 Stats Package for Greater VancouverMay-2019 Stats Package for Greater Vancouver
May-2019 Stats Package for Greater VancouverBC PRIME Realty
 
Rebgv stats-pkg-may-2019
Rebgv stats-pkg-may-2019Rebgv stats-pkg-may-2019
Rebgv stats-pkg-may-2019Kathryn Huang
 
Rebgv stats-pkg-june-2019
Rebgv stats-pkg-june-2019Rebgv stats-pkg-june-2019
Rebgv stats-pkg-june-2019Vicky Aulakh
 
REBGV Statistics Package August 2020
REBGV Statistics Package August 2020REBGV Statistics Package August 2020
REBGV Statistics Package August 2020Vicky Aulakh
 
Rebgv stats-pkg-october-2019
Rebgv stats-pkg-october-2019Rebgv stats-pkg-october-2019
Rebgv stats-pkg-october-2019Vicky Aulakh
 
September 2017 rebgv statistics package mike stewart realtor
September 2017 rebgv statistics package mike stewart realtorSeptember 2017 rebgv statistics package mike stewart realtor
September 2017 rebgv statistics package mike stewart realtorMike Stewart
 
Rebgv stats-pkg-october-2018 .pdf
Rebgv stats-pkg-october-2018 .pdf Rebgv stats-pkg-october-2018 .pdf
Rebgv stats-pkg-october-2018 .pdf Kathryn Huang
 
Rebgv Stats Package September 2020
Rebgv Stats Package September 2020Rebgv Stats Package September 2020
Rebgv Stats Package September 2020Vicky Aulakh
 
REBGV Statistics package July 2020
REBGV Statistics package July 2020REBGV Statistics package July 2020
REBGV Statistics package July 2020Vicky Aulakh
 
Real Estate Board of Greater Vancouver Statistics Package October 2021
Real Estate Board of Greater Vancouver Statistics Package October 2021Real Estate Board of Greater Vancouver Statistics Package October 2021
Real Estate Board of Greater Vancouver Statistics Package October 2021VickyAulakh1
 
REBGV Statistics Package October 2020
REBGV Statistics Package October 2020REBGV Statistics Package October 2020
REBGV Statistics Package October 2020Vicky Aulakh
 
Rebgv stats-pkg-february-2020
Rebgv stats-pkg-february-2020Rebgv stats-pkg-february-2020
Rebgv stats-pkg-february-2020Vicky Aulakh
 
REBGV STATS PACKAGE JUNE 2017
REBGV STATS PACKAGE JUNE 2017REBGV STATS PACKAGE JUNE 2017
REBGV STATS PACKAGE JUNE 2017vanrealtor1
 

Similar to REBGV STATS PACKAGE JULY 2017 (20)

Rebgv stats-pkg-august-2018
Rebgv stats-pkg-august-2018Rebgv stats-pkg-august-2018
Rebgv stats-pkg-august-2018
 
Rebgv stats-pkg-may-2018
Rebgv stats-pkg-may-2018Rebgv stats-pkg-may-2018
Rebgv stats-pkg-may-2018
 
Rebgv stats-pkg-august-2019
Rebgv stats-pkg-august-2019Rebgv stats-pkg-august-2019
Rebgv stats-pkg-august-2019
 
Rebgv stats-pkg-september-2019
Rebgv stats-pkg-september-2019Rebgv stats-pkg-september-2019
Rebgv stats-pkg-september-2019
 
Rebgv stats-pkg-april-2018
Rebgv stats-pkg-april-2018Rebgv stats-pkg-april-2018
Rebgv stats-pkg-april-2018
 
Rebgv stats-pkg-september-2018
Rebgv stats-pkg-september-2018Rebgv stats-pkg-september-2018
Rebgv stats-pkg-september-2018
 
May-2019 Stats Package for Greater Vancouver
May-2019 Stats Package for Greater VancouverMay-2019 Stats Package for Greater Vancouver
May-2019 Stats Package for Greater Vancouver
 
Rebgv stats-pkg-may-2019
Rebgv stats-pkg-may-2019Rebgv stats-pkg-may-2019
Rebgv stats-pkg-may-2019
 
Rebgv stats-pkg-june-2019
Rebgv stats-pkg-june-2019Rebgv stats-pkg-june-2019
Rebgv stats-pkg-june-2019
 
REBGV Statistics Package August 2020
REBGV Statistics Package August 2020REBGV Statistics Package August 2020
REBGV Statistics Package August 2020
 
Rebgv stats-pkg-october-2019
Rebgv stats-pkg-october-2019Rebgv stats-pkg-october-2019
Rebgv stats-pkg-october-2019
 
September 2017 rebgv statistics package mike stewart realtor
September 2017 rebgv statistics package mike stewart realtorSeptember 2017 rebgv statistics package mike stewart realtor
September 2017 rebgv statistics package mike stewart realtor
 
Rebgv stats-pkg-october-2018 .pdf
Rebgv stats-pkg-october-2018 .pdf Rebgv stats-pkg-october-2018 .pdf
Rebgv stats-pkg-october-2018 .pdf
 
Rebgv Stats Package September 2020
Rebgv Stats Package September 2020Rebgv Stats Package September 2020
Rebgv Stats Package September 2020
 
REBGV Statistics package July 2020
REBGV Statistics package July 2020REBGV Statistics package July 2020
REBGV Statistics package July 2020
 
Real Estate Board of Greater Vancouver Statistics Package October 2021
Real Estate Board of Greater Vancouver Statistics Package October 2021Real Estate Board of Greater Vancouver Statistics Package October 2021
Real Estate Board of Greater Vancouver Statistics Package October 2021
 
REBGV Statistics Package October 2020
REBGV Statistics Package October 2020REBGV Statistics Package October 2020
REBGV Statistics Package October 2020
 
Rebgv stats-pkg-october-2020
Rebgv stats-pkg-october-2020Rebgv stats-pkg-october-2020
Rebgv stats-pkg-october-2020
 
Rebgv stats-pkg-february-2020
Rebgv stats-pkg-february-2020Rebgv stats-pkg-february-2020
Rebgv stats-pkg-february-2020
 
REBGV STATS PACKAGE JUNE 2017
REBGV STATS PACKAGE JUNE 2017REBGV STATS PACKAGE JUNE 2017
REBGV STATS PACKAGE JUNE 2017
 

Recently uploaded

Call Girls In Vasant Vihar Delhi 💯Call Us 🔝8264348440🔝
Call Girls In Vasant Vihar Delhi 💯Call Us 🔝8264348440🔝Call Girls In Vasant Vihar Delhi 💯Call Us 🔝8264348440🔝
Call Girls In Vasant Vihar Delhi 💯Call Us 🔝8264348440🔝soniya singh
 
Call Girls in shastri nagar Delhi 8264348440 ✅ call girls ❤️
Call Girls in shastri nagar Delhi 8264348440 ✅ call girls ❤️Call Girls in shastri nagar Delhi 8264348440 ✅ call girls ❤️
Call Girls in shastri nagar Delhi 8264348440 ✅ call girls ❤️soniya singh
 
9990771857 Call Girls in Noida Sector 1 Noida (Call Girls) Delhi
9990771857 Call Girls in Noida Sector 1 Noida (Call Girls) Delhi9990771857 Call Girls in Noida Sector 1 Noida (Call Girls) Delhi
9990771857 Call Girls in Noida Sector 1 Noida (Call Girls) Delhidelhimodel235
 
Omaxe Dwarka In Delhi E Brochure Pdf
Omaxe Dwarka In Delhi E Brochure     PdfOmaxe Dwarka In Delhi E Brochure     Pdf
Omaxe Dwarka In Delhi E Brochure Pdfashiyadav24
 
Eco-Efficient Living: Redefining Sustainability through Leech's Green Design ...
Eco-Efficient Living: Redefining Sustainability through Leech's Green Design ...Eco-Efficient Living: Redefining Sustainability through Leech's Green Design ...
Eco-Efficient Living: Redefining Sustainability through Leech's Green Design ...Newman George Leech
 
Purva Palm Hills Devanahalli, Bangalore E- Brochure.pdf
Purva Palm Hills Devanahalli, Bangalore E- Brochure.pdfPurva Palm Hills Devanahalli, Bangalore E- Brochure.pdf
Purva Palm Hills Devanahalli, Bangalore E- Brochure.pdffaheemali990101
 
Low Rate Call Girls in Tughlakabad Delhi Call 9990771857
Low Rate Call Girls in Tughlakabad Delhi Call 9990771857Low Rate Call Girls in Tughlakabad Delhi Call 9990771857
Low Rate Call Girls in Tughlakabad Delhi Call 9990771857delhimodel235
 
9990771857 Call Girls in Noida Sector 34 Noida (Call Girls) Delhi
9990771857 Call Girls in Noida Sector 34 Noida (Call Girls) Delhi9990771857 Call Girls in Noida Sector 34 Noida (Call Girls) Delhi
9990771857 Call Girls in Noida Sector 34 Noida (Call Girls) Delhidelhimodel235
 
Call Girls in laxmi Nagar Delhi 💯Call Us 🔝 9582086666🔝 South Delhi Escorts Se...
Call Girls in laxmi Nagar Delhi 💯Call Us 🔝 9582086666🔝 South Delhi Escorts Se...Call Girls in laxmi Nagar Delhi 💯Call Us 🔝 9582086666🔝 South Delhi Escorts Se...
Call Girls in laxmi Nagar Delhi 💯Call Us 🔝 9582086666🔝 South Delhi Escorts Se...delhimodel235
 
call girls in Shahdara (DELHI) 🔝 >༒9953330565🔝 genuine Escort Service 🔝✔️✔️
call girls in Shahdara (DELHI) 🔝 >༒9953330565🔝 genuine Escort Service 🔝✔️✔️call girls in Shahdara (DELHI) 🔝 >༒9953330565🔝 genuine Escort Service 🔝✔️✔️
call girls in Shahdara (DELHI) 🔝 >༒9953330565🔝 genuine Escort Service 🔝✔️✔️9953056974 Low Rate Call Girls In Saket, Delhi NCR
 
83770-87607 ŰžCall Girls In Near The Park Hotel (Cp) Delhi
83770-87607 ŰžCall Girls In Near The Park Hotel (Cp) Delhi83770-87607 ŰžCall Girls In Near The Park Hotel (Cp) Delhi
83770-87607 ŰžCall Girls In Near The Park Hotel (Cp) Delhidollysharma2066
 
9711199012 Call {Girls Delhi} Very Low rate Vaishali DownLoad PDF
9711199012 Call {Girls Delhi} Very Low rate Vaishali DownLoad PDF9711199012 Call {Girls Delhi} Very Low rate Vaishali DownLoad PDF
9711199012 Call {Girls Delhi} Very Low rate Vaishali DownLoad PDFMs Riya
 
9990771857 Call Girls in Noida Sector 10 Noida (Call Girls) Delhi
9990771857 Call Girls in Noida Sector 10 Noida (Call Girls) Delhi9990771857 Call Girls in Noida Sector 10 Noida (Call Girls) Delhi
9990771857 Call Girls in Noida Sector 10 Noida (Call Girls) Delhidelhimodel235
 
Call Girls in Noida Sector 12 Noida 💯Call Us 🔝 9582086666 🔝 South Delhi Escor...
Call Girls in Noida Sector 12 Noida 💯Call Us 🔝 9582086666 🔝 South Delhi Escor...Call Girls in Noida Sector 12 Noida 💯Call Us 🔝 9582086666 🔝 South Delhi Escor...
Call Girls in Noida Sector 12 Noida 💯Call Us 🔝 9582086666 🔝 South Delhi Escor...delhimodel235
 
Raquel Thompson: Combining Creativity with Practicality in Architecture
Raquel Thompson: Combining  Creativity with Practicality in ArchitectureRaquel Thompson: Combining  Creativity with Practicality in Architecture
Raquel Thompson: Combining Creativity with Practicality in ArchitectureRaquel Thompson Barbados
 
Model Call Girl in Shastri Nagar Delhi reach out to us at 🔝8264348440🔝
Model Call Girl in Shastri Nagar Delhi reach out to us at 🔝8264348440🔝Model Call Girl in Shastri Nagar Delhi reach out to us at 🔝8264348440🔝
Model Call Girl in Shastri Nagar Delhi reach out to us at 🔝8264348440🔝soniya singh
 
The Omaxe State Dwarka Delhi-broucher.pdf.pdf
The Omaxe State Dwarka Delhi-broucher.pdf.pdfThe Omaxe State Dwarka Delhi-broucher.pdf.pdf
The Omaxe State Dwarka Delhi-broucher.pdf.pdfkratirudram
 
Telibagh & Call Girls Lucknow - 450+ Call Girl Cash Payment 🎂 8923113531 🎪 Ne...
Telibagh & Call Girls Lucknow - 450+ Call Girl Cash Payment 🎂 8923113531 🎪 Ne...Telibagh & Call Girls Lucknow - 450+ Call Girl Cash Payment 🎂 8923113531 🎪 Ne...
Telibagh & Call Girls Lucknow - 450+ Call Girl Cash Payment 🎂 8923113531 🎪 Ne...gurkirankumar98700
 
Aparna Greenscapes Kompally Hyderabad E - Brochure.pdf
Aparna Greenscapes Kompally Hyderabad E - Brochure.pdfAparna Greenscapes Kompally Hyderabad E - Brochure.pdf
Aparna Greenscapes Kompally Hyderabad E - Brochure.pdffaheemali990101
 

Recently uploaded (20)

Call Girls In Vasant Vihar Delhi 💯Call Us 🔝8264348440🔝
Call Girls In Vasant Vihar Delhi 💯Call Us 🔝8264348440🔝Call Girls In Vasant Vihar Delhi 💯Call Us 🔝8264348440🔝
Call Girls In Vasant Vihar Delhi 💯Call Us 🔝8264348440🔝
 
Call Girls in shastri nagar Delhi 8264348440 ✅ call girls ❤️
Call Girls in shastri nagar Delhi 8264348440 ✅ call girls ❤️Call Girls in shastri nagar Delhi 8264348440 ✅ call girls ❤️
Call Girls in shastri nagar Delhi 8264348440 ✅ call girls ❤️
 
9990771857 Call Girls in Noida Sector 1 Noida (Call Girls) Delhi
9990771857 Call Girls in Noida Sector 1 Noida (Call Girls) Delhi9990771857 Call Girls in Noida Sector 1 Noida (Call Girls) Delhi
9990771857 Call Girls in Noida Sector 1 Noida (Call Girls) Delhi
 
Omaxe Dwarka In Delhi E Brochure Pdf
Omaxe Dwarka In Delhi E Brochure     PdfOmaxe Dwarka In Delhi E Brochure     Pdf
Omaxe Dwarka In Delhi E Brochure Pdf
 
Low Rate Call Girls in Triveni Complex Delhi Call 9873940964
Low Rate Call Girls in Triveni Complex Delhi Call 9873940964Low Rate Call Girls in Triveni Complex Delhi Call 9873940964
Low Rate Call Girls in Triveni Complex Delhi Call 9873940964
 
Eco-Efficient Living: Redefining Sustainability through Leech's Green Design ...
Eco-Efficient Living: Redefining Sustainability through Leech's Green Design ...Eco-Efficient Living: Redefining Sustainability through Leech's Green Design ...
Eco-Efficient Living: Redefining Sustainability through Leech's Green Design ...
 
Purva Palm Hills Devanahalli, Bangalore E- Brochure.pdf
Purva Palm Hills Devanahalli, Bangalore E- Brochure.pdfPurva Palm Hills Devanahalli, Bangalore E- Brochure.pdf
Purva Palm Hills Devanahalli, Bangalore E- Brochure.pdf
 
Low Rate Call Girls in Tughlakabad Delhi Call 9990771857
Low Rate Call Girls in Tughlakabad Delhi Call 9990771857Low Rate Call Girls in Tughlakabad Delhi Call 9990771857
Low Rate Call Girls in Tughlakabad Delhi Call 9990771857
 
9990771857 Call Girls in Noida Sector 34 Noida (Call Girls) Delhi
9990771857 Call Girls in Noida Sector 34 Noida (Call Girls) Delhi9990771857 Call Girls in Noida Sector 34 Noida (Call Girls) Delhi
9990771857 Call Girls in Noida Sector 34 Noida (Call Girls) Delhi
 
Call Girls in laxmi Nagar Delhi 💯Call Us 🔝 9582086666🔝 South Delhi Escorts Se...
Call Girls in laxmi Nagar Delhi 💯Call Us 🔝 9582086666🔝 South Delhi Escorts Se...Call Girls in laxmi Nagar Delhi 💯Call Us 🔝 9582086666🔝 South Delhi Escorts Se...
Call Girls in laxmi Nagar Delhi 💯Call Us 🔝 9582086666🔝 South Delhi Escorts Se...
 
call girls in Shahdara (DELHI) 🔝 >༒9953330565🔝 genuine Escort Service 🔝✔️✔️
call girls in Shahdara (DELHI) 🔝 >༒9953330565🔝 genuine Escort Service 🔝✔️✔️call girls in Shahdara (DELHI) 🔝 >༒9953330565🔝 genuine Escort Service 🔝✔️✔️
call girls in Shahdara (DELHI) 🔝 >༒9953330565🔝 genuine Escort Service 🔝✔️✔️
 
83770-87607 ŰžCall Girls In Near The Park Hotel (Cp) Delhi
83770-87607 ŰžCall Girls In Near The Park Hotel (Cp) Delhi83770-87607 ŰžCall Girls In Near The Park Hotel (Cp) Delhi
83770-87607 ŰžCall Girls In Near The Park Hotel (Cp) Delhi
 
9711199012 Call {Girls Delhi} Very Low rate Vaishali DownLoad PDF
9711199012 Call {Girls Delhi} Very Low rate Vaishali DownLoad PDF9711199012 Call {Girls Delhi} Very Low rate Vaishali DownLoad PDF
9711199012 Call {Girls Delhi} Very Low rate Vaishali DownLoad PDF
 
9990771857 Call Girls in Noida Sector 10 Noida (Call Girls) Delhi
9990771857 Call Girls in Noida Sector 10 Noida (Call Girls) Delhi9990771857 Call Girls in Noida Sector 10 Noida (Call Girls) Delhi
9990771857 Call Girls in Noida Sector 10 Noida (Call Girls) Delhi
 
Call Girls in Noida Sector 12 Noida 💯Call Us 🔝 9582086666 🔝 South Delhi Escor...
Call Girls in Noida Sector 12 Noida 💯Call Us 🔝 9582086666 🔝 South Delhi Escor...Call Girls in Noida Sector 12 Noida 💯Call Us 🔝 9582086666 🔝 South Delhi Escor...
Call Girls in Noida Sector 12 Noida 💯Call Us 🔝 9582086666 🔝 South Delhi Escor...
 
Raquel Thompson: Combining Creativity with Practicality in Architecture
Raquel Thompson: Combining  Creativity with Practicality in ArchitectureRaquel Thompson: Combining  Creativity with Practicality in Architecture
Raquel Thompson: Combining Creativity with Practicality in Architecture
 
Model Call Girl in Shastri Nagar Delhi reach out to us at 🔝8264348440🔝
Model Call Girl in Shastri Nagar Delhi reach out to us at 🔝8264348440🔝Model Call Girl in Shastri Nagar Delhi reach out to us at 🔝8264348440🔝
Model Call Girl in Shastri Nagar Delhi reach out to us at 🔝8264348440🔝
 
The Omaxe State Dwarka Delhi-broucher.pdf.pdf
The Omaxe State Dwarka Delhi-broucher.pdf.pdfThe Omaxe State Dwarka Delhi-broucher.pdf.pdf
The Omaxe State Dwarka Delhi-broucher.pdf.pdf
 
Telibagh & Call Girls Lucknow - 450+ Call Girl Cash Payment 🎂 8923113531 🎪 Ne...
Telibagh & Call Girls Lucknow - 450+ Call Girl Cash Payment 🎂 8923113531 🎪 Ne...Telibagh & Call Girls Lucknow - 450+ Call Girl Cash Payment 🎂 8923113531 🎪 Ne...
Telibagh & Call Girls Lucknow - 450+ Call Girl Cash Payment 🎂 8923113531 🎪 Ne...
 
Aparna Greenscapes Kompally Hyderabad E - Brochure.pdf
Aparna Greenscapes Kompally Hyderabad E - Brochure.pdfAparna Greenscapes Kompally Hyderabad E - Brochure.pdf
Aparna Greenscapes Kompally Hyderabad E - Brochure.pdf
 

REBGV STATS PACKAGE JULY 2017