SlideShare a Scribd company logo
1 of 10
Download to read offline
News Release
FOR IMMEDIATE RELEASE:
Home sale and listing activity in Metro Vancouver moves off of its
record-breaking pace
VANCOUVER, BC – June 2, 2021 – The Metro Vancouver* housing market saw steady home
sale and listing activity in May, a shift back from the record-breaking activity seen in the earlier
spring months.
The Real Estate Board of Greater Vancouver (REBGV) reports that residential home sales in the
region totalled 4,268 in May 2021, a 187.4 per cent increase from the 1,485 sales recorded in
May 2020, and a 13 per cent decrease from the 4,908 homes sold in April 2021.
Last month’s sales were 27.7 per cent above the 10-year May sales average.
“While home sale and listing activity remained above our long-term averages in May, conditions
moved back from the record-setting pace experienced throughout Metro Vancouver in March
and April of this year,” Keith Stewart, REBGV economist said. “With a little less intensity in the
market today than we saw earlier in the spring, home sellers need to ensure they’re working with
their REALTOR® to price their homes based on current market conditions.”
There were 7,125 detached, attached and apartment properties newly listed for sale on the
Multiple Listing Service® (MLS®) in Metro Vancouver in May 2021. This represents a 93.4 per
cent increase compared to the 3,684 homes listed in May 2020 and a 10.2 per cent decrease
compared to April 2021 when 7,938 homes were listed.
The total number of homes currently listed for sale on the MLS® system in Metro Vancouver is
10,970, a 10.5 per cent increase compared to May 2020 (9,927) and a 7.1 per cent increase
compared to April 2021 (10,245).
"With sales easing down from record peaks, a revised mortgage stress test that reduces the
maximum borrowing amounts by approximately 4.5 per cent, and the average five-year fixed
mortgage rate climbing back over two per cent since the beginning of 2021, we’ll pay close
attention to these factors leading into the summer to understand what affect they’ll have on the
current market cycle,” Stewart said.
For all property types, the sales-to-active listings ratio for May 2021 is 38.9 per cent. By
property type, the ratio is 29.8 per cent for detached homes, 53.8 per cent for townhomes, and
43.5 per cent for apartments.
Generally, analysts say downward pressure on home prices occurs when the ratio dips below 12
per cent for a sustained period, while home prices often experience upward pressure when it
surpasses 20 per cent over several months.
“The seller’s market conditions experienced throughout much of the pandemic highlight the need
for increasing the volume and variety of housing supply across our region,” Stewart said. “Doing
this requires a more disciplined focus on planning, reducing building costs, understanding
demographic changes, and expediting the building approval process.”
The MLS® Home Price Index1
composite benchmark price for all residential properties in Metro
Vancouver is currently $1,172,800. This represents a 14 per cent increase over May 2020 and a
1.5 per cent increase compared to April 2021.
Sales of detached homes in May 2021 reached 1,430, a 166 per cent increase from the 537
detached sales recorded in May 2020. The benchmark price for a detached home is $1,800,600.
This represents a 22.8 per cent increase from May 2020 and a 1.7 per cent increase compared to
April 2021.
Sales of apartment homes reached 2,049 in May 2021, a 213 per cent increase compared to the
653 sales in May 2020. The benchmark price of an apartment home is $737,100. This represents
a 7.9 per cent increase from May 2020 and a 1.2 per cent increase compared to April 2021.
Attached home sales in May 2021 totalled 800, a 168 per cent increase compared to the 298 sales
in May 2020. The benchmark price of an attached home is $936,300. This represents a 16.3 per
cent increase from May 2020 and a 1.8 per cent increase compared to April 2021.
-30-
*Editor’s Note: Areas covered by the Real Estate Board of Greater Vancouver include: Burnaby, Coquitlam, Maple
Ridge, New Westminster, North Vancouver, Pitt Meadows, Port Coquitlam, Port Moody, Richmond, South Delta,
Squamish, Sunshine Coast, Vancouver, West Vancouver, and Whistler.
MLS® Home Price Index 2021 update
1.) The national MLS® Home Price Index (MLS® HPI) operations group underwent an annual review of the model
in May. In line with best statistical practices, the MLS® HPI is reviewed annually.
MLS® HPI coverage was extended to neighbourhoods where sales volumes picked up enough to support benchmark
price tracking and was discontinued for neighbourhoods where sales became too sparse to support benchmark price
calculations.
To ensure the MLS® HPI coverage is consistent and comparable, historical aggregate and composite data has been
recalculated based on revised and consistent coverage.
The real estate industry is a key economic driver in British Columbia. In 2020, 30,944 homes changed ownership in
the Board’s area, generating $2.1 billion in economic spin-off activity and an estimated 14,728 jobs. The total dollar
value of residential sales transacted through the MLS® system in Greater Vancouver totalled $33.7 billion in 2020.
The Real Estate Board of Greater Vancouver is an association representing more than 14,000 REALTORS® and
their companies. The Board provides a variety of member services, including the Multiple Listing Service®. For
more information on real estate, statistics, and buying or selling a home, contact a local REALTOR® or visit
www.rebgv.org.
For more information please contact:
Craig Munn
Director, Communication
Real Estate Board of Greater Vancouver
604.730.3146
cmunn@rebgv.org
Property Type Area
Benchmark
Price
Price
Index
1 Month
Change %
3 Month
Change %
6 Month
Change %
1 Year
Change %
3 Year
Change %
5 Year
Change %
10 Year
Change %
Residential / Composite Lower Mainland $1,140,900 317.8 1.8% 9.2% 14.7% 17.4% 11.1% 40.9% 104.8%
Greater Vancouver $1,172,800 308.7 1.5% 7.8% 12.3% 14.0% 7.1% 30.3% 92.0%
Bowen Island $1,393,900 302.2 2.5% 14.5% 21.2% 45.8% 32.7% 93.0% 132.5%
Burnaby East $1,071,500 305.5 1.5% 8.4% 7.8% 10.2% 3.2% 24.1% 90.3%
Burnaby North $1,096,600 295.4 1.4% 5.8% 9.0% 9.9% 2.9% 26.9% 90.0%
Burnaby South $1,045,200 296.7 1.4% 6.6% 8.1% 7.5% -0.4% 27.3% 81.2%
Coquitlam $1,088,000 323.4 1.6% 8.9% 13.9% 15.3% 10.1% 41.3% 117.2%
Ladner $1,027,300 291.1 1.5% 8.7% 17.7% 22.3% 13.5% 20.2% 85.9%
Maple Ridge $991,100 315.6 2.3% 13.7% 21.7% 25.8% 21.3% 71.2% 134.0%
New Westminster $715,900 317.6 2.1% 7.0% 8.3% 10.3% 1.8% 45.8% 102.4%
North Vancouver $1,223,900 281.2 1.5% 6.4% 11.0% 15.4% 7.9% 28.0% 91.6%
Pitt Meadows $907,800 331.7 2.3% 10.6% 17.0% 19.1% 14.3% 72.4% 132.3%
Port Coquitlam $923,700 316.2 1.1% 10.5% 17.1% 20.1% 13.3% 52.5% 118.2%
Port Moody $1,046,900 294.4 0.8% 8.4% 12.3% 13.0% 7.0% 41.9% 113.3%
Richmond $1,077,000 321.6 1.3% 6.8% 12.2% 14.7% 6.1% 26.0% 81.7%
Squamish $1,011,600 313.6 2.3% 12.0% 18.7% 27.3% 24.0% 64.8% 135.1%
Sunshine Coast $804,100 296.5 2.0% 12.6% 20.9% 39.0% 29.6% 80.8% 125.1%
Tsawwassen $1,123,600 284.6 0.8% 5.1% 13.4% 17.0% 9.9% 9.2% 90.6%
Vancouver East $1,209,800 359.5 1.2% 7.5% 9.8% 11.1% 5.3% 25.0% 102.4%
Vancouver West $1,370,600 286.2 0.8% 5.7% 9.4% 6.8% -1.2% 12.3% 69.0%
West Vancouver $2,539,400 279.6 2.4% 4.6% 12.2% 18.5% 0.8% 1.5% 73.1%
Whistler $1,278,600 285.9 2.2% 10.6% 19.6% 29.7% 31.2% 78.9% 119.8%
Single Family Detached Lower Mainland $1,603,700 341.7 2.0% 11.8% 20.1% 27.6% 19.7% 33.1% 114.9%
Greater Vancouver $1,800,600 331.8 1.7% 10.0% 16.3% 22.8% 12.3% 18.0% 93.6%
Bowen Island $1,393,900 302.2 2.5% 14.5% 21.2% 45.8% 32.7% 93.0% 132.5%
Burnaby East $1,469,500 328.6 2.4% 11.5% 14.4% 18.1% 11.8% 18.7% 105.6%
Burnaby North $1,712,100 331.1 0.2% 8.9% 12.4% 16.3% 8.7% 8.9% 93.6%
Burnaby South $1,765,100 337.9 2.1% 8.3% 12.2% 15.4% 5.6% 10.4% 85.4%
Coquitlam $1,499,100 332.7 1.4% 10.0% 17.8% 23.4% 13.6% 26.2% 120.2%
Ladner $1,292,700 309.4 1.7% 11.5% 22.4% 31.4% 24.3% 21.0% 101.8%
Maple Ridge $1,121,500 319.5 2.1% 15.3% 24.9% 32.1% 28.1% 67.4% 140.2%
New Westminster $1,310,400 326.9 1.8% 11.3% 15.0% 19.3% 11.3% 21.3% 95.5%
North Vancouver $1,902,600 299.6 1.2% 6.7% 13.8% 23.2% 12.1% 17.6% 103.5%
Pitt Meadows $1,189,900 335.3 2.0% 11.5% 20.1% 29.3% 25.2% 63.2% 139.2%
Port Coquitlam $1,253,000 334.1 0.4% 10.3% 20.6% 29.3% 19.4% 37.6% 128.1%
Port Moody $1,820,500 336.2 0.4% 9.9% 17.9% 25.3% 19.1% 34.9% 122.2%
Richmond $1,931,300 370.3 2.3% 10.7% 17.1% 20.5% 7.1% 7.9% 73.4%
Squamish $1,394,500 341.8 3.3% 17.5% 23.0% 33.3% 31.1% 71.2% 166.0%
Sunshine Coast $838,300 293.7 2.0% 13.7% 21.8% 43.0% 32.8% 88.3% 127.5%
Tsawwassen $1,359,500 296.8 1.1% 6.4% 16.8% 23.2% 16.2% 6.5% 101.4%
Vancouver East $1,709,700 376.6 1.7% 9.2% 11.5% 18.1% 11.0% 13.5% 112.8%
Vancouver West $3,383,100 342.2 0.6% 5.6% 8.4% 11.2% -2.2% -3.0% 59.3%
West Vancouver $3,139,800 296.4 3.9% 5.6% 14.5% 19.8% 4.0% -0.2% 78.4%
Whistler $2,512,100 317.1 4.0% 19.6% 25.5% 35.7% 41.9% 76.1% 153.1%
HOW TO READ THE TABLE:
• Benchmark Price: Estimated sale price of a benchmark property. Benchmarks represent a typical property within each market.
• Price Index: Index numbers estimate the percentage change in price on typical and constant quality properties over time. All figures are based on past sales.
• x Month/Year Change %: Percentage change of index over a period of x month(s)/year(s) *
In January 2005, the indexes are set to 100.
Townhome properties are similar to Attached properties, a category that was used in the previous MLSLink HPI, but do not included duplexes.
The above info is deemed reliable, but is not guaranteed. All dollar amounts in CDN.
May 2021
*
* MLS®, Multiple Listing Service®, and all related graphics are trademarks of The Canadian Real Estate Association 1 of 18
Property Type Area
Benchmark
Price
Price
Index
1 Month
Change %
3 Month
Change %
6 Month
Change %
1 Year
Change %
3 Year
Change %
5 Year
Change %
10 Year
Change %
May 2021
*
Townhouse Lower Mainland $825,200 297.4 2.2% 9.9% 15.1% 17.9% 11.9% 54.3% 101.9%
Greater Vancouver $936,300 300.4 1.8% 9.2% 13.6% 16.3% 9.9% 42.3% 95.4%
Burnaby East $693,200 311.0 1.7% 6.3% 2.9% 4.3% 1.2% 39.8% 92.8%
Burnaby North $816,900 304.9 2.5% 6.2% 10.0% 13.6% 6.5% 36.6% 92.5%
Burnaby South $747,000 312.4 1.2% 6.1% 6.4% 9.8% 1.8% 35.5% 93.6%
Coquitlam $833,900 305.9 1.4% 9.6% 14.5% 14.2% 13.0% 46.7% 109.4%
Ladner $756,300 279.9 0.6% 6.2% 14.4% 16.0% 0.8% 21.3% 66.8%
Maple Ridge $678,300 314.9 2.1% 14.1% 21.4% 23.7% 16.8% 77.1% 130.7%
New Westminster $834,900 318.9 3.7% 8.3% 12.6% 16.2% 8.5% 37.3% 96.4%
North Vancouver $1,104,900 273.2 1.6% 6.8% 9.8% 12.8% 10.7% 30.3% 85.1%
Pitt Meadows $741,900 321.0 3.4% 14.0% 19.4% 17.2% 15.6% 77.3% 120.3%
Port Coquitlam $780,800 295.6 0.8% 11.9% 19.4% 20.7% 13.2% 55.4% 108.2%
Port Moody $752,500 255.9 1.7% 11.0% 13.1% 12.4% 6.7% 36.6% 77.7%
Richmond $911,600 299.6 1.5% 6.1% 10.1% 14.7% 7.4% 33.4% 81.9%
Squamish $878,600 296.6 3.1% 12.1% 20.7% 30.2% 20.5% 63.5% 124.0%
Tsawwassen $843,900 277.8 0.4% 5.6% 9.7% 10.2% -8.4% 14.8% 63.1%
Vancouver East $992,700 315.7 -0.9% 9.1% 10.2% 9.7% 4.0% 35.7% 94.8%
Vancouver West $1,274,700 298.0 2.6% 9.2% 10.8% 13.3% 4.1% 25.5% 91.6%
Whistler $1,269,300 310.8 3.0% 11.5% 21.4% 33.0% 27.8% 85.0% 141.1%
Apartment Lower Mainland $726,700 306.9 1.5% 6.4% 9.8% 9.1% 3.6% 54.8% 99.0%
Greater Vancouver $737,100 296.0 1.2% 5.8% 9.1% 7.9% 2.8% 45.6% 91.7%
Burnaby East $712,300 283.5 1.1% 6.5% 4.6% 6.5% -3.1% 35.0% 73.5%
Burnaby North $714,500 279.9 1.7% 4.5% 7.6% 6.2% -0.3% 48.0% 92.2%
Burnaby South $682,600 279.7 1.3% 5.7% 6.7% 3.5% -3.4% 41.2% 78.5%
Coquitlam $588,000 322.7 2.0% 7.6% 10.7% 10.1% 6.7% 68.7% 119.5%
Ladner $560,000 262.3 1.6% 5.1% 10.5% 9.2% 3.7% 28.1% 66.9%
Maple Ridge $429,700 307.3 3.0% 8.9% 14.2% 13.8% 8.8% 86.5% 117.6%
New Westminster $556,700 315.4 1.9% 5.8% 6.2% 7.8% -1.1% 59.9% 106.4%
North Vancouver $654,000 266.1 1.6% 5.8% 8.5% 10.1% 3.8% 47.3% 81.5%
Pitt Meadows $548,200 336.6 1.9% 7.9% 13.1% 12.8% 5.4% 82.3% 133.6%
Port Coquitlam $527,200 315.3 1.8% 9.6% 12.9% 13.7% 9.1% 77.5% 116.6%
Port Moody $714,600 297.8 0.9% 6.4% 8.8% 8.2% 2.6% 60.6% 137.5%
Richmond $714,800 306.0 0.8% 4.6% 9.8% 10.8% 6.2% 61.6% 98.3%
Squamish $546,500 296.4 0.5% 5.3% 10.6% 17.3% 18.2% 61.6% 103.4%
Tsawwassen $614,200 264.9 0.3% 2.4% 8.1% 7.4% -0.2% 25.2% 72.0%
Vancouver East $636,200 357.6 1.0% 6.1% 8.6% 6.9% 1.3% 44.8% 95.2%
Vancouver West $836,100 271.3 0.8% 5.2% 9.4% 4.3% -1.1% 23.8% 75.5%
West Vancouver $1,131,000 229.8 -2.5% 1.5% 3.6% 12.4% -10.0% 30.3% 61.0%
Whistler $576,100 247.6 0.7% 4.1% 14.4% 23.3% 25.9% 75.4% 80.3%
HOW TO READ THE TABLE:
• Benchmark Price: Estimated sale price of a benchmark property. Benchmarks represent a typical property within each market.
• Price Index: Index numbers estimate the percentage change in price on typical and constant quality properties over time. All figures are based on past sales.
• x Month/Year Change %: Percentage change of index over a period of x month(s)/year(s)
In January 2005, the indexes are set to 100. *
Townhome properties are similar to attached properties, a category that was used in the previous MLSLink HPI, but do not included duplexes.
Lower Mainland includes areas serviced by both Real Estate Board of Greater Vancouver & Fraser Valley Real Estate Board.
The above info is deemed reliable, but is not guaranteed. All dollar amounts in CDN.
* MLS®, Multiple Listing Service®, and all related graphics are trademarks of The Canadian Real Estate Association 2 of 18
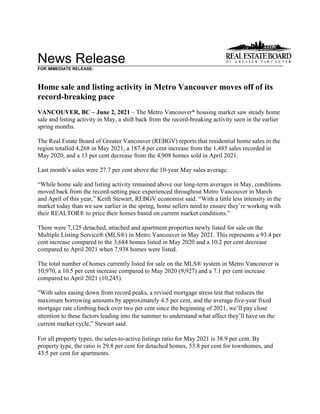
C:DATAMonthEndHpiexporthi_resgv-hpi2.tif
Greater
Vancouver
5
Year
Trend
60
110
160
210
260
310
360
May 2016
Jul 2016
Sep 2016
Nov 2016
Jan 2017
Mar 2017
May 2017
Jul 2017
Sep 2017
Nov 2017
Jan 2018
Mar 2018
May 2018
Jul 2018
Sep 2018
Nov 2018
Jan 2019
Mar 2019
May 2019
Jul 2019
Sep 2019
Nov 2019
Jan 2020
Mar 2020
May 2020
Jul 2020
Sep 2020
Nov 2020
Jan 2021
Mar 2021
May 2021
Price
Index
Residential
Detached
Townhouse
Apartment
Jan
2005
HPI
=
100
5
28
2021
MLS
®
SALES
Facts
B
u
r
n
a
b
y
C
o
q
u
it
la
m
D
e
lt
a
-
S
o
u
th
Is
la
n
d
s
-
G
u
lf
M
a
p
le
R
id
g
e
/P
it
t
M
e
a
d
o
w
s
N
e
w
W
e
s
tm
in
s
t
e
r
N
o
r
th
V
a
n
c
o
u
v
e
r
P
o
r
t
C
o
q
u
it
la
m
P
o
r
t
M
o
o
d
y
/B
e
lc
a
r
r
a
R
ic
h
m
o
n
d
S
q
u
a
m
is
h
S
u
n
s
h
in
e
C
o
a
s
t
V
a
n
c
o
u
v
e
r
E
a
s
t
V
a
n
c
o
u
v
e
r
W
e
s
t
W
e
s
t
V
a
n
c
o
u
v
e
r
/H
o
w
e
S
o
u
n
d
W
h
is
tl
e
r
/P
e
m
b
e
r
to
n
Detached
115
155
71
10
178
45
128
51
27
134
31
85
190
117
60
22
1,419
Attached
110
65
31
0
86
18
58
39
27
120
29
12
59
106
8
32
800
Apartment
296
130
42
0
73
129
171
72
46
248
30
18
222
513
21
38
2,049
Detached
$1,784,000
$1,499,500
$1,380,000
n/a
$1,200,000
$1,308,000
$1,877,000
$1,295,500
$1,700,000
$1,734,000
$1,384,000
$900,000
$1,770,000
$3,580,000
$3,125,000
$2,272,500
Attached
$905,750
$958,000
$780,000
n/a
$699,000
n/a
$1,195,000
$790,000
$950,000
$930,444
$914,950
n/a
$1,100,000
$1,479,450
n/a
$1,167,750
n/a
Apartment
$635,000
$606,500
$552,500
n/a
$457,000
$519,000
$670,000
$495,000
$628,000
$605,500
$572,450
n/a
$631,750
$775,000
$900,000
$584,500
Detached
160
126
73
10
204
38
183
74
30
178
32
80
221
139
80
27
1,655
Attached
124
74
33
1
104
24
86
22
38
178
29
10
92
111
5
33
964
Apartment
371
155
46
0
70
135
207
69
57
305
35
20
241
512
28
38
2,289
Detached
$1,776,500
$1,654,000
$1,338,000
n/a
$1,181,000
$1,344,000
$1,935,000
$1,250,000
$1,837,750
$1,744,000
$1,512,600
$914,987
$1,850,000
$3,300,000
$3,300,000
$2,075,000
Attached
$907,500
$984,000
$880,000
n/a
$690,000
$838,000
$1,219,450
$820,500
$835,000
$968,000
$925,000
n/a
$1,255,000
$1,408,000
n/a
$1,159,000
n/a
Apartment
$636,000
$600,000
$565,000
n/a
$458,000
$535,500
$699,000
$501,900
$650,000
$603,000
$565,000
$489,500
$630,000
$815,000
$880,000
$777,500
Detached
37
48
37
2
68
20
51
30
15
41
12
28
64
51
27
3
534
Attached
34
35
11
0
37
3
30
9
14
48
6
2
25
36
3
5
298
Apartment
89
49
7
0
27
49
55
21
17
63
4
1
76
177
12
6
653
Detached
$1,457,500
$1,210,000
$1,108,000
n/a
$881,000
$1,207,500
$1,580,000
$915,500
n/a
$1,566,500
n/a
$645,000
$1,450,000
$3,174,000
$2,145,000
n/a
Attached
$772,000
$825,000
n/a
n/a
$560,000
n/a
$1,011,750
n/a
n/a
$815,500
n/a
n/a
$1,172,500
$1,174,000
n/a
n/a
n/a
Apartment
$545,500
$499,500
n/a
n/a
$375,900
$493,000
$685,800
$474,000
n/a
$545,100
n/a
n/a
$595,000
$740,000
n/a
n/a
Detached
583
642
382
47
917
180
619
290
134
756
160
384
901
558
345
112
7,010
Attached
512
337
130
3
444
102
358
149
131
661
119
63
384
424
44
140
4,001
Apartment
1,550
716
202
0
366
614
814
299
228
1,235
133
72
1,061
2,378
105
216
9,989
Detached
$1,760,000
$1,550,000
$1,328,000
$807,500
$1,150,250
$1,322,500
$1,915,000
$1,258,888
$1,700,000
$1,750,000
$1,411,000
$859,500
$1,766,500
$3,405,000
$3,100,000
$2,167,500
Attached
$901,250
$964,900
$837,000
n/a
$665,000
$800,450
$1,200,500
$782,000
$900,000
$928,888
$884,000
$513,900
$1,200,000
$1,450,000
$1,825,500
$1,079,000
n/a
Apartment
$625,944
$575,000
$579,000
n/a
$443,750
$543,000
$696,500
$492,910
$637,000
$589,900
$560,555
$479,000
$625,000
$770,000
$998,500
$589,250
Detached
227
263
160
16
387
78
253
121
55
278
67
150
361
291
156
35
2,898
Attached
201
174
58
2
226
42
125
85
58
280
45
19
157
190
15
54
1,731
Apartment
573
328
73
0
150
269
360
135
87
529
41
18
462
1,085
39
61
4,210
Detached
$1,460,000
$1,236,000
$1,040,000
n/a
$879,998
$1,173,500
$1,600,000
$960,000
$1,345,000
$1,600,000
$1,100,000
$626,250
$1,475,000
$3,015,000
$2,450,000
$2,099,000
Attached
$809,000
$815,000
$711,900
n/a
$547,400
$711,476
$1,025,000
$678,300
$716,900
$820,000
$689,000
n/a
$1,098,000
$1,255,000
n/a
$1,112,500
n/a
Apartment
$591,000
$510,000
$530,000
n/a
$385,900
$511,800
$649,900
$445,000
$600,500
$550,000
$455,000
n/a
$590,000
$755,000
$925,000
$513,000
Note:
Median
Selling
Prices
are
not
reported
for
areas
with
less
than
20
sales
or
for
the
Gulf
Islands
Number
of
Sales
May
2021
Number
of
Sales
Median
Selling
Price
Number
of
Sales
Median
Selling
Price
Number
of
Sales
Median
Selling
Price
April
2021
May
2020
Jan.
-
May.
2021
Jan.
-
May.
2020
Median
Selling
Price
Number
of
Sales
Median
Selling
Price
May
2021
Year-to-date
Year-to-date
5
28
2021
MLS
®
LISTINGS
Facts
B
u
r
n
a
b
y
C
o
q
u
it
la
m
D
e
lt
a
-
S
o
u
th
Is
la
n
d
s
-
G
u
lf
M
a
p
le
R
id
g
e
/P
it
t
M
e
a
d
o
w
s
N
e
w
W
e
s
tm
in
s
t
e
r
N
o
r
th
V
a
n
c
o
u
v
e
r
P
o
r
t
C
o
q
u
it
la
m
P
o
r
t
M
o
o
d
y
/B
e
lc
a
r
r
a
R
ic
h
m
o
n
d
S
q
u
a
m
is
h
S
u
n
s
h
in
e
C
o
a
s
t
V
a
n
c
o
u
v
e
r
E
a
s
t
V
a
n
c
o
u
v
e
r
W
e
s
t
W
e
s
t
V
a
n
c
o
u
v
e
r
/H
o
w
e
S
o
u
n
d
W
h
is
tl
e
r
/P
e
m
b
e
r
to
n
Detached
221
231
113
16
256
62
248
100
43
257
43
116
349
340
192
35
2,622
Attached
165
101
41
1
98
41
73
51
43
164
43
18
127
177
24
54
1,221
Apartment
464
236
37
1
86
167
271
95
63
408
27
16
370
960
43
38
3,282
Detached
52%
67%
63%
63%
70%
73%
52%
51%
63%
52%
72%
73%
54%
34%
31%
63%
Attached
67%
64%
76%
0%
88%
44%
79%
76%
63%
73%
67%
67%
46%
60%
33%
59%
n/a
Apartment
64%
55%
114%
0%
85%
77%
63%
76%
73%
61%
111%
113%
60%
53%
49%
100%
Detached
337
278
130
12
284
72
263
117
52
361
50
121
481
350
223
34
3,165
Attached
183
116
36
0
120
31
112
44
50
208
41
9
136
189
21
28
1,324
Apartment
491
208
48
0
91
193
295
94
72
415
30
25
402
999
39
47
3,449
Detached
47%
45%
56%
83%
72%
53%
70%
63%
58%
49%
64%
66%
46%
40%
36%
79%
Attached
68%
64%
92%
n/a
87%
77%
77%
50%
76%
86%
71%
111%
68%
59%
24%
118%
n/a
Apartment
76%
75%
96%
n/a
77%
70%
70%
73%
79%
73%
117%
80%
60%
51%
72%
81%
Detached
80
125
69
4
114
34
134
30
31
115
36
98
109
116
96
21
1,212
Attached
67
91
17
0
64
19
51
27
21
90
20
8
76
77
8
27
663
Apartment
181
149
49
0
62
102
152
31
41
203
21
7
200
546
34
31
1,809
Detached
46%
38%
54%
50%
60%
59%
38%
100%
48%
36%
33%
29%
59%
44%
28%
14%
Attached
51%
38%
65%
n/a
58%
16%
59%
33%
67%
53%
30%
25%
33%
47%
38%
19%
n/a
Apartment
49%
33%
14%
n/a
44%
48%
36%
68%
41%
31%
19%
14%
38%
32%
35%
19%
Detached
1,130
1,078
579
51
1,251
298
1,002
479
216
1,344
237
535
1,682
1,347
889
134
12,252
Attached
728
455
182
5
505
144
488
201
181
867
167
62
607
771
94
181
5,638
Apartment
2,141
968
237
1
426
881
1,223
455
285
1,857
150
85
1,631
4,216
197
235
14,988
Detached
52%
60%
66%
92%
73%
60%
62%
61%
62%
56%
68%
72%
54%
41%
39%
84%
Attached
70%
74%
71%
60%
88%
71%
73%
74%
72%
76%
71%
102%
63%
55%
47%
77%
n/a
Apartment
72%
74%
85%
0%
86%
70%
67%
66%
80%
67%
89%
85%
65%
56%
53%
92%
Detached
464
542
328
29
686
144
596
179
143
637
157
340
654
606
499
102
6,106
Attached
348
315
110
6
363
85
273
156
103
473
96
55
313
408
48
133
3,285
Apartment
1,137
704
180
2
302
497
767
221
166
1,079
113
38
917
2,456
159
178
8,916
Detached
49%
49%
49%
55%
56%
54%
42%
68%
38%
44%
43%
44%
55%
48%
31%
34%
Attached
58%
55%
53%
33%
62%
49%
46%
54%
56%
59%
47%
35%
50%
47%
31%
41%
n/a
Apartment
50%
47%
41%
0%
50%
54%
47%
61%
52%
49%
36%
47%
50%
44%
25%
34%
*
Year-to-date
listings
represent
a
cumulative
total
of
listings
rather
than
total
active
listings.
%
Sales
to
Listings
Number
of
Listings
%
Sales
to
Listings
April
2021
May
2020
Jan.
-
May.
2021
Jan.
-
May.
2020
%
Sales
to
Listings
Number
of
Listings
%
Sales
to
Listings
Number
of
Listings
May
2021
Number
of
Listings
%
Sales
to
Listings
Number
of
Listings
May
2021
Year-to-date*
Year-to-date*
Listing & Sales Activity Summary
Listings Sales
1 2 3 Col. 2 & 3 5 6 7 Col. 6 & 7 9 10 Col. 9 & 10
May Apr May Percentage May Apr May Percentage Mar 2020 - Mar 2021 - Percentage
2020 2021 2021 Variance 2020 2021 2021 Variance May 2020 May 2021 Variance
BURNABY % % %
DETACHED 80 337 221 -34.4 37 160 115 -28.1 132 430 225.8
ATTACHED 67 183 165 -9.8 34 124 110 -11.3 117 388 231.6
APARTMENTS 181 491 464 -5.5 89 371 296 -20.2 315 1083 243.8
COQUITLAM
DETACHED 125 278 231 -16.9 48 126 155 23.0 155 461 197.4
ATTACHED 91 116 101 -12.9 35 74 65 -12.2 101 230 127.7
APARTMENTS 149 208 236 13.5 49 155 130 -16.1 170 472 177.6
DELTA
DETACHED 69 130 113 -13.1 37 73 71 -2.7 100 253 153.0
ATTACHED 17 36 41 13.9 11 33 31 -6.1 32 97 203.1
APARTMENTS 49 48 37 -22.9 7 46 42 -8.7 35 156 345.7
MAPLE RIDGE/PITT MEADOWS
DETACHED 114 284 256 -9.9 68 204 178 -12.7 222 653 194.1
ATTACHED 64 120 98 -18.3 37 104 86 -17.3 130 287 120.8
APARTMENTS 62 91 86 -5.5 27 70 73 4.3 80 244 205.0
NORTH VANCOUVER
DETACHED 134 263 248 -5.7 51 183 128 -30.1 158 486 207.6
ATTACHED 51 112 73 -34.8 30 86 58 -32.6 77 231 200.0
APARTMENTS 152 295 271 -8.1 55 207 171 -17.4 199 581 192.0
NEW WESTMINSTER
DETACHED 34 72 62 -13.9 20 38 45 18.4 51 129 152.9
ATTACHED 19 31 41 32.3 3 24 18 -25.0 31 67 116.1
APARTMENTS 102 193 167 -13.5 49 135 129 -4.4 168 437 160.1
PORT MOODY/BELCARRA
DETACHED 31 52 43 -17.3 15 30 27 -10.0 37 98 164.9
ATTACHED 21 50 43 -14.0 14 38 27 -28.9 38 97 155.3
APARTMENTS 41 72 63 -12.5 17 57 46 -19.3 52 161 209.6
PORT COQUITLAM
DETACHED 30 117 100 -14.5 30 74 51 -31.1 74 206 178.4
ATTACHED 27 44 51 15.9 9 22 39 77.3 52 106 103.8
APARTMENTS 31 94 95 1.1 21 69 72 4.3 72 218 202.8
RICHMOND
DETACHED 115 361 257 -28.8 41 178 134 -24.7 174 546 213.8
ATTACHED 90 208 164 -21.2 48 178 120 -32.6 158 482 205.1
APARTMENTS 203 415 408 -1.7 63 305 248 -18.7 292 896 206.8
SUNSHINE COAST
DETACHED 98 121 116 -4.1 28 80 85 6.3 98 271 176.5
ATTACHED 8 9 18 100.0 2 10 12 20.0 13 36 176.9
APARTMENTS 7 25 16 -36.0 1 20 18 -10.0 7 51 628.6
SQUAMISH
DETACHED 36 50 43 -14.0 12 32 31 -3.1 40 109 172.5
ATTACHED 20 41 43 4.9 6 29 29 0.0 23 86 273.9
APARTMENTS 21 30 27 -10.0 4 35 30 -14.3 14 92 557.1
VANCOUVER EAST
DETACHED 109 481 349 -27.4 64 221 190 -14.0 222 655 195.0
ATTACHED 76 136 127 -6.6 25 92 59 -35.9 89 251 182.0
APARTMENTS 200 402 370 -8.0 76 241 222 -7.9 266 779 192.9
VANCOUVER WEST
DETACHED 116 350 340 -2.9 51 139 117 -15.8 194 402 107.2
ATTACHED 77 189 177 -6.3 36 111 106 -4.5 117 323 176.1
APARTMENTS 546 999 960 -3.9 177 512 513 0.2 614 1653 169.2
WHISTLER/PEMBERTON
DETACHED 21 34 35 2.9 3 27 22 -18.5 18 72 300.0
ATTACHED 27 28 54 92.9 5 33 32 -3.0 21 98 366.7
APARTMENTS 31 47 38 -19.1 6 38 38 0.0 25 132 428.0
WEST VANCOUVER/HOWE SOUND
DETACHED 96 223 192 -13.9 27 80 60 -25.0 90 238 164.4
ATTACHED 8 21 24 14.3 3 5 8 60.0 10 29 190.0
APARTMENTS 34 39 43 10.3 12 28 21 -25.0 26 80 207.7
GRAND TOTALS
DETACHED 1208 3153 2606 -17.3 532 1645 1409 -14.3 1765 5009 183.8
ATTACHED 663 1324 1220 -7.9 298 963 800 -16.9 1009 2808 178.3
APARTMENTS 1809 3449 3281 -4.9 653 2289 2049 -10.5 2335 7035 201.3
Residential
Average
Sale
Prices
-
January
1977
to
May
2021
0
500
1000
1500
2000
2500
1
9
7
7
1
9
7
8
1
9
7
9
1
9
8
0
1
9
8
1
1
9
8
2
1
9
8
3
1
9
8
4
1
9
8
5
1
9
8
6
1
9
8
7
1
9
8
8
1
9
8
9
1
9
9
0
1
9
9
1
1
9
9
2
1
9
9
3
1
9
9
4
1
9
9
5
1
9
9
6
1
9
9
7
1
9
9
8
1
9
9
9
2
0
0
0
2
0
0
1
2
0
0
2
2
0
0
3
2
0
0
4
2
0
0
5
2
0
0
6
2
0
0
7
2
0
0
8
2
0
0
9
2
0
1
0
2
0
1
1
2
0
1
2
2
0
1
3
2
0
1
4
2
0
1
5
2
0
1
6
2
0
1
7
2
0
1
8
2
0
1
9
2
0
2
0
2
0
2
1
DETACHED
CONDOMINIUM
ATTACHED
APARTMENTS
IN
THOUSANDS
($)
NOTE:
From
1977
-
1984
condominium
averages
were
not
separated
into
attached
&
apartment.
$1,047,958
$707,413
$1,933,572

More Related Content

What's hot

2021 June - REBGV Statistics Package
2021 June - REBGV Statistics Package2021 June - REBGV Statistics Package
2021 June - REBGV Statistics PackageVicky Aulakh
 
REBGV Statistics Package August 2020
REBGV Statistics Package August 2020REBGV Statistics Package August 2020
REBGV Statistics Package August 2020Vicky Aulakh
 
REBGV Statistics Package June 2020
REBGV Statistics Package June 2020REBGV Statistics Package June 2020
REBGV Statistics Package June 2020Vicky Aulakh
 
Rebgv stats-pkg-july-2019
Rebgv stats-pkg-july-2019Rebgv stats-pkg-july-2019
Rebgv stats-pkg-july-2019Vicky Aulakh
 
REBGV Statistics Package October 2020
REBGV Statistics Package October 2020REBGV Statistics Package October 2020
REBGV Statistics Package October 2020Vicky Aulakh
 
May 2021 Real Estate Board of Greater Vancouver Statistics Package
May 2021 Real Estate Board of Greater Vancouver Statistics PackageMay 2021 Real Estate Board of Greater Vancouver Statistics Package
May 2021 Real Estate Board of Greater Vancouver Statistics PackageVicky Aulakh
 
REBGV Statistics Package May 2020
REBGV Statistics Package May 2020REBGV Statistics Package May 2020
REBGV Statistics Package May 2020Vicky Aulakh
 
Rebgv stats-pkg-december-2019
Rebgv stats-pkg-december-2019Rebgv stats-pkg-december-2019
Rebgv stats-pkg-december-2019Vicky Aulakh
 
REBGV Statistic Package December 2020
REBGV Statistic Package December 2020REBGV Statistic Package December 2020
REBGV Statistic Package December 2020Vicky Aulakh
 
Rebgv stats-pkg-april-2019
Rebgv stats-pkg-april-2019Rebgv stats-pkg-april-2019
Rebgv stats-pkg-april-2019Kathryn Huang
 
Metro Vancouver Statistics September 2021
Metro Vancouver Statistics September 2021 Metro Vancouver Statistics September 2021
Metro Vancouver Statistics September 2021 VickyAulakh1
 
Rebgv stats-pkg-june-2019
Rebgv stats-pkg-june-2019Rebgv stats-pkg-june-2019
Rebgv stats-pkg-june-2019Vicky Aulakh
 
Victoria Real Estate Board July 2021 Statistics
Victoria Real Estate Board July 2021 StatisticsVictoria Real Estate Board July 2021 Statistics
Victoria Real Estate Board July 2021 StatisticsVicky Aulakh
 
VREB October 2020 Statistics Package
VREB October 2020 Statistics PackageVREB October 2020 Statistics Package
VREB October 2020 Statistics PackageVicky Aulakh
 
Rebgv stats-pkg-may-2021
Rebgv stats-pkg-may-2021Rebgv stats-pkg-may-2021
Rebgv stats-pkg-may-2021BC PRIME Realty
 
Real Estate Board of Greater Vancouver Statistics Package February 2022
Real Estate Board of Greater Vancouver Statistics Package February 2022Real Estate Board of Greater Vancouver Statistics Package February 2022
Real Estate Board of Greater Vancouver Statistics Package February 2022Vicky Aulakh
 
Real Estate Board of Greater Vancouver Statistics Package October 2021
Real Estate Board of Greater Vancouver Statistics Package October 2021Real Estate Board of Greater Vancouver Statistics Package October 2021
Real Estate Board of Greater Vancouver Statistics Package October 2021VickyAulakh1
 

What's hot (17)

2021 June - REBGV Statistics Package
2021 June - REBGV Statistics Package2021 June - REBGV Statistics Package
2021 June - REBGV Statistics Package
 
REBGV Statistics Package August 2020
REBGV Statistics Package August 2020REBGV Statistics Package August 2020
REBGV Statistics Package August 2020
 
REBGV Statistics Package June 2020
REBGV Statistics Package June 2020REBGV Statistics Package June 2020
REBGV Statistics Package June 2020
 
Rebgv stats-pkg-july-2019
Rebgv stats-pkg-july-2019Rebgv stats-pkg-july-2019
Rebgv stats-pkg-july-2019
 
REBGV Statistics Package October 2020
REBGV Statistics Package October 2020REBGV Statistics Package October 2020
REBGV Statistics Package October 2020
 
May 2021 Real Estate Board of Greater Vancouver Statistics Package
May 2021 Real Estate Board of Greater Vancouver Statistics PackageMay 2021 Real Estate Board of Greater Vancouver Statistics Package
May 2021 Real Estate Board of Greater Vancouver Statistics Package
 
REBGV Statistics Package May 2020
REBGV Statistics Package May 2020REBGV Statistics Package May 2020
REBGV Statistics Package May 2020
 
Rebgv stats-pkg-december-2019
Rebgv stats-pkg-december-2019Rebgv stats-pkg-december-2019
Rebgv stats-pkg-december-2019
 
REBGV Statistic Package December 2020
REBGV Statistic Package December 2020REBGV Statistic Package December 2020
REBGV Statistic Package December 2020
 
Rebgv stats-pkg-april-2019
Rebgv stats-pkg-april-2019Rebgv stats-pkg-april-2019
Rebgv stats-pkg-april-2019
 
Metro Vancouver Statistics September 2021
Metro Vancouver Statistics September 2021 Metro Vancouver Statistics September 2021
Metro Vancouver Statistics September 2021
 
Rebgv stats-pkg-june-2019
Rebgv stats-pkg-june-2019Rebgv stats-pkg-june-2019
Rebgv stats-pkg-june-2019
 
Victoria Real Estate Board July 2021 Statistics
Victoria Real Estate Board July 2021 StatisticsVictoria Real Estate Board July 2021 Statistics
Victoria Real Estate Board July 2021 Statistics
 
VREB October 2020 Statistics Package
VREB October 2020 Statistics PackageVREB October 2020 Statistics Package
VREB October 2020 Statistics Package
 
Rebgv stats-pkg-may-2021
Rebgv stats-pkg-may-2021Rebgv stats-pkg-may-2021
Rebgv stats-pkg-may-2021
 
Real Estate Board of Greater Vancouver Statistics Package February 2022
Real Estate Board of Greater Vancouver Statistics Package February 2022Real Estate Board of Greater Vancouver Statistics Package February 2022
Real Estate Board of Greater Vancouver Statistics Package February 2022
 
Real Estate Board of Greater Vancouver Statistics Package October 2021
Real Estate Board of Greater Vancouver Statistics Package October 2021Real Estate Board of Greater Vancouver Statistics Package October 2021
Real Estate Board of Greater Vancouver Statistics Package October 2021
 

Similar to Real Estate Board of Greater Vancouver - Stats Package May 2021

REBGV Statistics Package May 2022
REBGV Statistics Package May 2022REBGV Statistics Package May 2022
REBGV Statistics Package May 2022Vicky Aulakh
 
Real Estate Board of Greater Vancouver Statistics Package January 2021
Real Estate Board of Greater Vancouver Statistics Package January 2021 Real Estate Board of Greater Vancouver Statistics Package January 2021
Real Estate Board of Greater Vancouver Statistics Package January 2021 Vicky Aulakh
 
Real Estate Board of Greater Vancouver - Statistics Package for July 2021
Real Estate Board of Greater Vancouver - Statistics Package for July 2021Real Estate Board of Greater Vancouver - Statistics Package for July 2021
Real Estate Board of Greater Vancouver - Statistics Package for July 2021Alexander Mackenzie, PMP
 
REBGV Statistics package July 2020
REBGV Statistics package July 2020REBGV Statistics package July 2020
REBGV Statistics package July 2020Vicky Aulakh
 
REBGV-Stats-Pkg-July-2022
REBGV-Stats-Pkg-July-2022REBGV-Stats-Pkg-July-2022
REBGV-Stats-Pkg-July-2022Vicky Aulakh
 
Rebgv Stats Package September 2020
Rebgv Stats Package September 2020Rebgv Stats Package September 2020
Rebgv Stats Package September 2020Vicky Aulakh
 
Real Estate Board of Greater Vancouver Statistics Package March 2021
Real Estate Board of Greater Vancouver Statistics Package March 2021Real Estate Board of Greater Vancouver Statistics Package March 2021
Real Estate Board of Greater Vancouver Statistics Package March 2021Vicky Aulakh
 
REBGV Statistics Package December 2022
REBGV Statistics Package December 2022REBGV Statistics Package December 2022
REBGV Statistics Package December 2022VickyAulakh1
 
Real Estate Board of Greater Vancouver Statistics Package - November 2021
Real Estate Board of Greater Vancouver Statistics Package - November 2021Real Estate Board of Greater Vancouver Statistics Package - November 2021
Real Estate Board of Greater Vancouver Statistics Package - November 2021VickyAulakh1
 
REBGV January 2020 Statistics Package
REBGV January 2020 Statistics Package REBGV January 2020 Statistics Package
REBGV January 2020 Statistics Package Vicky Aulakh
 
201807 rebgv-stats-package-for-media
201807 rebgv-stats-package-for-media201807 rebgv-stats-package-for-media
201807 rebgv-stats-package-for-mediaKathryn Huang
 
Rebgv stats-pkg-june-2018
Rebgv stats-pkg-june-2018Rebgv stats-pkg-june-2018
Rebgv stats-pkg-june-2018Kathryn Huang
 
September 2015 rebgv statistics package mike stewart
September 2015 rebgv statistics package mike stewartSeptember 2015 rebgv statistics package mike stewart
September 2015 rebgv statistics package mike stewartMike Stewart
 
March 2020 REBGV Statistics Package
March 2020 REBGV Statistics PackageMarch 2020 REBGV Statistics Package
March 2020 REBGV Statistics PackageMike Stewart
 
March 2020-rebgv-stats-pkg
March 2020-rebgv-stats-pkgMarch 2020-rebgv-stats-pkg
March 2020-rebgv-stats-pkgMatt Scalena
 

Similar to Real Estate Board of Greater Vancouver - Stats Package May 2021 (19)

REBGV Statistics Package May 2022
REBGV Statistics Package May 2022REBGV Statistics Package May 2022
REBGV Statistics Package May 2022
 
2021 June REBGV Stats Package
2021 June REBGV Stats Package2021 June REBGV Stats Package
2021 June REBGV Stats Package
 
Real Estate Board of Greater Vancouver Statistics Package January 2021
Real Estate Board of Greater Vancouver Statistics Package January 2021 Real Estate Board of Greater Vancouver Statistics Package January 2021
Real Estate Board of Greater Vancouver Statistics Package January 2021
 
Real Estate Board of Greater Vancouver - Statistics Package for July 2021
Real Estate Board of Greater Vancouver - Statistics Package for July 2021Real Estate Board of Greater Vancouver - Statistics Package for July 2021
Real Estate Board of Greater Vancouver - Statistics Package for July 2021
 
REBGV Statistics package July 2020
REBGV Statistics package July 2020REBGV Statistics package July 2020
REBGV Statistics package July 2020
 
REBGV-Stats-Pkg-July-2022
REBGV-Stats-Pkg-July-2022REBGV-Stats-Pkg-July-2022
REBGV-Stats-Pkg-July-2022
 
Rebgv Stats Package September 2020
Rebgv Stats Package September 2020Rebgv Stats Package September 2020
Rebgv Stats Package September 2020
 
Rebgv stats-pkg-october-2020
Rebgv stats-pkg-october-2020Rebgv stats-pkg-october-2020
Rebgv stats-pkg-october-2020
 
Rebgv stats-pkg-august-2021
Rebgv stats-pkg-august-2021Rebgv stats-pkg-august-2021
Rebgv stats-pkg-august-2021
 
Real Estate Board of Greater Vancouver Statistics Package March 2021
Real Estate Board of Greater Vancouver Statistics Package March 2021Real Estate Board of Greater Vancouver Statistics Package March 2021
Real Estate Board of Greater Vancouver Statistics Package March 2021
 
REBGV Statistics Package December 2022
REBGV Statistics Package December 2022REBGV Statistics Package December 2022
REBGV Statistics Package December 2022
 
Real Estate Board of Greater Vancouver Statistics Package - November 2021
Real Estate Board of Greater Vancouver Statistics Package - November 2021Real Estate Board of Greater Vancouver Statistics Package - November 2021
Real Estate Board of Greater Vancouver Statistics Package - November 2021
 
Rebgv stats-pkg-november-2020
Rebgv stats-pkg-november-2020Rebgv stats-pkg-november-2020
Rebgv stats-pkg-november-2020
 
REBGV January 2020 Statistics Package
REBGV January 2020 Statistics Package REBGV January 2020 Statistics Package
REBGV January 2020 Statistics Package
 
201807 rebgv-stats-package-for-media
201807 rebgv-stats-package-for-media201807 rebgv-stats-package-for-media
201807 rebgv-stats-package-for-media
 
Rebgv stats-pkg-june-2018
Rebgv stats-pkg-june-2018Rebgv stats-pkg-june-2018
Rebgv stats-pkg-june-2018
 
September 2015 rebgv statistics package mike stewart
September 2015 rebgv statistics package mike stewartSeptember 2015 rebgv statistics package mike stewart
September 2015 rebgv statistics package mike stewart
 
March 2020 REBGV Statistics Package
March 2020 REBGV Statistics PackageMarch 2020 REBGV Statistics Package
March 2020 REBGV Statistics Package
 
March 2020-rebgv-stats-pkg
March 2020-rebgv-stats-pkgMarch 2020-rebgv-stats-pkg
March 2020-rebgv-stats-pkg
 

Recently uploaded

Eco-Efficient Living: Redefining Sustainability through Leech's Green Design ...
Eco-Efficient Living: Redefining Sustainability through Leech's Green Design ...Eco-Efficient Living: Redefining Sustainability through Leech's Green Design ...
Eco-Efficient Living: Redefining Sustainability through Leech's Green Design ...Newman George Leech
 
Call Girls In Mundka Industrial Metro@꧂8447779280 ↬Enjoy ꧂Escort Service in ...
Call Girls In Mundka Industrial Metro@꧂8447779280 ↬Enjoy ꧂Escort Service in  ...Call Girls In Mundka Industrial Metro@꧂8447779280 ↬Enjoy ꧂Escort Service in  ...
Call Girls In Mundka Industrial Metro@꧂8447779280 ↬Enjoy ꧂Escort Service in ...asmaqueen5
 
The Omaxe State Dwarka Delhi-broucher.pdf.pdf
The Omaxe State Dwarka Delhi-broucher.pdf.pdfThe Omaxe State Dwarka Delhi-broucher.pdf.pdf
The Omaxe State Dwarka Delhi-broucher.pdf.pdfkratirudram
 
9990771857 Call Girls in Noida Sector 11 Noida (Call Girls) Delhi
9990771857 Call Girls in Noida Sector 11 Noida (Call Girls) Delhi9990771857 Call Girls in Noida Sector 11 Noida (Call Girls) Delhi
9990771857 Call Girls in Noida Sector 11 Noida (Call Girls) Delhidelhimodel235
 
call girls in Shahdara (DELHI) 🔝 >༒9953330565🔝 genuine Escort Service 🔝✔️✔️
call girls in Shahdara (DELHI) 🔝 >༒9953330565🔝 genuine Escort Service 🔝✔️✔️call girls in Shahdara (DELHI) 🔝 >༒9953330565🔝 genuine Escort Service 🔝✔️✔️
call girls in Shahdara (DELHI) 🔝 >༒9953330565🔝 genuine Escort Service 🔝✔️✔️9953056974 Low Rate Call Girls In Saket, Delhi NCR
 
Nanke Area Estate commercial ( Dir. Kat Kuo)
Nanke Area Estate commercial ( Dir. Kat Kuo)Nanke Area Estate commercial ( Dir. Kat Kuo)
Nanke Area Estate commercial ( Dir. Kat Kuo)jessica288382
 
Call Girls in Pitampura Delhi 💯Call Us 🔝8264348440🔝
Call Girls in Pitampura Delhi 💯Call Us 🔝8264348440🔝Call Girls in Pitampura Delhi 💯Call Us 🔝8264348440🔝
Call Girls in Pitampura Delhi 💯Call Us 🔝8264348440🔝soniya singh
 
Call Girls in Model Town Delhi 💯Call Us 🔝8264348440🔝
Call Girls in Model Town Delhi 💯Call Us 🔝8264348440🔝Call Girls in Model Town Delhi 💯Call Us 🔝8264348440🔝
Call Girls in Model Town Delhi 💯Call Us 🔝8264348440🔝soniya singh
 
Call Girls In Mayur Vihar-1 Delhi ❤️8860477959 Good Looking Escorts In 24/7 D...
Call Girls In Mayur Vihar-1 Delhi ❤️8860477959 Good Looking Escorts In 24/7 D...Call Girls In Mayur Vihar-1 Delhi ❤️8860477959 Good Looking Escorts In 24/7 D...
Call Girls In Mayur Vihar-1 Delhi ❤️8860477959 Good Looking Escorts In 24/7 D...lizamodels9
 
Call Girls In Vasundhara Ghaziabad ❤️8860477959 Low Rate Escorts Service In 2...
Call Girls In Vasundhara Ghaziabad ❤️8860477959 Low Rate Escorts Service In 2...Call Girls In Vasundhara Ghaziabad ❤️8860477959 Low Rate Escorts Service In 2...
Call Girls In Vasundhara Ghaziabad ❤️8860477959 Low Rate Escorts Service In 2...lizamodels9
 
9990771857 Call Girls in Noida Sector 1 Noida (Call Girls) Delhi
9990771857 Call Girls in Noida Sector 1 Noida (Call Girls) Delhi9990771857 Call Girls in Noida Sector 1 Noida (Call Girls) Delhi
9990771857 Call Girls in Noida Sector 1 Noida (Call Girls) Delhidelhimodel235
 
Call Girls in Khan Market 9654467111 ESCORTS SERVICE
Call Girls in Khan Market 9654467111 ESCORTS SERVICECall Girls in Khan Market 9654467111 ESCORTS SERVICE
Call Girls in Khan Market 9654467111 ESCORTS SERVICESapana Sha
 
Low Rate Call Girls in Akshardham Delhi Call 9990771857
Low Rate Call Girls in Akshardham   Delhi Call 9990771857Low Rate Call Girls in Akshardham   Delhi Call 9990771857
Low Rate Call Girls in Akshardham Delhi Call 9990771857delhimodel235
 
Telibagh & Call Girls Lucknow - 450+ Call Girl Cash Payment 🎂 8923113531 🎪 Ne...
Telibagh & Call Girls Lucknow - 450+ Call Girl Cash Payment 🎂 8923113531 🎪 Ne...Telibagh & Call Girls Lucknow - 450+ Call Girl Cash Payment 🎂 8923113531 🎪 Ne...
Telibagh & Call Girls Lucknow - 450+ Call Girl Cash Payment 🎂 8923113531 🎪 Ne...gurkirankumar98700
 
Call Girls in Inderpuri Delhi 💯Call Us 🔝8264348440🔝
Call Girls in Inderpuri Delhi 💯Call Us 🔝8264348440🔝Call Girls in Inderpuri Delhi 💯Call Us 🔝8264348440🔝
Call Girls in Inderpuri Delhi 💯Call Us 🔝8264348440🔝soniya singh
 
Rustomjee The Panorama At Pali Hill, Bandra West, Mumbai - Brochure.pdf
Rustomjee The Panorama At Pali Hill, Bandra West, Mumbai - Brochure.pdfRustomjee The Panorama At Pali Hill, Bandra West, Mumbai - Brochure.pdf
Rustomjee The Panorama At Pali Hill, Bandra West, Mumbai - Brochure.pdfmonikasharma630
 
Low Rate Call Girls in Tughlakabad Delhi Call 9990771857
Low Rate Call Girls in Tughlakabad Delhi Call 9990771857Low Rate Call Girls in Tughlakabad Delhi Call 9990771857
Low Rate Call Girls in Tughlakabad Delhi Call 9990771857delhimodel235
 
Call Girls in Sarai Kale Khan Delhi 💯Call Us 🔝8264348440🔝
Call Girls in Sarai Kale Khan Delhi 💯Call Us 🔝8264348440🔝Call Girls in Sarai Kale Khan Delhi 💯Call Us 🔝8264348440🔝
Call Girls in Sarai Kale Khan Delhi 💯Call Us 🔝8264348440🔝soniya singh
 

Recently uploaded (20)

Eco-Efficient Living: Redefining Sustainability through Leech's Green Design ...
Eco-Efficient Living: Redefining Sustainability through Leech's Green Design ...Eco-Efficient Living: Redefining Sustainability through Leech's Green Design ...
Eco-Efficient Living: Redefining Sustainability through Leech's Green Design ...
 
Call Girls In Mundka Industrial Metro@꧂8447779280 ↬Enjoy ꧂Escort Service in ...
Call Girls In Mundka Industrial Metro@꧂8447779280 ↬Enjoy ꧂Escort Service in  ...Call Girls In Mundka Industrial Metro@꧂8447779280 ↬Enjoy ꧂Escort Service in  ...
Call Girls In Mundka Industrial Metro@꧂8447779280 ↬Enjoy ꧂Escort Service in ...
 
The Omaxe State Dwarka Delhi-broucher.pdf.pdf
The Omaxe State Dwarka Delhi-broucher.pdf.pdfThe Omaxe State Dwarka Delhi-broucher.pdf.pdf
The Omaxe State Dwarka Delhi-broucher.pdf.pdf
 
9990771857 Call Girls in Noida Sector 11 Noida (Call Girls) Delhi
9990771857 Call Girls in Noida Sector 11 Noida (Call Girls) Delhi9990771857 Call Girls in Noida Sector 11 Noida (Call Girls) Delhi
9990771857 Call Girls in Noida Sector 11 Noida (Call Girls) Delhi
 
call girls in Shahdara (DELHI) 🔝 >༒9953330565🔝 genuine Escort Service 🔝✔️✔️
call girls in Shahdara (DELHI) 🔝 >༒9953330565🔝 genuine Escort Service 🔝✔️✔️call girls in Shahdara (DELHI) 🔝 >༒9953330565🔝 genuine Escort Service 🔝✔️✔️
call girls in Shahdara (DELHI) 🔝 >༒9953330565🔝 genuine Escort Service 🔝✔️✔️
 
Nanke Area Estate commercial ( Dir. Kat Kuo)
Nanke Area Estate commercial ( Dir. Kat Kuo)Nanke Area Estate commercial ( Dir. Kat Kuo)
Nanke Area Estate commercial ( Dir. Kat Kuo)
 
Low Rate Call Girls in Triveni Complex Delhi Call 9873940964
Low Rate Call Girls in Triveni Complex Delhi Call 9873940964Low Rate Call Girls in Triveni Complex Delhi Call 9873940964
Low Rate Call Girls in Triveni Complex Delhi Call 9873940964
 
Call Girls in Pitampura Delhi 💯Call Us 🔝8264348440🔝
Call Girls in Pitampura Delhi 💯Call Us 🔝8264348440🔝Call Girls in Pitampura Delhi 💯Call Us 🔝8264348440🔝
Call Girls in Pitampura Delhi 💯Call Us 🔝8264348440🔝
 
Call Girls in Model Town Delhi 💯Call Us 🔝8264348440🔝
Call Girls in Model Town Delhi 💯Call Us 🔝8264348440🔝Call Girls in Model Town Delhi 💯Call Us 🔝8264348440🔝
Call Girls in Model Town Delhi 💯Call Us 🔝8264348440🔝
 
Call Girls In Mayur Vihar-1 Delhi ❤️8860477959 Good Looking Escorts In 24/7 D...
Call Girls In Mayur Vihar-1 Delhi ❤️8860477959 Good Looking Escorts In 24/7 D...Call Girls In Mayur Vihar-1 Delhi ❤️8860477959 Good Looking Escorts In 24/7 D...
Call Girls In Mayur Vihar-1 Delhi ❤️8860477959 Good Looking Escorts In 24/7 D...
 
Call Girls In Vasundhara Ghaziabad ❤️8860477959 Low Rate Escorts Service In 2...
Call Girls In Vasundhara Ghaziabad ❤️8860477959 Low Rate Escorts Service In 2...Call Girls In Vasundhara Ghaziabad ❤️8860477959 Low Rate Escorts Service In 2...
Call Girls In Vasundhara Ghaziabad ❤️8860477959 Low Rate Escorts Service In 2...
 
9990771857 Call Girls in Noida Sector 1 Noida (Call Girls) Delhi
9990771857 Call Girls in Noida Sector 1 Noida (Call Girls) Delhi9990771857 Call Girls in Noida Sector 1 Noida (Call Girls) Delhi
9990771857 Call Girls in Noida Sector 1 Noida (Call Girls) Delhi
 
Call Girls in Khan Market 9654467111 ESCORTS SERVICE
Call Girls in Khan Market 9654467111 ESCORTS SERVICECall Girls in Khan Market 9654467111 ESCORTS SERVICE
Call Girls in Khan Market 9654467111 ESCORTS SERVICE
 
Low Rate Call Girls in Akshardham Delhi Call 9990771857
Low Rate Call Girls in Akshardham   Delhi Call 9990771857Low Rate Call Girls in Akshardham   Delhi Call 9990771857
Low Rate Call Girls in Akshardham Delhi Call 9990771857
 
Telibagh & Call Girls Lucknow - 450+ Call Girl Cash Payment 🎂 8923113531 🎪 Ne...
Telibagh & Call Girls Lucknow - 450+ Call Girl Cash Payment 🎂 8923113531 🎪 Ne...Telibagh & Call Girls Lucknow - 450+ Call Girl Cash Payment 🎂 8923113531 🎪 Ne...
Telibagh & Call Girls Lucknow - 450+ Call Girl Cash Payment 🎂 8923113531 🎪 Ne...
 
Call Girls in Inderpuri Delhi 💯Call Us 🔝8264348440🔝
Call Girls in Inderpuri Delhi 💯Call Us 🔝8264348440🔝Call Girls in Inderpuri Delhi 💯Call Us 🔝8264348440🔝
Call Girls in Inderpuri Delhi 💯Call Us 🔝8264348440🔝
 
Rustomjee The Panorama At Pali Hill, Bandra West, Mumbai - Brochure.pdf
Rustomjee The Panorama At Pali Hill, Bandra West, Mumbai - Brochure.pdfRustomjee The Panorama At Pali Hill, Bandra West, Mumbai - Brochure.pdf
Rustomjee The Panorama At Pali Hill, Bandra West, Mumbai - Brochure.pdf
 
Hot call girls in Moti Bagh🔝 9953056974 🔝 escort Service
Hot call girls in Moti Bagh🔝 9953056974 🔝 escort ServiceHot call girls in Moti Bagh🔝 9953056974 🔝 escort Service
Hot call girls in Moti Bagh🔝 9953056974 🔝 escort Service
 
Low Rate Call Girls in Tughlakabad Delhi Call 9990771857
Low Rate Call Girls in Tughlakabad Delhi Call 9990771857Low Rate Call Girls in Tughlakabad Delhi Call 9990771857
Low Rate Call Girls in Tughlakabad Delhi Call 9990771857
 
Call Girls in Sarai Kale Khan Delhi 💯Call Us 🔝8264348440🔝
Call Girls in Sarai Kale Khan Delhi 💯Call Us 🔝8264348440🔝Call Girls in Sarai Kale Khan Delhi 💯Call Us 🔝8264348440🔝
Call Girls in Sarai Kale Khan Delhi 💯Call Us 🔝8264348440🔝
 

Real Estate Board of Greater Vancouver - Stats Package May 2021