SlideShare a Scribd company logo
1 of 9
Download to read offline
News Release
FOR IMMEDIATE RELEASE:
November home sales outpace seasonal norms and long-term
averages
Vancouver, B.C. – December 2, 2020 – Housing demand in Metro Vancouver* continues to
outpace historical averages with November sales eclipsing 3,000 for the first time since 2015.
The Real Estate Board of Greater Vancouver (REBGV) reports that residential home sales in the
region totalled 3,064 in November 2020, a 22.7 per cent increase from the 2,498 sales recorded
in November 2019, and a 16.9 per cent decrease from the 3,687 homes sold in October 2020.
Last month’s sales were 24.6 per cent above the 10-year November sales average and was the
second highest total in this period.
“Home buyer demand has been at near record levels in our region since the summer,” Colette
Gerber, REBGV Chair said. “This is putting upward pressure on home prices, particularly in our
detached and townhome markets."
There were 4,068 detached, attached and apartment homes newly listed for sale on the Multiple
Listing Service® (MLS®) in Metro Vancouver in November 2020. This represents a 36.2 per
cent increase compared to the 2,987 homes listed in November 2019 and a 27 per cent decrease
compared to October 2020 when 5,571 homes were listed.
The total number of homes currently listed for sale on the MLS® system in Metro Vancouver is
11,118, a 3.2 per cent increase compared to November 2019 (10,770) and a 10.5 per cent
decrease compared to October 2020 (12,416).
"The supply of homes for sale are a critical factor in understanding home price trends," Gerber
said. "The total number of homes for sale in Metro Vancouver is lagging behind the pace of
demand right now. This trend favours home sellers in today's market."
For all property types, the sales-to-active listings ratio for November 2020 is 27.6 per cent. By
property type, the ratio is 27.9 per cent for detached homes, 40.1 per cent for townhomes, and
23.9 per cent for apartments.
Generally, analysts say downward pressure on home prices occurs when the ratio dips below 12
per cent for a sustained period, while home prices often experience upward pressure when it
surpasses 20 per cent over several months.
Within the region, the Sunshine Coast saw the largest increase in year-over-year demand with
106 home sales in November 2020, an 82.8 per cent increase over November 2019 (58).
“While demand remained elevated across the region, home buyer activity was particularly
focused in more remote areas like the Sunshine Coast, Gulf Islands and Squamish,” Gerber said.
“The rise of work-from-home arrangements and physical distancing policies is causing some
home buyers to opt for less densified areas.”
The MLS® Home Price Index composite benchmark price for all residential properties in Metro
Vancouver is currently $1,044,000. This represents a 5.8 per cent increase over November 2019
and a 0.1 per cent decrease compared to October 2020.
Sales of detached homes in November 2020 reached 1,061, a 28.6 per cent increase from the 825
detached sales recorded in November 2019. The benchmark price for a detached home is
$1,538,900. This represents a 9.4 per cent increase from November 2019 and a one per cent
increase compared to October 2020.
Sales of apartment homes reached 1,371 in November 2020, a 12.2 per cent increase compared
to the 1,222 sales in November 2019. The benchmark price of an apartment home is $676,500.
This represents a 3.4 per cent increase from November 2019 and a one per cent decrease
compared to October 2020.
Attached home sales in November 2020 totalled 632, a 40.1 per cent increase compared to the
451 sales in November 2019. The benchmark price of an attached home is $814,800. This
represents a 5.6 per cent increase from November 2019 and a 0.2 per cent increase compared to
October 2020.
-30-
*Editor’s Note: Areas covered by the Real Estate Board of Greater Vancouver include: Burnaby, Coquitlam, Maple
Ridge, New Westminster, North Vancouver, Pitt Meadows, Port Coquitlam, Port Moody, Richmond, South Delta,
Squamish, Sunshine Coast, Vancouver, West Vancouver, and Whistler.
The real estate industry is a key economic driver in British Columbia. In 2019, 25,351 homes changed ownership in
the Board’s area, generating $1.8 billion in economic spin-off activity and an estimated 12,910 jobs. The total dollar
value of residential sales transacted through the MLS® system in Greater Vancouver totalled $25.3 billion in 2019.
The Real Estate Board of Greater Vancouver is an association representing more than 14,000 REALTORS® and
their companies. The Board provides a variety of member services, including the Multiple Listing Service®. For
more information on real estate, statistics, and buying or selling a home, contact a local REALTOR® or visit
www.rebgv.org.
For more information please contact:
Craig Munn
Director, Communication
Real Estate Board of Greater Vancouver
604.730.3146
cmunn@rebgv.org
Property Type Area
Benchmark
Price
Price
Index
1 Month
Change %
3 Month
Change %
6 Month
Change %
1 Year
Change %
3 Year
Change %
5 Year
Change %
10 Year
Change %
Residential / Composite Lower Mainland $985,900 276.2 0.2% 1.0% 2.3% 6.4% 3.1% 46.7% 89.0%
Greater Vancouver $1,044,000 273.9 -0.1% 0.5% 1.5% 5.8% -0.1% 37.8% 83.1%
Bowen Island $1,149,900 249.3 0.9% 7.7% 20.3% 19.9% 18.7% 81.6% 86.6%
Burnaby East $992,200 275.2 0.1% 1.1% 2.1% 6.7% 1.4% 39.6% 85.9%
Burnaby North $899,200 271.5 0.1% 0.7% 0.4% 4.7% 0.6% 42.4% 86.2%
Burnaby South $969,000 273.7 -0.1% 0.5% -0.6% 2.9% -3.3% 37.4% 83.6%
Coquitlam $951,000 282.1 0.0% 1.6% 1.6% 7.6% 3.6% 48.2% 101.1%
Ladner $863,900 243.2 0.3% 1.5% 2.9% 9.0% -3.1% 21.2% 67.5%
Maple Ridge $809,600 257.8 0.9% 3.0% 3.9% 8.7% 8.9% 69.8% 94.7%
New Westminster $669,600 294.6 -0.3% 0.4% 1.1% 5.1% 5.1% 57.8% 95.9%
North Vancouver $1,116,900 251.0 -0.1% 1.7% 4.6% 9.3% 1.2% 35.1% 80.8%
Pitt Meadows $777,700 282.7 0.2% 2.0% 2.1% 7.3% 8.6% 70.6% 109.7%
Port Coquitlam $789,100 270.1 -0.1% 1.6% 2.6% 6.8% 4.6% 57.1% 93.9%
Port Moody $940,700 260.0 1.2% 2.7% 0.8% 5.3% 2.9% 47.7% 89.0%
Richmond $950,400 283.7 -0.3% 0.6% 1.6% 5.3% -0.7% 36.7% 77.9%
Squamish $821,600 261.4 1.2% 5.0% 8.8% 5.8% 8.4% 66.1% 106.3%
Sunshine Coast $693,900 243.1 2.4% 7.7% 17.5% 16.9% 17.2% 79.8% 90.5%
Tsawwassen $976,300 253.1 0.9% 1.6% 5.2% 8.9% -2.7% 20.1% 82.6%
Vancouver East $1,101,500 327.3 0.5% -0.7% 1.1% 6.1% -1.1% 35.8% 98.5%
Vancouver West $1,252,800 261.6 -1.7% -3.0% -2.4% 2.6% -8.2% 20.5% 67.5%
West Vancouver $2,263,300 249.2 -0.1% 4.2% 5.6% 8.1% -11.1% 10.3% 76.0%
Whistler $965,900 225.1 1.3% 4.5% 7.7% 5.2% 12.2% 69.8% 83.5%
Single Family Detached Lower Mainland $1,331,700 284.0 1.2% 3.6% 6.4% 10.3% 2.0% 37.9% 94.9%
Greater Vancouver $1,538,900 284.3 1.0% 3.2% 5.6% 9.4% -2.8% 25.5% 86.4%
Bowen Island $1,149,900 249.3 0.8% 7.7% 20.3% 19.9% 18.7% 81.6% 86.6%
Burnaby East $1,284,800 287.3 0.2% 2.2% 3.2% 10.8% 1.4% 29.5% 94.1%
Burnaby North $1,523,400 294.6 1.4% 3.1% 3.4% 10.3% -2.6% 22.5% 91.1%
Burnaby South $1,573,400 301.2 0.6% 1.2% 2.9% 5.9% -6.7% 23.2% 95.6%
Coquitlam $1,272,900 282.5 0.9% 3.5% 4.7% 10.2% -0.9% 35.7% 99.2%
Ladner $1,056,200 252.8 1.4% 5.1% 7.4% 15.3% -0.5% 20.0% 81.1%
Maple Ridge $897,900 255.8 1.5% 4.8% 5.8% 11.8% 10.2% 66.4% 98.4%
New Westminster $1,139,300 284.2 1.1% 3.7% 3.7% 11.3% -0.1% 30.6% 88.3%
North Vancouver $1,671,500 263.2 0.4% 3.5% 8.3% 11.6% -0.8% 27.1% 92.0%
Pitt Meadows $990,400 279.1 1.6% 5.0% 7.6% 13.5% 11.9% 64.9% 107.2%
Port Coquitlam $1,039,300 277.1 0.5% 4.6% 7.2% 11.6% 3.9% 43.9% 97.2%
Port Moody $1,544,300 285.2 1.9% 5.2% 6.3% 10.7% 2.9% 41.5% 103.1%
Richmond $1,580,100 306.1 -0.1% 2.2% 3.4% 6.0% -8.8% 19.9% 76.8%
Squamish $1,048,500 276.3 3.1% 6.0% 10.0% 7.1% 7.8% 68.3% 115.2%
Sunshine Coast $688,200 241.1 2.5% 7.7% 17.4% 17.0% 16.9% 79.4% 89.1%
Tsawwassen $1,173,000 261.4 1.7% 3.0% 7.8% 12.2% -2.1% 18.2% 94.2%
Vancouver East $1,533,600 337.8 1.7% 2.1% 5.9% 10.4% -0.6% 24.1% 111.8%
Vancouver West $3,122,100 315.8 0.1% 1.2% 2.7% 6.1% -12.4% 7.9% 72.0%
West Vancouver $2,741,500 258.8 -0.1% 2.6% 4.6% 7.7% -12.9% 7.5% 81.5%
Whistler $1,769,200 246.1 3.2% 5.0% 6.2% 8.2% 10.3% 61.7% 94.5%
HOW TO READ THE TABLE:
• Benchmark Price: Estimated sale price of a benchmark property. Benchmarks represent a typical property within each market.
• Price Index: Index numbers estimate the percentage change in price on typical and constant quality properties over time. All figures are based on past sales.
• x Month/Year Change %: Percentage change of index over a period of x month(s)/year(s) *
In January 2005, the indexes are set to 100.
Townhome properties are similar to Attached properties, a category that was used in the previous MLSLink HPI, but do not included duplexes.
The above info is deemed reliable, but is not guaranteed. All dollar amounts in CDN.
November 2020*
* MLS®, Multiple Listing Service®, and all related graphics are trademarks of The Canadian Real Estate Association 1 of 18
Property Type Area
Benchmark
Price
Price
Index
1 Month
Change %
3 Month
Change %
6 Month
Change %
1 Year
Change %
3 Year
Change %
5 Year
Change %
10 Year
Change %
November 2020*
Townhouse Lower Mainland $705,500 255.9 0.2% 1.1% 2.8% 5.7% 5.1% 56.4% 80.0%
Greater Vancouver $814,800 261.4 0.2% 1.0% 2.8% 5.6% 3.1% 47.9% 78.4%
Burnaby East $697,600 257.7 -1.3% -1.5% 4.2% 5.9% 6.4% 57.9% 78.0%
Burnaby North $742,900 277.3 -0.5% 1.4% 3.3% 2.0% 4.4% 50.4% 82.3%
Burnaby South $803,600 276.8 -0.3% 0.1% 3.9% 4.4% 5.7% 54.9% 81.6%
Coquitlam $702,000 257.6 0.3% 1.9% 2.1% 9.0% 6.6% 51.6% 90.5%
Ladner $640,400 229.7 0.1% -2.0% -2.1% 2.5% -8.8% 25.0% 43.6%
Maple Ridge $558,500 259.3 0.8% 0.9% 1.8% 5.5% 4.8% 74.1% 90.9%
New Westminster $755,700 277.3 -0.1% -1.2% 1.4% 5.6% 4.8% 50.6% 79.9%
North Vancouver $1,031,400 250.6 0.5% 1.6% 5.9% 10.1% 4.9% 42.5% 83.6%
Pitt Meadows $621,500 268.9 0.4% -0.7% -1.8% 5.4% 6.8% 68.5% 111.2%
Port Coquitlam $654,000 247.6 -1.3% -0.4% 1.1% 5.8% 3.0% 55.5% 78.5%
Port Moody $650,700 219.9 0.3% -0.3% 0.3% 5.2% 4.9% 32.1% 58.5%
Richmond $821,500 269.8 0.5% 1.8% 3.5% 7.8% 2.3% 41.5% 72.4%
Squamish $775,500 255.0 2.2% 8.1% 13.5% 9.5% 14.0% 71.9% 111.1%
Tsawwassen $618,300 242.4 0.2% -1.5% -2.8% 1.1% -8.6% 33.3% 48.2%
Vancouver East $901,200 286.6 -0.1% -0.2% -0.4% 3.7% -1.4% 41.2% 79.5%
Vancouver West $1,150,600 269.0 -0.7% -1.0% 2.3% 1.5% -3.8% 35.2% 78.9%
Whistler $1,011,600 243.9 3.3% 9.7% 11.4% 7.5% 15.8% 78.6% 108.6%
Apartment Lower Mainland $651,000 278.9 -0.7% -1.1% -1.0% 3.6% 4.3% 58.9% 88.1%
Greater Vancouver $676,500 270.5 -1.0% -1.3% -1.5% 3.4% 1.6% 50.9% 82.5%
Burnaby East $732,500 281.0 1.0% 1.6% -1.9% 2.0% -1.0% 52.1% 82.0%
Burnaby North $611,100 260.9 -0.6% -0.5% -2.0% 2.6% 2.8% 64.0% 88.2%
Burnaby South $658,300 264.3 -0.4% 0.3% -3.0% 1.7% -2.4% 46.8% 81.6%
Coquitlam $531,400 291.6 -0.6% 0.4% -0.5% 2.5% 7.7% 68.2% 107.2%
Ladner $508,700 237.5 -2.4% -2.7% -1.3% 2.0% -0.9% 29.8% 59.1%
Maple Ridge $367,200 262.2 -0.5% 1.3% 1.9% 5.7% 9.2% 77.2% 82.7%
New Westminster $528,600 299.5 -0.6% 0.0% 0.7% 4.1% 6.4% 69.9% 99.5%
North Vancouver $585,300 238.7 -0.6% 0.3% 1.4% 7.3% 2.7% 48.3% 69.1%
Pitt Meadows $500,800 295.3 -1.1% 0.9% 0.1% 3.8% 5.1% 78.0% 103.4%
Port Coquitlam $466,900 279.2 0.1% 0.9% 0.7% 4.2% 7.1% 78.4% 102.3%
Port Moody $656,300 273.5 1.3% 3.5% -0.7% 4.2% 5.4% 71.7% 102.9%
Richmond $651,900 279.1 -0.7% -0.9% -0.1% 3.9% 5.9% 61.1% 85.8%
Squamish $494,200 243.6 -2.6% 0.2% 3.0% -0.6% 6.0% 65.9% 87.0%
Tsawwassen $541,500 233.2 -1.3% -2.1% -1.2% 1.8% -0.9% 31.1% 57.4%
Vancouver East $585,900 329.3 -0.4% -2.5% -1.6% 3.2% -0.9% 54.1% 89.6%
Vancouver West $764,300 248.0 -2.5% -4.4% -4.6% 1.8% -5.8% 30.9% 68.1%
West Vancouver $1,092,100 221.9 -0.2% 9.0% 8.6% 6.8% -0.1% 39.9% 64.0%
Whistler $500,400 196.0 -1.7% -1.2% 4.3% 0.2% 8.8% 70.0% 53.6%
HOW TO READ THE TABLE:
• Benchmark Price: Estimated sale price of a benchmark property. Benchmarks represent a typical property within each market.
• Price Index: Index numbers estimate the percentage change in price on typical and constant quality properties over time. All figures are based on past sales.
• x Month/Year Change %: Percentage change of index over a period of x month(s)/year(s)
In January 2005, the indexes are set to 100. *
Townhome properties are similar to attached properties, a category that was used in the previous MLSLink HPI, but do not included duplexes.
Lower Mainland includes areas serviced by both Real Estate Board of Greater Vancouver & Fraser Valley Real Estate Board.
The above info is deemed reliable, but is not guaranteed. All dollar amounts in CDN.
* MLS®, Multiple Listing Service®, and all related graphics are trademarks of The Canadian Real Estate Association 2 of 18
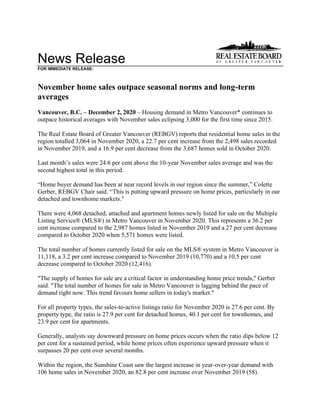
C:DATAMonthEndHpiexporthi_resgv-hpi2.tifGreaterVancouver
5YearTrend
60
110
160
210
260
310
Nov 2015
Jan 2016
Mar 2016
May 2016
Jul 2016
Sep 2016
Nov 2016
Jan 2017
Mar 2017
May 2017
Jul 2017
Sep 2017
Nov 2017
Jan 2018
Mar 2018
May 2018
Jul 2018
Sep 2018
Nov 2018
Jan 2019
Mar 2019
May 2019
Jul 2019
Sep 2019
Nov 2019
Jan 2020
Mar 2020
May 2020
Jul 2020
Sep 2020
Nov 2020
Price
Index
ResidentialDetachedTownhouseApartment
Jan2005HPI=100
11272020MLS®
SALESFacts
Burnaby
Coquitlam
Delta-South
Islands-Gulf
MapleRidge/PittMeadows
NewWestminster
NorthVancouver
PortCoquitlam
PortMoody/Belcarra
Richmond
Squamish
SunshineCoast
VancouverEast
VancouverWest
WestVancouver/HoweSound
Whistler/Pemberton
Detached93925411114299435218829831379562241,061
Attached645931065273926198828176660637632
Apartment1931081704081128402615725616131520541,371
Detached$1,535,000$1,370,000$1,190,000n/a$958,000$1,148,000$1,792,000$1,100,000$1,406,092$1,577,500$1,289,000$797,450$1,560,000$2,985,000$2,860,000$1,950,000
Attached$831,200$858,900$665,000n/a$569,000$735,000$1,049,000$687,000n/a$865,000$733,000n/a$1,139,286$1,302,500n/a$1,165,000n/a
Apartment$585,500$530,750n/an/a$419,500$520,000$690,000$425,500$582,500$535,500$516,000n/a$580,000$755,000$1,075,000$504,750
Detached981298881703612836251073810415111174321,335
Attached828918187216238319532206670763782
Apartment214129250571111424636178211417436522361,570
Detached$1,600,000$1,358,800$1,210,250n/a$961,000$1,216,000$1,757,500$1,050,000$1,315,000$1,580,000$1,059,676$722,000$1,590,000$3,000,000$2,891,500$2,200,000
Attached$887,500$850,000n/an/a$575,000$739,900$1,093,500$706,000$843,500$866,000$719,950$439,750$1,165,000$1,332,500n/a$1,200,000n/a
Apartment$581,750$518,000$543,000n/a$400,000$519,750$674,000$468,000$605,000$535,000$493,000n/a$590,000$760,000$1,265,000$445,250
Detached788937210923782812671747106655215825
Attached46402204312382014681795634230451
Apartment211771903688100421713612214530512201,222
Detached$1,399,500$1,140,000$965,000n/a$859,250$1,080,000$1,582,900$994,500n/a$1,650,000n/a$647,500$1,467,500$2,895,000$2,428,572n/a
Attached$739,400$769,950$734,400n/a$515,000n/a$965,000$715,400n/a$787,500n/an/a$999,999$1,238,500n/a$1,149,500n/a
Apartment$584,500$525,000n/an/a$372,950$506,400$629,000$434,500n/a$536,000n/an/a$560,000$775,000n/a$540,500
Detached750888548681,2312498963461978532327101,1848455021949,693
Attached5635521874690186418268209815199112508537492775,574
Apartment1,69998120704288501,0913732771,503157741,4353,10314026612,584
Detached$1,524,500$1,300,000$1,134,250$590,000$920,000$1,200,000$1,705,500$997,000$1,367,400$1,555,000$1,147,000$698,500$1,550,000$3,050,000$2,550,000$1,892,500
Attached$811,750$835,000$708,800n/a$556,250$729,900$1,055,000$694,000$800,000$848,375$710,000$480,000$1,140,000$1,300,000$1,560,000$1,168,000n/a
Apartment$586,000$519,000$510,000n/a$395,000$515,000$649,000$450,000$600,500$545,000$475,000$400,000$608,000$755,000$1,045,000$464,950
Detached638759336459451997482731337321964709266934061177,616
Attached52241113915039634523513859616365426462331904,325
Apartment1,59683216803668429223552391,284117661,2722,99711022811,394
Detached$1,410,000$1,187,000$998,444$566,000$835,000$1,088,000$1,550,000$915,000$1,228,000$1,474,000$983,500$622,000$1,393,500$2,850,000$2,398,000$1,850,000
Attached$759,620$768,900$688,000n/a$522,000$710,000$985,000$655,000$738,500$786,000$686,000$445,000$996,000$1,280,000$1,700,000$1,010,000n/a
Apartment$578,000$520,000$500,062n/a$358,750$495,500$618,700$411,000$565,000$530,000$442,000$432,400$560,000$749,000$1,030,000$491,250
Note:MedianSellingPricesarenotreportedforareaswithlessthan20salesorfortheGulfIslands
Median
Selling
Price
Number
of
Sales
Median
Selling
Price
October
2020
November
2019
Jan.-
Nov.2020
Jan.-
Nov.2019
Median
Selling
Price
Number
of
Sales
Median
Selling
Price
Number
of
Sales
November
2020
Number
of
Sales
Median
Selling
Price
Number
of
Sales
November
2020
Year-to-date
Year-to-date
11272020MLS®
LISTINGSFacts
Burnaby
Coquitlam
Delta-South
Islands-Gulf
MapleRidge/PittMeadows
NewWestminster
NorthVancouver
PortCoquitlam
PortMoody/Belcarra
Richmond
Squamish
SunshineCoast
VancouverEast
VancouverWest
WestVancouver/HoweSound
Whistler/Pemberton
Detached106120587127211032928131206216414173191,209
Attached907427059236621141092016951021236764
Apartment28617329049120164694027933421855724502,095
Detached88%77%93%157%90%138%91%121%75%67%145%134%84%67%85%126%
Attached71%80%115%n/a110%117%59%124%136%81%140%106%69%59%50%103%n/a
Apartment67%62%59%n/a82%68%78%58%65%56%76%150%74%57%83%108%
Detached16414075111735014740361803975234196142301,732
Attached9883280763767352613234191191332338948
Apartment380223320801812289860307211833285039422,891
Detached60%92%117%73%98%72%87%90%69%59%97%139%65%57%52%107%
Attached84%107%64%n/a114%57%93%109%119%72%94%105%55%53%30%166%n/a
Apartment56%58%78%n/a71%61%62%47%60%58%100%78%52%43%56%86%
Detached8581401112520814013139205111812393261,066
Attached73472405114433015762485862523553
Apartment181853104863975218168191615938216331,368
Detached92%110%93%18%87%115%96%70%92%48%85%92%90%53%56%58%
Attached63%85%92%n/a84%86%88%67%93%89%71%113%97%55%40%130%n/a
Apartment117%91%61%n/a75%140%103%81%94%81%63%13%91%80%75%61%
Detached1,3801,425880981,7574161,5464613741,7293919332,0581,7591,26030516,772
Attached1,01785029698823037543942961,3002671601,0281,1751503709,251
Apartment3,4651,88141277541,5642,2016845102,8982731092,8477,41141444325,873
Detached54%62%62%69%70%60%58%75%53%49%59%76%58%48%40%64%
Attached55%65%63%44%78%61%55%68%71%63%75%70%49%46%33%75%n/a
Apartment49%52%50%0%57%54%50%55%54%52%58%68%50%42%34%60%
Detached1,5101,717861931,9194311,5695293372,2113569511,9632,0171,45425718,175
Attached1,16879827458042117244332591,4812551588241,2261383339,091
Apartment3,0191,60338616551,4971,8946843672,8322281642,3836,58439337423,064
Detached42%44%39%48%49%46%48%52%39%33%55%49%47%34%28%46%
Attached45%52%51%20%63%45%48%54%53%40%64%41%52%38%24%57%n/a
Apartment53%52%44%0%56%56%49%52%65%45%51%40%53%46%28%61%
*Year-to-datelistingsrepresentacumulativetotaloflistingsratherthantotalactivelistings.
Number
of
Listings
November
2020
Number
of
Listings
%Salesto
Listings
Number
of
Listings
%Salesto
Listings
Number
of
Listings
%Salesto
Listings
October
2020
November
2019
Jan.-
Nov.2020
Jan.-
Nov.2019
%Salesto
Listings
Number
of
Listings
%Salesto
Listings
November
2020
Year-to-date*
Year-to-date*
Listing & Sales Activity Summary
Listings Sales
1 2 3 Col. 2 & 3 5 6 7 Col. 6 & 7 9 10 Col. 9 & 10
Nov Oct Nov Percentage Nov Oct Nov Percentage Sep 2019 - Sep 2020 - Percentage
2019 2020 2020 Variance 2019 2020 2020 Variance Nov 2019 Nov 2020 Variance
BURNABY % % %
DETACHED 85 164 106 -35.4 78 98 93 -5.1 227 292 28.6
ATTACHED 73 98 90 -8.2 46 82 64 -22.0 160 227 41.9
APARTMENTS 181 380 286 -24.7 211 214 193 -9.8 572 628 9.8
COQUITLAM
DETACHED 81 140 120 -14.3 89 129 92 -28.7 266 348 30.8
ATTACHED 47 83 74 -10.8 40 89 59 -33.7 139 218 56.8
APARTMENTS 85 223 173 -22.4 77 129 108 -16.3 267 346 29.6
DELTA
DETACHED 40 75 58 -22.7 37 88 54 -38.6 105 218 107.6
ATTACHED 24 28 27 -3.6 22 18 31 72.2 41 74 80.5
APARTMENTS 31 32 29 -9.4 19 25 17 -32.0 52 71 36.5
MAPLE RIDGE/PITT MEADOWS
DETACHED 125 173 127 -26.6 109 170 114 -32.9 331 448 35.3
ATTACHED 51 76 59 -22.4 43 87 65 -25.3 144 239 66.0
APARTMENTS 48 80 49 -38.8 36 57 40 -29.8 109 145 33.0
NORTH VANCOUVER
DETACHED 81 147 103 -29.9 78 128 94 -26.6 226 355 57.1
ATTACHED 43 67 66 -1.5 38 62 39 -37.1 108 149 38.0
APARTMENTS 97 228 164 -28.1 100 142 128 -9.9 308 410 33.1
NEW WESTMINSTER
DETACHED 20 50 21 -58.0 23 36 29 -19.4 68 94 38.2
ATTACHED 14 37 23 -37.8 12 21 27 28.6 36 84 133.3
APARTMENTS 63 181 120 -33.7 88 111 81 -27.0 265 298 12.5
PORT MOODY/BELCARRA
DETACHED 13 36 28 -22.2 12 25 21 -16.0 38 68 78.9
ATTACHED 15 26 14 -46.2 14 31 19 -38.7 51 82 60.8
APARTMENTS 18 60 40 -33.3 17 36 26 -27.8 66 96 45.5
PORT COQUITLAM
DETACHED 40 40 29 -27.5 28 36 35 -2.8 76 117 53.9
ATTACHED 30 35 21 -40.0 20 38 26 -31.6 73 93 27.4
APARTMENTS 52 98 69 -29.6 42 46 40 -13.0 124 124 0.0
RICHMOND
DETACHED 139 180 131 -27.2 67 107 88 -17.8 247 307 24.3
ATTACHED 76 132 109 -17.4 68 95 88 -7.4 230 279 21.3
APARTMENTS 168 307 279 -9.1 136 178 157 -11.8 421 537 27.6
SUNSHINE COAST
DETACHED 51 75 62 -17.3 47 104 83 -20.2 145 279 92.4
ATTACHED 8 19 16 -15.8 9 20 17 -15.0 19 57 200.0
APARTMENTS 16 18 4 -77.8 2 14 6 -57.1 12 33 175.0
SQUAMISH
DETACHED 20 39 20 -48.7 17 38 29 -23.7 63 94 49.2
ATTACHED 24 34 20 -41.2 17 32 28 -12.5 54 89 64.8
APARTMENTS 19 21 33 57.1 12 21 25 19.0 42 62 47.6
VANCOUVER EAST
DETACHED 118 234 164 -29.9 106 151 137 -9.3 323 459 42.1
ATTACHED 58 119 95 -20.2 56 66 66 0.0 138 206 49.3
APARTMENTS 159 332 218 -34.3 145 174 161 -7.5 454 532 17.2
VANCOUVER WEST
DETACHED 123 196 141 -28.1 65 111 95 -14.4 204 310 52.0
ATTACHED 62 133 102 -23.3 34 70 60 -14.3 136 185 36.0
APARTMENTS 382 850 557 -34.5 305 365 315 -13.7 971 1057 8.9
WHISTLER/PEMBERTON
DETACHED 26 30 19 -36.7 15 32 24 -25.0 43 94 118.6
ATTACHED 23 38 36 -5.3 30 63 37 -41.3 69 137 98.6
APARTMENTS 33 42 50 19.0 20 36 54 50.0 73 134 83.6
WEST VANCOUVER/HOWE SOUND
DETACHED 93 142 73 -48.6 52 74 62 -16.2 133 200 50.4
ATTACHED 5 23 12 -47.8 2 7 6 -14.3 11 24 118.2
APARTMENTS 16 39 24 -38.5 12 22 20 -9.1 36 64 77.8
GRAND TOTALS
DETACHED 1055 1721 1202 -30.2 823 1327 1050 -20.9 2495 3683 47.6
ATTACHED 553 948 764 -19.4 451 781 632 -19.1 1409 2143 52.1
APARTMENTS 1368 2891 2095 -27.5 1222 1570 1371 -12.7 3772 4537 20.3
ResidentialAverageSalePrices-January1977toNovember2020
0
200
400
600
800
1000
1200
1400
1600
1800
2000
1977
1978
1979
1980
1981
1982
1983
1984
1985
1986
1987
1988
1989
1990
1991
1992
1993
1994
1995
1996
1997
1998
1999
2000
2001
2002
2003
2004
2005
2006
2007
2008
2009
2010
2011
2012
2013
2014
2015
2016
2017
2018
2019
2020
DETACHEDCONDOMINIUMATTACHEDAPARTMENTS
INTHOUSANDS($)
NOTE:From1977-1984condominiumaverageswerenotseparatedintoattached&apartment.
$933,676
$656,776
$1,747,209

More Related Content

What's hot

REBGV Statistics Package April 2021
REBGV Statistics Package April 2021REBGV Statistics Package April 2021
REBGV Statistics Package April 2021Vicky Aulakh
 
REBGV Statistics Package August 2020
REBGV Statistics Package August 2020REBGV Statistics Package August 2020
REBGV Statistics Package August 2020Vicky Aulakh
 
Rebgv stats-pkg-july-2019
Rebgv stats-pkg-july-2019Rebgv stats-pkg-july-2019
Rebgv stats-pkg-july-2019Vicky Aulakh
 
Real Estate Board of Greater Vancouver Statistics Package July 2021
Real Estate Board of Greater Vancouver Statistics Package July 2021Real Estate Board of Greater Vancouver Statistics Package July 2021
Real Estate Board of Greater Vancouver Statistics Package July 2021Vicky Aulakh
 
May 2021 Real Estate Board of Greater Vancouver Statistics Package
May 2021 Real Estate Board of Greater Vancouver Statistics PackageMay 2021 Real Estate Board of Greater Vancouver Statistics Package
May 2021 Real Estate Board of Greater Vancouver Statistics PackageVicky Aulakh
 
REBGV Statistics Package October 2020
REBGV Statistics Package October 2020REBGV Statistics Package October 2020
REBGV Statistics Package October 2020Vicky Aulakh
 
2021 June - REBGV Statistics Package
2021 June - REBGV Statistics Package2021 June - REBGV Statistics Package
2021 June - REBGV Statistics PackageVicky Aulakh
 
Rebgv stats-pkg-april-2019
Rebgv stats-pkg-april-2019Rebgv stats-pkg-april-2019
Rebgv stats-pkg-april-2019Kathryn Huang
 
Rebgv stats-pkg-june-2019
Rebgv stats-pkg-june-2019Rebgv stats-pkg-june-2019
Rebgv stats-pkg-june-2019Vicky Aulakh
 
REBGV Statistics Package May 2020
REBGV Statistics Package May 2020REBGV Statistics Package May 2020
REBGV Statistics Package May 2020Vicky Aulakh
 
REBGV Statistic Package December 2020
REBGV Statistic Package December 2020REBGV Statistic Package December 2020
REBGV Statistic Package December 2020Vicky Aulakh
 
Metro Vancouver Statistics September 2021
Metro Vancouver Statistics September 2021 Metro Vancouver Statistics September 2021
Metro Vancouver Statistics September 2021 VickyAulakh1
 
Real Estate Board of Greater Vancouver Statistics Package August 2021
Real Estate Board of Greater Vancouver Statistics Package August 2021Real Estate Board of Greater Vancouver Statistics Package August 2021
Real Estate Board of Greater Vancouver Statistics Package August 2021Vicky Aulakh
 
REBGV Statistics package July 2020
REBGV Statistics package July 2020REBGV Statistics package July 2020
REBGV Statistics package July 2020Vicky Aulakh
 
Rebgv stats-pkg-may-2019
Rebgv stats-pkg-may-2019Rebgv stats-pkg-may-2019
Rebgv stats-pkg-may-2019Kathryn Huang
 
VREB October 2020 Statistics Package
VREB October 2020 Statistics PackageVREB October 2020 Statistics Package
VREB October 2020 Statistics PackageVicky Aulakh
 
Rebgv Stats Package September 2020
Rebgv Stats Package September 2020Rebgv Stats Package September 2020
Rebgv Stats Package September 2020Vicky Aulakh
 

What's hot (17)

REBGV Statistics Package April 2021
REBGV Statistics Package April 2021REBGV Statistics Package April 2021
REBGV Statistics Package April 2021
 
REBGV Statistics Package August 2020
REBGV Statistics Package August 2020REBGV Statistics Package August 2020
REBGV Statistics Package August 2020
 
Rebgv stats-pkg-july-2019
Rebgv stats-pkg-july-2019Rebgv stats-pkg-july-2019
Rebgv stats-pkg-july-2019
 
Real Estate Board of Greater Vancouver Statistics Package July 2021
Real Estate Board of Greater Vancouver Statistics Package July 2021Real Estate Board of Greater Vancouver Statistics Package July 2021
Real Estate Board of Greater Vancouver Statistics Package July 2021
 
May 2021 Real Estate Board of Greater Vancouver Statistics Package
May 2021 Real Estate Board of Greater Vancouver Statistics PackageMay 2021 Real Estate Board of Greater Vancouver Statistics Package
May 2021 Real Estate Board of Greater Vancouver Statistics Package
 
REBGV Statistics Package October 2020
REBGV Statistics Package October 2020REBGV Statistics Package October 2020
REBGV Statistics Package October 2020
 
2021 June - REBGV Statistics Package
2021 June - REBGV Statistics Package2021 June - REBGV Statistics Package
2021 June - REBGV Statistics Package
 
Rebgv stats-pkg-april-2019
Rebgv stats-pkg-april-2019Rebgv stats-pkg-april-2019
Rebgv stats-pkg-april-2019
 
Rebgv stats-pkg-june-2019
Rebgv stats-pkg-june-2019Rebgv stats-pkg-june-2019
Rebgv stats-pkg-june-2019
 
REBGV Statistics Package May 2020
REBGV Statistics Package May 2020REBGV Statistics Package May 2020
REBGV Statistics Package May 2020
 
REBGV Statistic Package December 2020
REBGV Statistic Package December 2020REBGV Statistic Package December 2020
REBGV Statistic Package December 2020
 
Metro Vancouver Statistics September 2021
Metro Vancouver Statistics September 2021 Metro Vancouver Statistics September 2021
Metro Vancouver Statistics September 2021
 
Real Estate Board of Greater Vancouver Statistics Package August 2021
Real Estate Board of Greater Vancouver Statistics Package August 2021Real Estate Board of Greater Vancouver Statistics Package August 2021
Real Estate Board of Greater Vancouver Statistics Package August 2021
 
REBGV Statistics package July 2020
REBGV Statistics package July 2020REBGV Statistics package July 2020
REBGV Statistics package July 2020
 
Rebgv stats-pkg-may-2019
Rebgv stats-pkg-may-2019Rebgv stats-pkg-may-2019
Rebgv stats-pkg-may-2019
 
VREB October 2020 Statistics Package
VREB October 2020 Statistics PackageVREB October 2020 Statistics Package
VREB October 2020 Statistics Package
 
Rebgv Stats Package September 2020
Rebgv Stats Package September 2020Rebgv Stats Package September 2020
Rebgv Stats Package September 2020
 

Similar to Real Estate Board of Greater Vancouver Statistics Package November 2020

Real Estate Board of Greater Vancouver Statistics Package - November 2021
Real Estate Board of Greater Vancouver Statistics Package - November 2021Real Estate Board of Greater Vancouver Statistics Package - November 2021
Real Estate Board of Greater Vancouver Statistics Package - November 2021VickyAulakh1
 
REBGV January 2020 Statistics Package
REBGV January 2020 Statistics Package REBGV January 2020 Statistics Package
REBGV January 2020 Statistics Package Vicky Aulakh
 
Rebgv stats-pkg-february-2018
Rebgv stats-pkg-february-2018Rebgv stats-pkg-february-2018
Rebgv stats-pkg-february-2018Kathryn Huang
 
Rebgv stats-pkg-november-2019-f
Rebgv stats-pkg-november-2019-fRebgv stats-pkg-november-2019-f
Rebgv stats-pkg-november-2019-fVicky Aulakh
 
Real Estate Board of Greater Vancouver Statistics Package October 2021
Real Estate Board of Greater Vancouver Statistics Package October 2021Real Estate Board of Greater Vancouver Statistics Package October 2021
Real Estate Board of Greater Vancouver Statistics Package October 2021VickyAulakh1
 
May-2019 Stats Package for Greater Vancouver
May-2019 Stats Package for Greater VancouverMay-2019 Stats Package for Greater Vancouver
May-2019 Stats Package for Greater VancouverBC PRIME Realty
 
Rebgv stats-pkg-september-2018
Rebgv stats-pkg-september-2018Rebgv stats-pkg-september-2018
Rebgv stats-pkg-september-2018Kathryn Huang
 
Real Estate Board of Greater Vancouver Statistics Package January 2021
Real Estate Board of Greater Vancouver Statistics Package January 2021 Real Estate Board of Greater Vancouver Statistics Package January 2021
Real Estate Board of Greater Vancouver Statistics Package January 2021 Vicky Aulakh
 
Rebgv stats-pkg-february-2019
Rebgv stats-pkg-february-2019Rebgv stats-pkg-february-2019
Rebgv stats-pkg-february-2019Sherryl Jacobs
 
REBGV-Stats-Pkg-July-2022
REBGV-Stats-Pkg-July-2022REBGV-Stats-Pkg-July-2022
REBGV-Stats-Pkg-July-2022Vicky Aulakh
 
Rebgv stats-pkg-april-2020
Rebgv stats-pkg-april-2020Rebgv stats-pkg-april-2020
Rebgv stats-pkg-april-2020Vicky Aulakh
 
Real Estate Board of Greater Vancouver Statistics Package February 2022
Real Estate Board of Greater Vancouver Statistics Package February 2022Real Estate Board of Greater Vancouver Statistics Package February 2022
Real Estate Board of Greater Vancouver Statistics Package February 2022Vicky Aulakh
 
Rebgv stats-pkg-january-2019
Rebgv stats-pkg-january-2019Rebgv stats-pkg-january-2019
Rebgv stats-pkg-january-2019Kathryn Huang
 
Rebgv stats-pkg-november-2018
Rebgv stats-pkg-november-2018Rebgv stats-pkg-november-2018
Rebgv stats-pkg-november-2018Kathryn Huang
 
201807 rebgv-stats-package-for-media
201807 rebgv-stats-package-for-media201807 rebgv-stats-package-for-media
201807 rebgv-stats-package-for-mediaKathryn Huang
 
October 2016 REBGV Statistics Package Vancouver BC Mike Stewart Realtor
October 2016 REBGV Statistics Package Vancouver BC Mike Stewart RealtorOctober 2016 REBGV Statistics Package Vancouver BC Mike Stewart Realtor
October 2016 REBGV Statistics Package Vancouver BC Mike Stewart RealtorMike Stewart
 
March 2020 REBGV Statistics Package
March 2020 REBGV Statistics PackageMarch 2020 REBGV Statistics Package
March 2020 REBGV Statistics PackageMike Stewart
 
March 2020-rebgv-stats-pkg
March 2020-rebgv-stats-pkgMarch 2020-rebgv-stats-pkg
March 2020-rebgv-stats-pkgMatt Scalena
 

Similar to Real Estate Board of Greater Vancouver Statistics Package November 2020 (20)

Real Estate Board of Greater Vancouver Statistics Package - November 2021
Real Estate Board of Greater Vancouver Statistics Package - November 2021Real Estate Board of Greater Vancouver Statistics Package - November 2021
Real Estate Board of Greater Vancouver Statistics Package - November 2021
 
Rebgv stats-pkg-august-2021
Rebgv stats-pkg-august-2021Rebgv stats-pkg-august-2021
Rebgv stats-pkg-august-2021
 
REBGV January 2020 Statistics Package
REBGV January 2020 Statistics Package REBGV January 2020 Statistics Package
REBGV January 2020 Statistics Package
 
Rebgv stats-pkg-february-2018
Rebgv stats-pkg-february-2018Rebgv stats-pkg-february-2018
Rebgv stats-pkg-february-2018
 
Rebgv stats-pkg-october-2020
Rebgv stats-pkg-october-2020Rebgv stats-pkg-october-2020
Rebgv stats-pkg-october-2020
 
Rebgv stats-pkg-november-2019-f
Rebgv stats-pkg-november-2019-fRebgv stats-pkg-november-2019-f
Rebgv stats-pkg-november-2019-f
 
Real Estate Board of Greater Vancouver Statistics Package October 2021
Real Estate Board of Greater Vancouver Statistics Package October 2021Real Estate Board of Greater Vancouver Statistics Package October 2021
Real Estate Board of Greater Vancouver Statistics Package October 2021
 
May-2019 Stats Package for Greater Vancouver
May-2019 Stats Package for Greater VancouverMay-2019 Stats Package for Greater Vancouver
May-2019 Stats Package for Greater Vancouver
 
Rebgv stats-pkg-september-2018
Rebgv stats-pkg-september-2018Rebgv stats-pkg-september-2018
Rebgv stats-pkg-september-2018
 
Real Estate Board of Greater Vancouver Statistics Package January 2021
Real Estate Board of Greater Vancouver Statistics Package January 2021 Real Estate Board of Greater Vancouver Statistics Package January 2021
Real Estate Board of Greater Vancouver Statistics Package January 2021
 
Rebgv stats-pkg-february-2019
Rebgv stats-pkg-february-2019Rebgv stats-pkg-february-2019
Rebgv stats-pkg-february-2019
 
REBGV-Stats-Pkg-July-2022
REBGV-Stats-Pkg-July-2022REBGV-Stats-Pkg-July-2022
REBGV-Stats-Pkg-July-2022
 
Rebgv stats-pkg-april-2020
Rebgv stats-pkg-april-2020Rebgv stats-pkg-april-2020
Rebgv stats-pkg-april-2020
 
Real Estate Board of Greater Vancouver Statistics Package February 2022
Real Estate Board of Greater Vancouver Statistics Package February 2022Real Estate Board of Greater Vancouver Statistics Package February 2022
Real Estate Board of Greater Vancouver Statistics Package February 2022
 
Rebgv stats-pkg-january-2019
Rebgv stats-pkg-january-2019Rebgv stats-pkg-january-2019
Rebgv stats-pkg-january-2019
 
Rebgv stats-pkg-november-2018
Rebgv stats-pkg-november-2018Rebgv stats-pkg-november-2018
Rebgv stats-pkg-november-2018
 
201807 rebgv-stats-package-for-media
201807 rebgv-stats-package-for-media201807 rebgv-stats-package-for-media
201807 rebgv-stats-package-for-media
 
October 2016 REBGV Statistics Package Vancouver BC Mike Stewart Realtor
October 2016 REBGV Statistics Package Vancouver BC Mike Stewart RealtorOctober 2016 REBGV Statistics Package Vancouver BC Mike Stewart Realtor
October 2016 REBGV Statistics Package Vancouver BC Mike Stewart Realtor
 
March 2020 REBGV Statistics Package
March 2020 REBGV Statistics PackageMarch 2020 REBGV Statistics Package
March 2020 REBGV Statistics Package
 
March 2020-rebgv-stats-pkg
March 2020-rebgv-stats-pkgMarch 2020-rebgv-stats-pkg
March 2020-rebgv-stats-pkg
 

More from Vicky Aulakh

Okanagan Statistics May2023.pdf
Okanagan Statistics May2023.pdfOkanagan Statistics May2023.pdf
Okanagan Statistics May2023.pdfVicky Aulakh
 
FVREB May 2023 Statistics Package.pdf
FVREB May 2023 Statistics Package.pdfFVREB May 2023 Statistics Package.pdf
FVREB May 2023 Statistics Package.pdfVicky Aulakh
 
Metro Vancouver Stats.pdf
Metro Vancouver Stats.pdfMetro Vancouver Stats.pdf
Metro Vancouver Stats.pdfVicky Aulakh
 
Okanagan Stats June 2022
Okanagan Stats June 2022Okanagan Stats June 2022
Okanagan Stats June 2022Vicky Aulakh
 
Okanagan Stats May 2022
Okanagan Stats May 2022Okanagan Stats May 2022
Okanagan Stats May 2022Vicky Aulakh
 
VREB June 2022 Stats
VREB June 2022 StatsVREB June 2022 Stats
VREB June 2022 StatsVicky Aulakh
 
FVREB June 2022 Stats
FVREB June 2022 StatsFVREB June 2022 Stats
FVREB June 2022 StatsVicky Aulakh
 
REBGV Statistics Package May 2022
REBGV Statistics Package May 2022REBGV Statistics Package May 2022
REBGV Statistics Package May 2022Vicky Aulakh
 
VREB May 2022 Statistics Package.pdf
VREB May 2022 Statistics Package.pdfVREB May 2022 Statistics Package.pdf
VREB May 2022 Statistics Package.pdfVicky Aulakh
 
The Okanagan Real Estate April 2022 Statistics
The Okanagan Real Estate April 2022 StatisticsThe Okanagan Real Estate April 2022 Statistics
The Okanagan Real Estate April 2022 StatisticsVicky Aulakh
 
FVREB April 2022 Stats Package .pdf
FVREB April 2022 Stats Package .pdfFVREB April 2022 Stats Package .pdf
FVREB April 2022 Stats Package .pdfVicky Aulakh
 
VREB April 2022 Stats Package .pdf
VREB April 2022 Stats Package .pdfVREB April 2022 Stats Package .pdf
VREB April 2022 Stats Package .pdfVicky Aulakh
 
REBGV-Stats-Pkg-April-2022.pdf
REBGV-Stats-Pkg-April-2022.pdfREBGV-Stats-Pkg-April-2022.pdf
REBGV-Stats-Pkg-April-2022.pdfVicky Aulakh
 
March 2022 Okanagan Statistics
March 2022 Okanagan StatisticsMarch 2022 Okanagan Statistics
March 2022 Okanagan StatisticsVicky Aulakh
 
FVREB Statistics Package March 2022
FVREB Statistics Package March 2022FVREB Statistics Package March 2022
FVREB Statistics Package March 2022Vicky Aulakh
 

More from Vicky Aulakh (20)

Okanagan Statistics May2023.pdf
Okanagan Statistics May2023.pdfOkanagan Statistics May2023.pdf
Okanagan Statistics May2023.pdf
 
FVREB May 2023 Statistics Package.pdf
FVREB May 2023 Statistics Package.pdfFVREB May 2023 Statistics Package.pdf
FVREB May 2023 Statistics Package.pdf
 
Metro Vancouver Stats.pdf
Metro Vancouver Stats.pdfMetro Vancouver Stats.pdf
Metro Vancouver Stats.pdf
 
FVREB July 2022
FVREB July 2022FVREB July 2022
FVREB July 2022
 
VREB July 2022
VREB July 2022VREB July 2022
VREB July 2022
 
BCRE June 2022
BCRE June 2022BCRE June 2022
BCRE June 2022
 
Okanagan Stats June 2022
Okanagan Stats June 2022Okanagan Stats June 2022
Okanagan Stats June 2022
 
Okanagan Stats May 2022
Okanagan Stats May 2022Okanagan Stats May 2022
Okanagan Stats May 2022
 
VREB June 2022 Stats
VREB June 2022 StatsVREB June 2022 Stats
VREB June 2022 Stats
 
FVREB June 2022 Stats
FVREB June 2022 StatsFVREB June 2022 Stats
FVREB June 2022 Stats
 
FVREB May 2022
FVREB May 2022FVREB May 2022
FVREB May 2022
 
REBGV Statistics Package May 2022
REBGV Statistics Package May 2022REBGV Statistics Package May 2022
REBGV Statistics Package May 2022
 
VREB May 2022 Statistics Package.pdf
VREB May 2022 Statistics Package.pdfVREB May 2022 Statistics Package.pdf
VREB May 2022 Statistics Package.pdf
 
The Okanagan Real Estate April 2022 Statistics
The Okanagan Real Estate April 2022 StatisticsThe Okanagan Real Estate April 2022 Statistics
The Okanagan Real Estate April 2022 Statistics
 
FVREB April 2022 Stats Package .pdf
FVREB April 2022 Stats Package .pdfFVREB April 2022 Stats Package .pdf
FVREB April 2022 Stats Package .pdf
 
VREB April 2022 Stats Package .pdf
VREB April 2022 Stats Package .pdfVREB April 2022 Stats Package .pdf
VREB April 2022 Stats Package .pdf
 
REBGV-Stats-Pkg-April-2022.pdf
REBGV-Stats-Pkg-April-2022.pdfREBGV-Stats-Pkg-April-2022.pdf
REBGV-Stats-Pkg-April-2022.pdf
 
BCREA.pdf
BCREA.pdfBCREA.pdf
BCREA.pdf
 
March 2022 Okanagan Statistics
March 2022 Okanagan StatisticsMarch 2022 Okanagan Statistics
March 2022 Okanagan Statistics
 
FVREB Statistics Package March 2022
FVREB Statistics Package March 2022FVREB Statistics Package March 2022
FVREB Statistics Package March 2022
 

Recently uploaded

Call Girls in Janakpuri ↫8447779280↫Short 1500 Night 6000-Escorts Service In ...
Call Girls in Janakpuri ↫8447779280↫Short 1500 Night 6000-Escorts Service In ...Call Girls in Janakpuri ↫8447779280↫Short 1500 Night 6000-Escorts Service In ...
Call Girls in Janakpuri ↫8447779280↫Short 1500 Night 6000-Escorts Service In ...asmaqueen5
 
Low Rate Call Girls in Tughlakabad Delhi Call 9990771857
Low Rate Call Girls in Tughlakabad Delhi Call 9990771857Low Rate Call Girls in Tughlakabad Delhi Call 9990771857
Low Rate Call Girls in Tughlakabad Delhi Call 9990771857delhimodel235
 
Shapoorji Pallonji Parkwest Sequoia Tower Bangalore.pdf
Shapoorji Pallonji Parkwest Sequoia Tower Bangalore.pdfShapoorji Pallonji Parkwest Sequoia Tower Bangalore.pdf
Shapoorji Pallonji Parkwest Sequoia Tower Bangalore.pdfashiyadav24
 
Call Girls in laxmi Nagar Delhi 💯Call Us 🔝 9582086666🔝 South Delhi Escorts Se...
Call Girls in laxmi Nagar Delhi 💯Call Us 🔝 9582086666🔝 South Delhi Escorts Se...Call Girls in laxmi Nagar Delhi 💯Call Us 🔝 9582086666🔝 South Delhi Escorts Se...
Call Girls in laxmi Nagar Delhi 💯Call Us 🔝 9582086666🔝 South Delhi Escorts Se...delhimodel235
 
call girls in ganesh nagar Delhi 8264348440 ✅ call girls ❤️
call girls in ganesh nagar Delhi 8264348440 ✅ call girls ❤️call girls in ganesh nagar Delhi 8264348440 ✅ call girls ❤️
call girls in ganesh nagar Delhi 8264348440 ✅ call girls ❤️soniya singh
 
9990771857 Call Girls in Noida Sector 06 Noida (Call Girls) Delhi
9990771857 Call Girls in Noida Sector 06 Noida (Call Girls) Delhi9990771857 Call Girls in Noida Sector 06 Noida (Call Girls) Delhi
9990771857 Call Girls in Noida Sector 06 Noida (Call Girls) Delhidelhimodel235
 
9990771857 Call Girls in Noida Sector 03 Noida (Call Girls) Delhi
9990771857 Call Girls in Noida Sector 03 Noida (Call Girls) Delhi9990771857 Call Girls in Noida Sector 03 Noida (Call Girls) Delhi
9990771857 Call Girls in Noida Sector 03 Noida (Call Girls) Delhidelhimodel235
 
Call Girls in Nehru Place Delhi 💯Call Us 🔝8264348440🔝
Call Girls in Nehru Place Delhi 💯Call Us 🔝8264348440🔝Call Girls in Nehru Place Delhi 💯Call Us 🔝8264348440🔝
Call Girls in Nehru Place Delhi 💯Call Us 🔝8264348440🔝soniya singh
 
9711199012 Call {Girls Delhi} Very Low rate Vaishali DownLoad PDF
9711199012 Call {Girls Delhi} Very Low rate Vaishali DownLoad PDF9711199012 Call {Girls Delhi} Very Low rate Vaishali DownLoad PDF
9711199012 Call {Girls Delhi} Very Low rate Vaishali DownLoad PDFMs Riya
 
9990771857 Call Girls in Noida Sector 10 Noida (Call Girls) Delhi
9990771857 Call Girls in Noida Sector 10 Noida (Call Girls) Delhi9990771857 Call Girls in Noida Sector 10 Noida (Call Girls) Delhi
9990771857 Call Girls in Noida Sector 10 Noida (Call Girls) Delhidelhimodel235
 
Call Girls in Noida Sector 77 Noida 💯Call Us 🔝 9582086666 🔝 South Delhi Escor...
Call Girls in Noida Sector 77 Noida 💯Call Us 🔝 9582086666 🔝 South Delhi Escor...Call Girls in Noida Sector 77 Noida 💯Call Us 🔝 9582086666 🔝 South Delhi Escor...
Call Girls in Noida Sector 77 Noida 💯Call Us 🔝 9582086666 🔝 South Delhi Escor...delhimodel235
 
Call Girls in shastri nagar Delhi 8264348440 ✅ call girls ❤️
Call Girls in shastri nagar Delhi 8264348440 ✅ call girls ❤️Call Girls in shastri nagar Delhi 8264348440 ✅ call girls ❤️
Call Girls in shastri nagar Delhi 8264348440 ✅ call girls ❤️soniya singh
 
Call Girls In Hari Nagar Dadb Block {8447779280}Hari Nagar {West Delhi Escort...
Call Girls In Hari Nagar Dadb Block {8447779280}Hari Nagar {West Delhi Escort...Call Girls In Hari Nagar Dadb Block {8447779280}Hari Nagar {West Delhi Escort...
Call Girls In Hari Nagar Dadb Block {8447779280}Hari Nagar {West Delhi Escort...asmaqueen5
 
9990771857 Call Girls in Noida Sector 1 Noida (Call Girls) Delhi
9990771857 Call Girls in Noida Sector 1 Noida (Call Girls) Delhi9990771857 Call Girls in Noida Sector 1 Noida (Call Girls) Delhi
9990771857 Call Girls in Noida Sector 1 Noida (Call Girls) Delhidelhimodel235
 
Eco-Efficient Living: Redefining Sustainability through Leech's Green Design ...
Eco-Efficient Living: Redefining Sustainability through Leech's Green Design ...Eco-Efficient Living: Redefining Sustainability through Leech's Green Design ...
Eco-Efficient Living: Redefining Sustainability through Leech's Green Design ...Newman George Leech
 
Listing Turkey Sylvana Istanbul - Bahcesehir
Listing Turkey Sylvana Istanbul - BahcesehirListing Turkey Sylvana Istanbul - Bahcesehir
Listing Turkey Sylvana Istanbul - BahcesehirListing Turkey
 
9990771857 Call Girls in Noida Sector 11 Noida (Call Girls) Delhi
9990771857 Call Girls in Noida Sector 11 Noida (Call Girls) Delhi9990771857 Call Girls in Noida Sector 11 Noida (Call Girls) Delhi
9990771857 Call Girls in Noida Sector 11 Noida (Call Girls) Delhidelhimodel235
 
Call girls in Jeewan Park .Delhi↫8447779280↬ ꧂Escorts Service In Delhi Ncr
Call girls in Jeewan Park .Delhi↫8447779280↬ ꧂Escorts Service In Delhi NcrCall girls in Jeewan Park .Delhi↫8447779280↬ ꧂Escorts Service In Delhi Ncr
Call girls in Jeewan Park .Delhi↫8447779280↬ ꧂Escorts Service In Delhi Ncrasmaqueen5
 

Recently uploaded (20)

Call Girls in Janakpuri ↫8447779280↫Short 1500 Night 6000-Escorts Service In ...
Call Girls in Janakpuri ↫8447779280↫Short 1500 Night 6000-Escorts Service In ...Call Girls in Janakpuri ↫8447779280↫Short 1500 Night 6000-Escorts Service In ...
Call Girls in Janakpuri ↫8447779280↫Short 1500 Night 6000-Escorts Service In ...
 
Low Rate Call Girls in Tughlakabad Delhi Call 9990771857
Low Rate Call Girls in Tughlakabad Delhi Call 9990771857Low Rate Call Girls in Tughlakabad Delhi Call 9990771857
Low Rate Call Girls in Tughlakabad Delhi Call 9990771857
 
Shapoorji Pallonji Parkwest Sequoia Tower Bangalore.pdf
Shapoorji Pallonji Parkwest Sequoia Tower Bangalore.pdfShapoorji Pallonji Parkwest Sequoia Tower Bangalore.pdf
Shapoorji Pallonji Parkwest Sequoia Tower Bangalore.pdf
 
Call Girls in laxmi Nagar Delhi 💯Call Us 🔝 9582086666🔝 South Delhi Escorts Se...
Call Girls in laxmi Nagar Delhi 💯Call Us 🔝 9582086666🔝 South Delhi Escorts Se...Call Girls in laxmi Nagar Delhi 💯Call Us 🔝 9582086666🔝 South Delhi Escorts Se...
Call Girls in laxmi Nagar Delhi 💯Call Us 🔝 9582086666🔝 South Delhi Escorts Se...
 
call girls in ganesh nagar Delhi 8264348440 ✅ call girls ❤️
call girls in ganesh nagar Delhi 8264348440 ✅ call girls ❤️call girls in ganesh nagar Delhi 8264348440 ✅ call girls ❤️
call girls in ganesh nagar Delhi 8264348440 ✅ call girls ❤️
 
9990771857 Call Girls in Noida Sector 06 Noida (Call Girls) Delhi
9990771857 Call Girls in Noida Sector 06 Noida (Call Girls) Delhi9990771857 Call Girls in Noida Sector 06 Noida (Call Girls) Delhi
9990771857 Call Girls in Noida Sector 06 Noida (Call Girls) Delhi
 
9990771857 Call Girls in Noida Sector 03 Noida (Call Girls) Delhi
9990771857 Call Girls in Noida Sector 03 Noida (Call Girls) Delhi9990771857 Call Girls in Noida Sector 03 Noida (Call Girls) Delhi
9990771857 Call Girls in Noida Sector 03 Noida (Call Girls) Delhi
 
Call Girls in Nehru Place Delhi 💯Call Us 🔝8264348440🔝
Call Girls in Nehru Place Delhi 💯Call Us 🔝8264348440🔝Call Girls in Nehru Place Delhi 💯Call Us 🔝8264348440🔝
Call Girls in Nehru Place Delhi 💯Call Us 🔝8264348440🔝
 
9711199012 Call {Girls Delhi} Very Low rate Vaishali DownLoad PDF
9711199012 Call {Girls Delhi} Very Low rate Vaishali DownLoad PDF9711199012 Call {Girls Delhi} Very Low rate Vaishali DownLoad PDF
9711199012 Call {Girls Delhi} Very Low rate Vaishali DownLoad PDF
 
9990771857 Call Girls in Noida Sector 10 Noida (Call Girls) Delhi
9990771857 Call Girls in Noida Sector 10 Noida (Call Girls) Delhi9990771857 Call Girls in Noida Sector 10 Noida (Call Girls) Delhi
9990771857 Call Girls in Noida Sector 10 Noida (Call Girls) Delhi
 
Low Rate Call Girls in Triveni Complex Delhi Call 9873940964
Low Rate Call Girls in Triveni Complex Delhi Call 9873940964Low Rate Call Girls in Triveni Complex Delhi Call 9873940964
Low Rate Call Girls in Triveni Complex Delhi Call 9873940964
 
Call Girls in Noida Sector 77 Noida 💯Call Us 🔝 9582086666 🔝 South Delhi Escor...
Call Girls in Noida Sector 77 Noida 💯Call Us 🔝 9582086666 🔝 South Delhi Escor...Call Girls in Noida Sector 77 Noida 💯Call Us 🔝 9582086666 🔝 South Delhi Escor...
Call Girls in Noida Sector 77 Noida 💯Call Us 🔝 9582086666 🔝 South Delhi Escor...
 
Call Girls in shastri nagar Delhi 8264348440 ✅ call girls ❤️
Call Girls in shastri nagar Delhi 8264348440 ✅ call girls ❤️Call Girls in shastri nagar Delhi 8264348440 ✅ call girls ❤️
Call Girls in shastri nagar Delhi 8264348440 ✅ call girls ❤️
 
Call Girls In Hari Nagar Dadb Block {8447779280}Hari Nagar {West Delhi Escort...
Call Girls In Hari Nagar Dadb Block {8447779280}Hari Nagar {West Delhi Escort...Call Girls In Hari Nagar Dadb Block {8447779280}Hari Nagar {West Delhi Escort...
Call Girls In Hari Nagar Dadb Block {8447779280}Hari Nagar {West Delhi Escort...
 
9990771857 Call Girls in Noida Sector 1 Noida (Call Girls) Delhi
9990771857 Call Girls in Noida Sector 1 Noida (Call Girls) Delhi9990771857 Call Girls in Noida Sector 1 Noida (Call Girls) Delhi
9990771857 Call Girls in Noida Sector 1 Noida (Call Girls) Delhi
 
VIP Escorts in Delhi:🔝9953056974🔝 Hot Qutub Minar Delhi Escorts Service
VIP Escorts in Delhi:🔝9953056974🔝 Hot Qutub Minar Delhi Escorts ServiceVIP Escorts in Delhi:🔝9953056974🔝 Hot Qutub Minar Delhi Escorts Service
VIP Escorts in Delhi:🔝9953056974🔝 Hot Qutub Minar Delhi Escorts Service
 
Eco-Efficient Living: Redefining Sustainability through Leech's Green Design ...
Eco-Efficient Living: Redefining Sustainability through Leech's Green Design ...Eco-Efficient Living: Redefining Sustainability through Leech's Green Design ...
Eco-Efficient Living: Redefining Sustainability through Leech's Green Design ...
 
Listing Turkey Sylvana Istanbul - Bahcesehir
Listing Turkey Sylvana Istanbul - BahcesehirListing Turkey Sylvana Istanbul - Bahcesehir
Listing Turkey Sylvana Istanbul - Bahcesehir
 
9990771857 Call Girls in Noida Sector 11 Noida (Call Girls) Delhi
9990771857 Call Girls in Noida Sector 11 Noida (Call Girls) Delhi9990771857 Call Girls in Noida Sector 11 Noida (Call Girls) Delhi
9990771857 Call Girls in Noida Sector 11 Noida (Call Girls) Delhi
 
Call girls in Jeewan Park .Delhi↫8447779280↬ ꧂Escorts Service In Delhi Ncr
Call girls in Jeewan Park .Delhi↫8447779280↬ ꧂Escorts Service In Delhi NcrCall girls in Jeewan Park .Delhi↫8447779280↬ ꧂Escorts Service In Delhi Ncr
Call girls in Jeewan Park .Delhi↫8447779280↬ ꧂Escorts Service In Delhi Ncr
 

Real Estate Board of Greater Vancouver Statistics Package November 2020