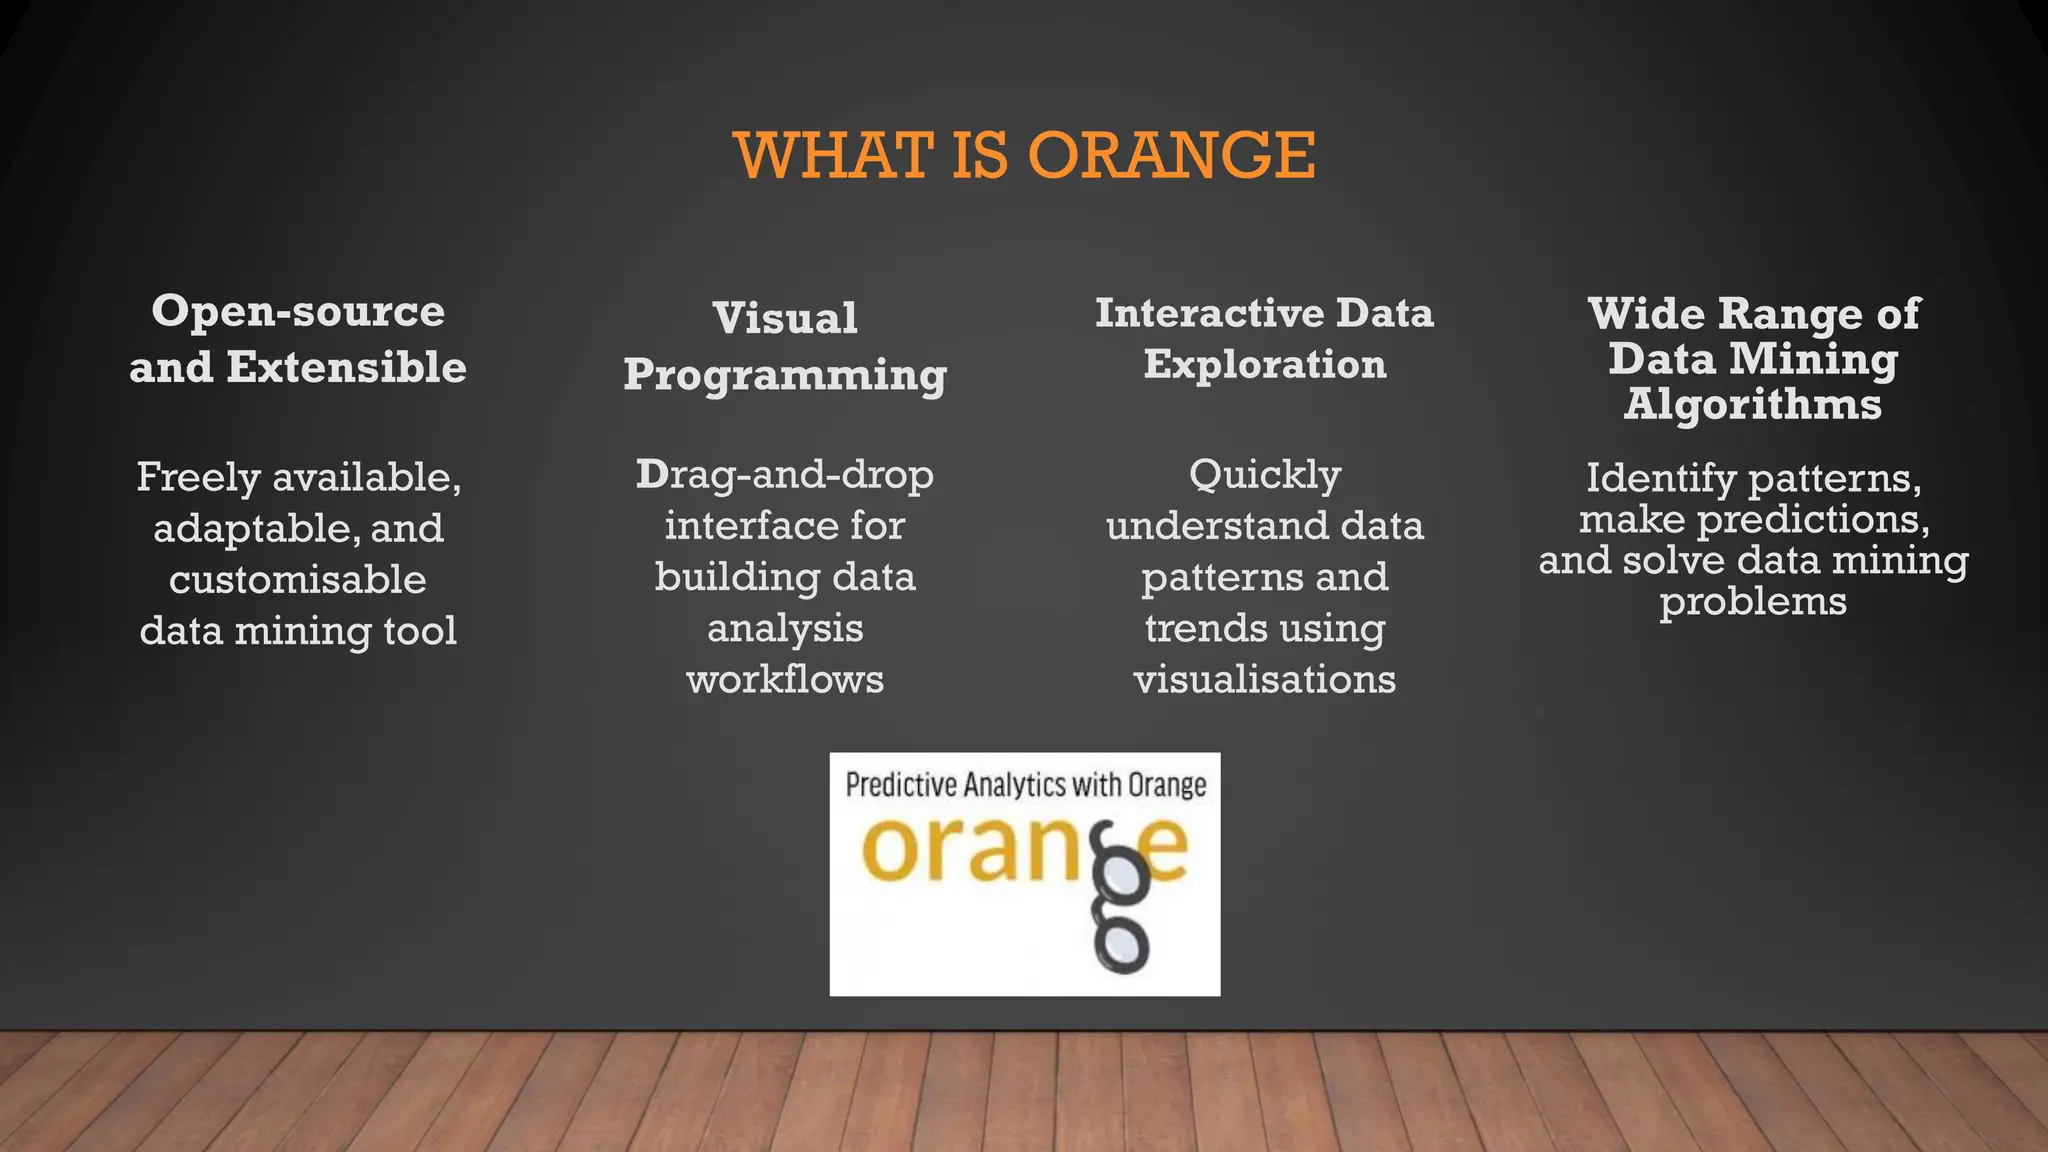
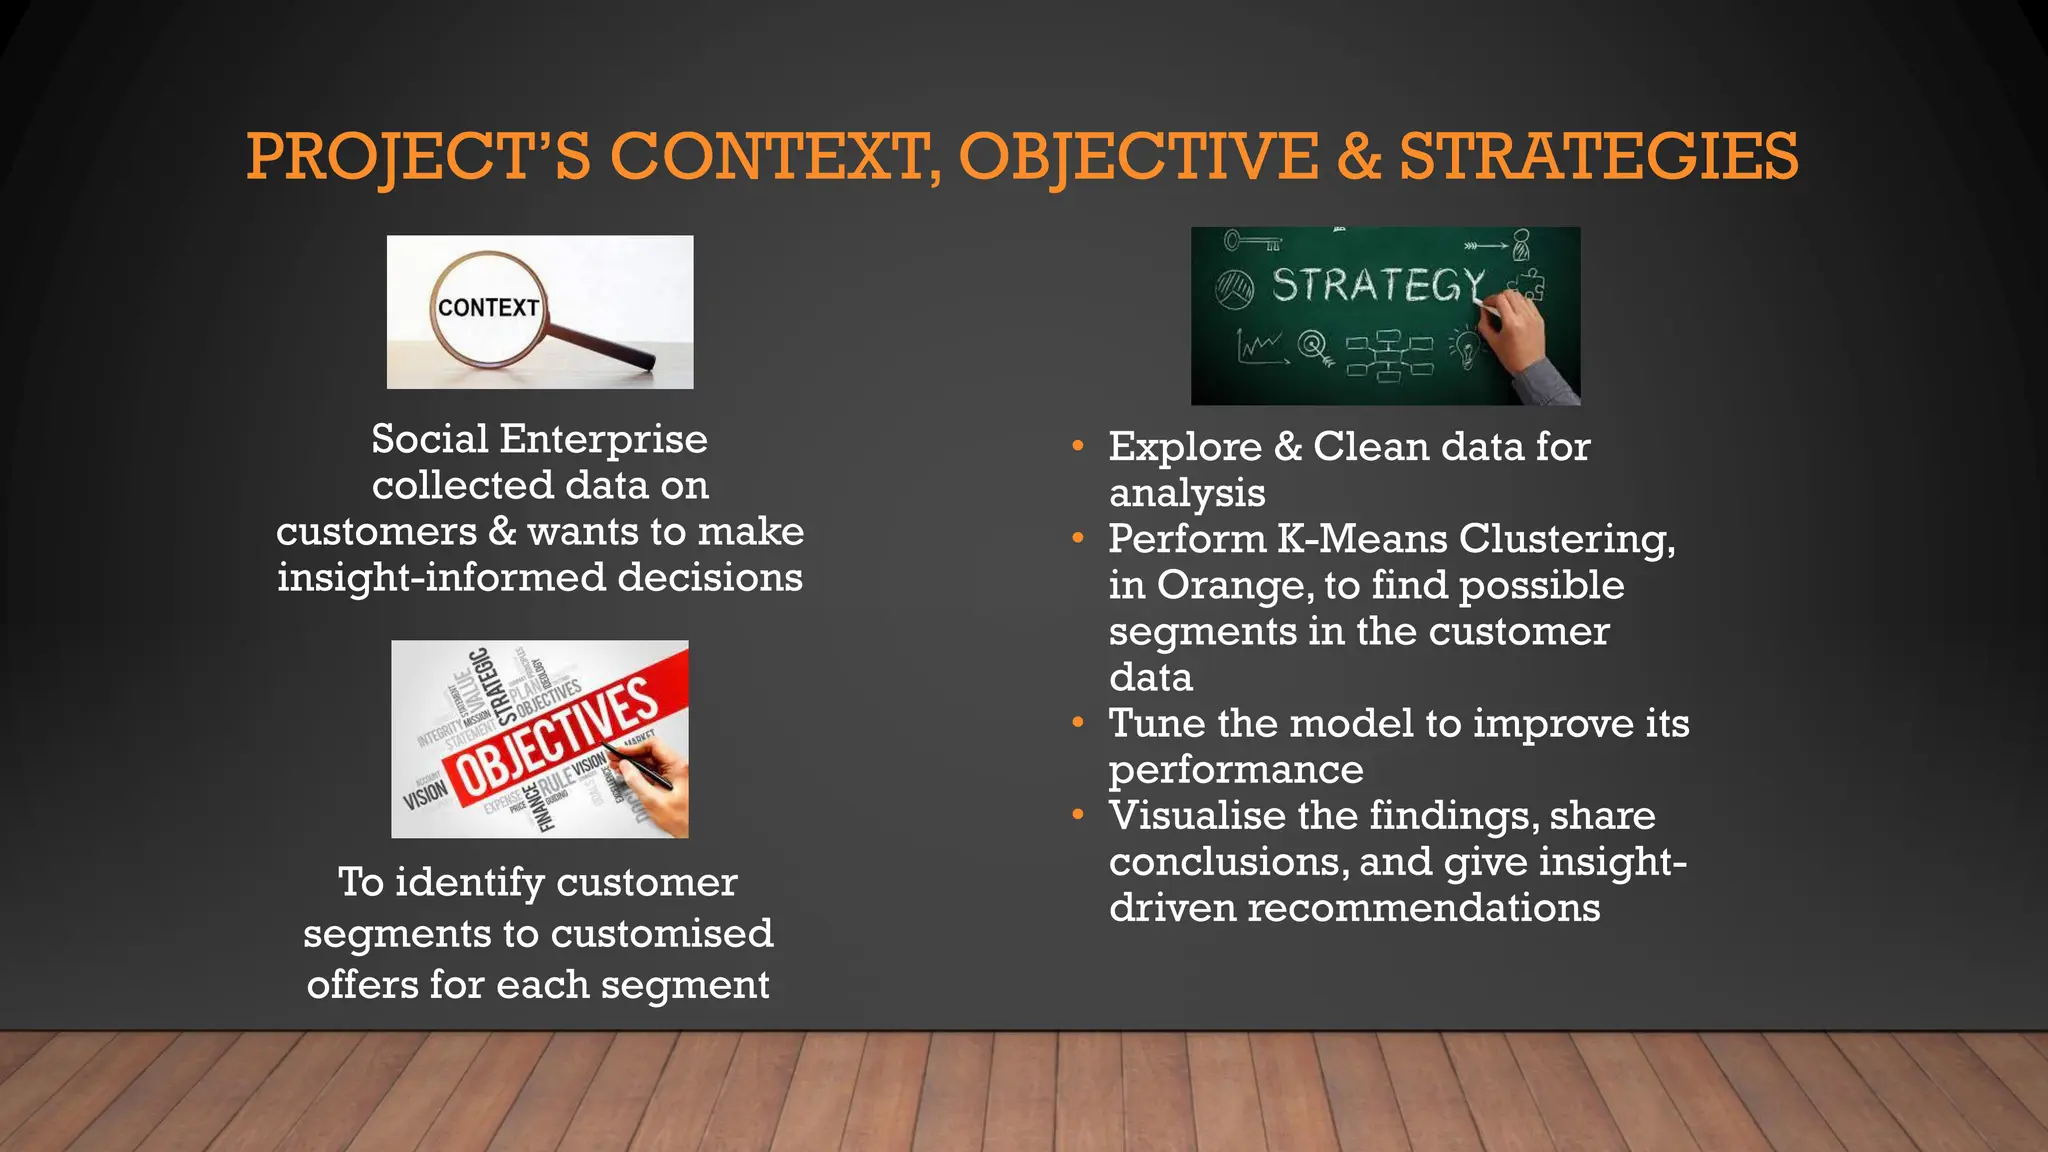
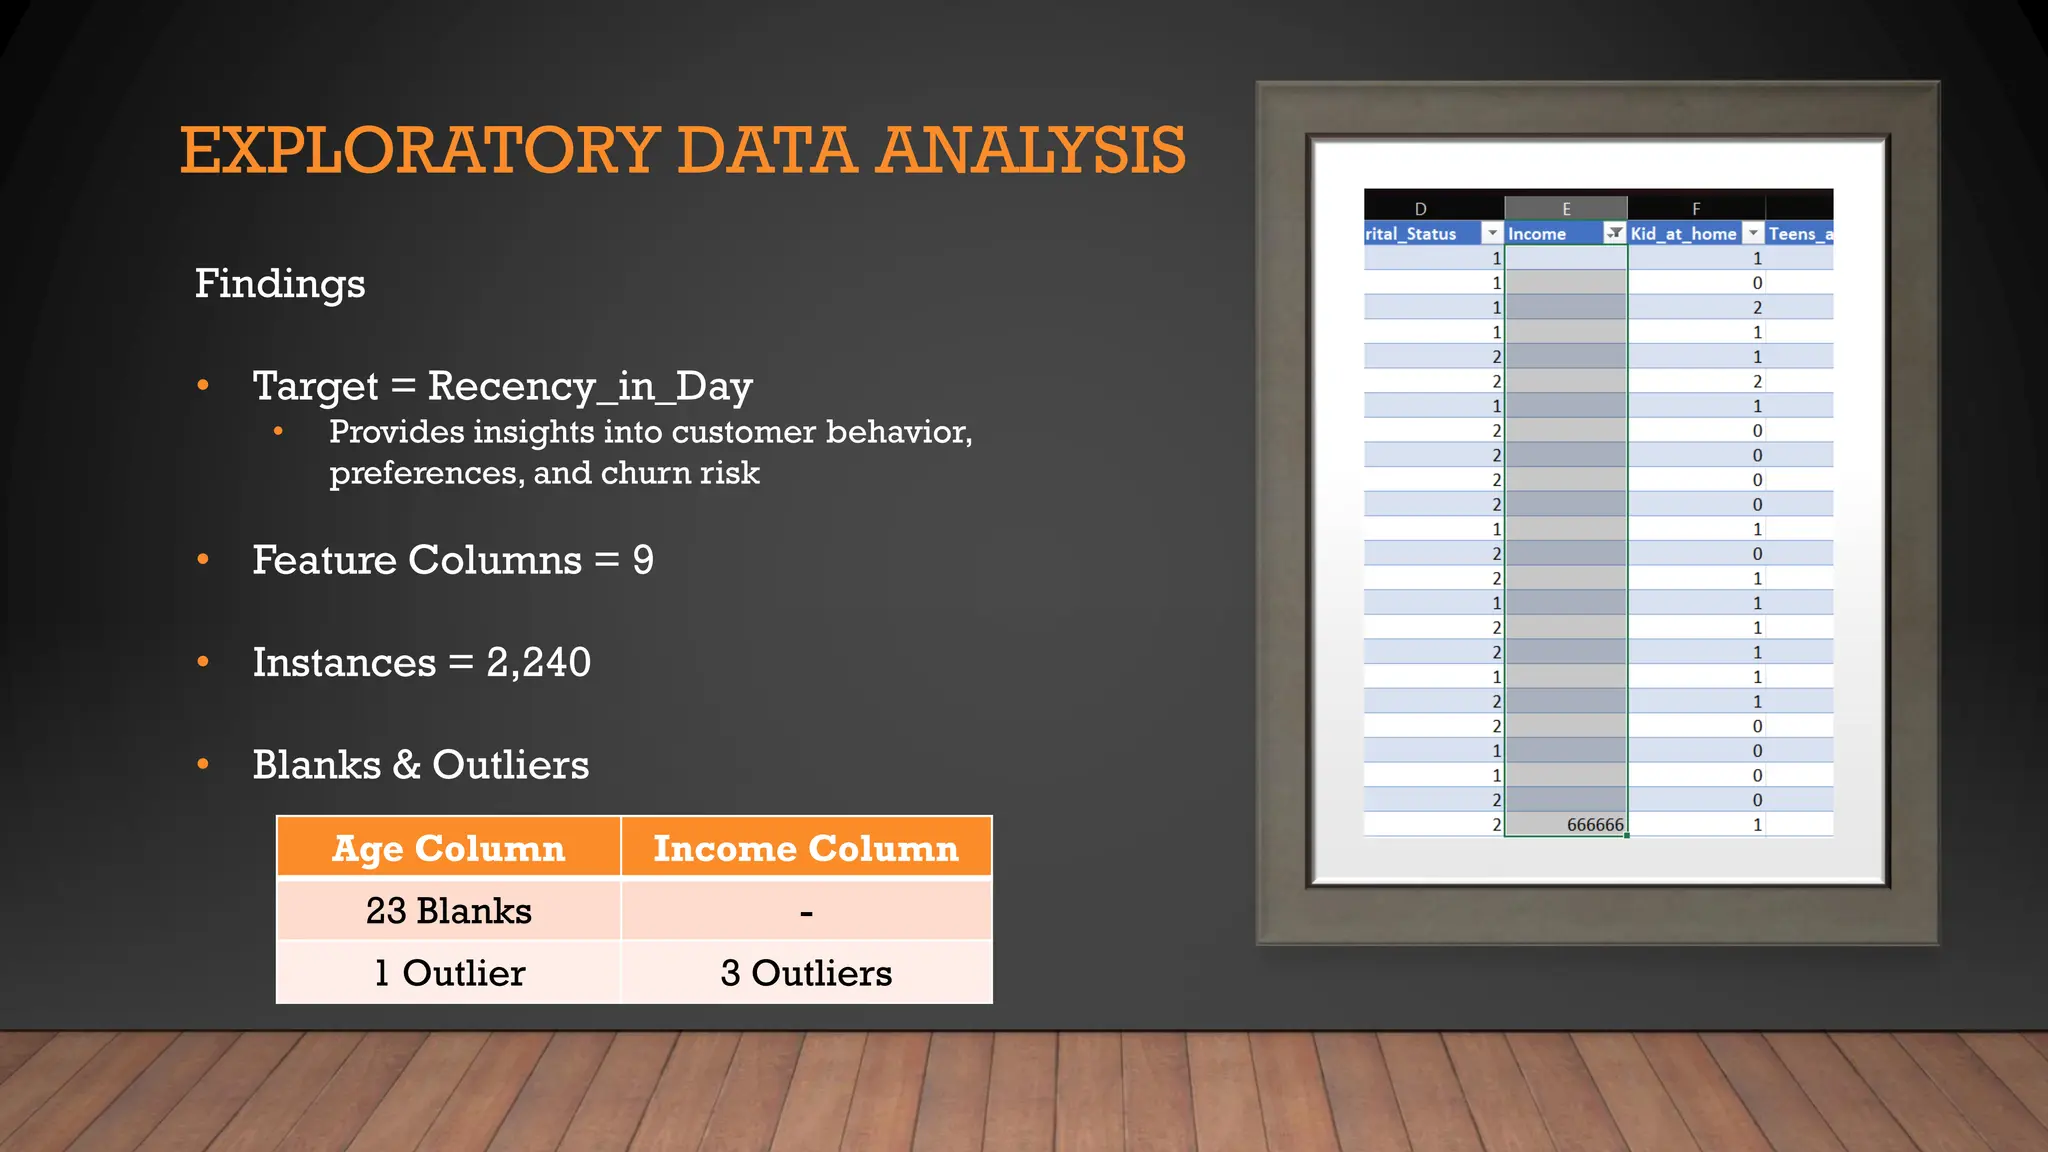
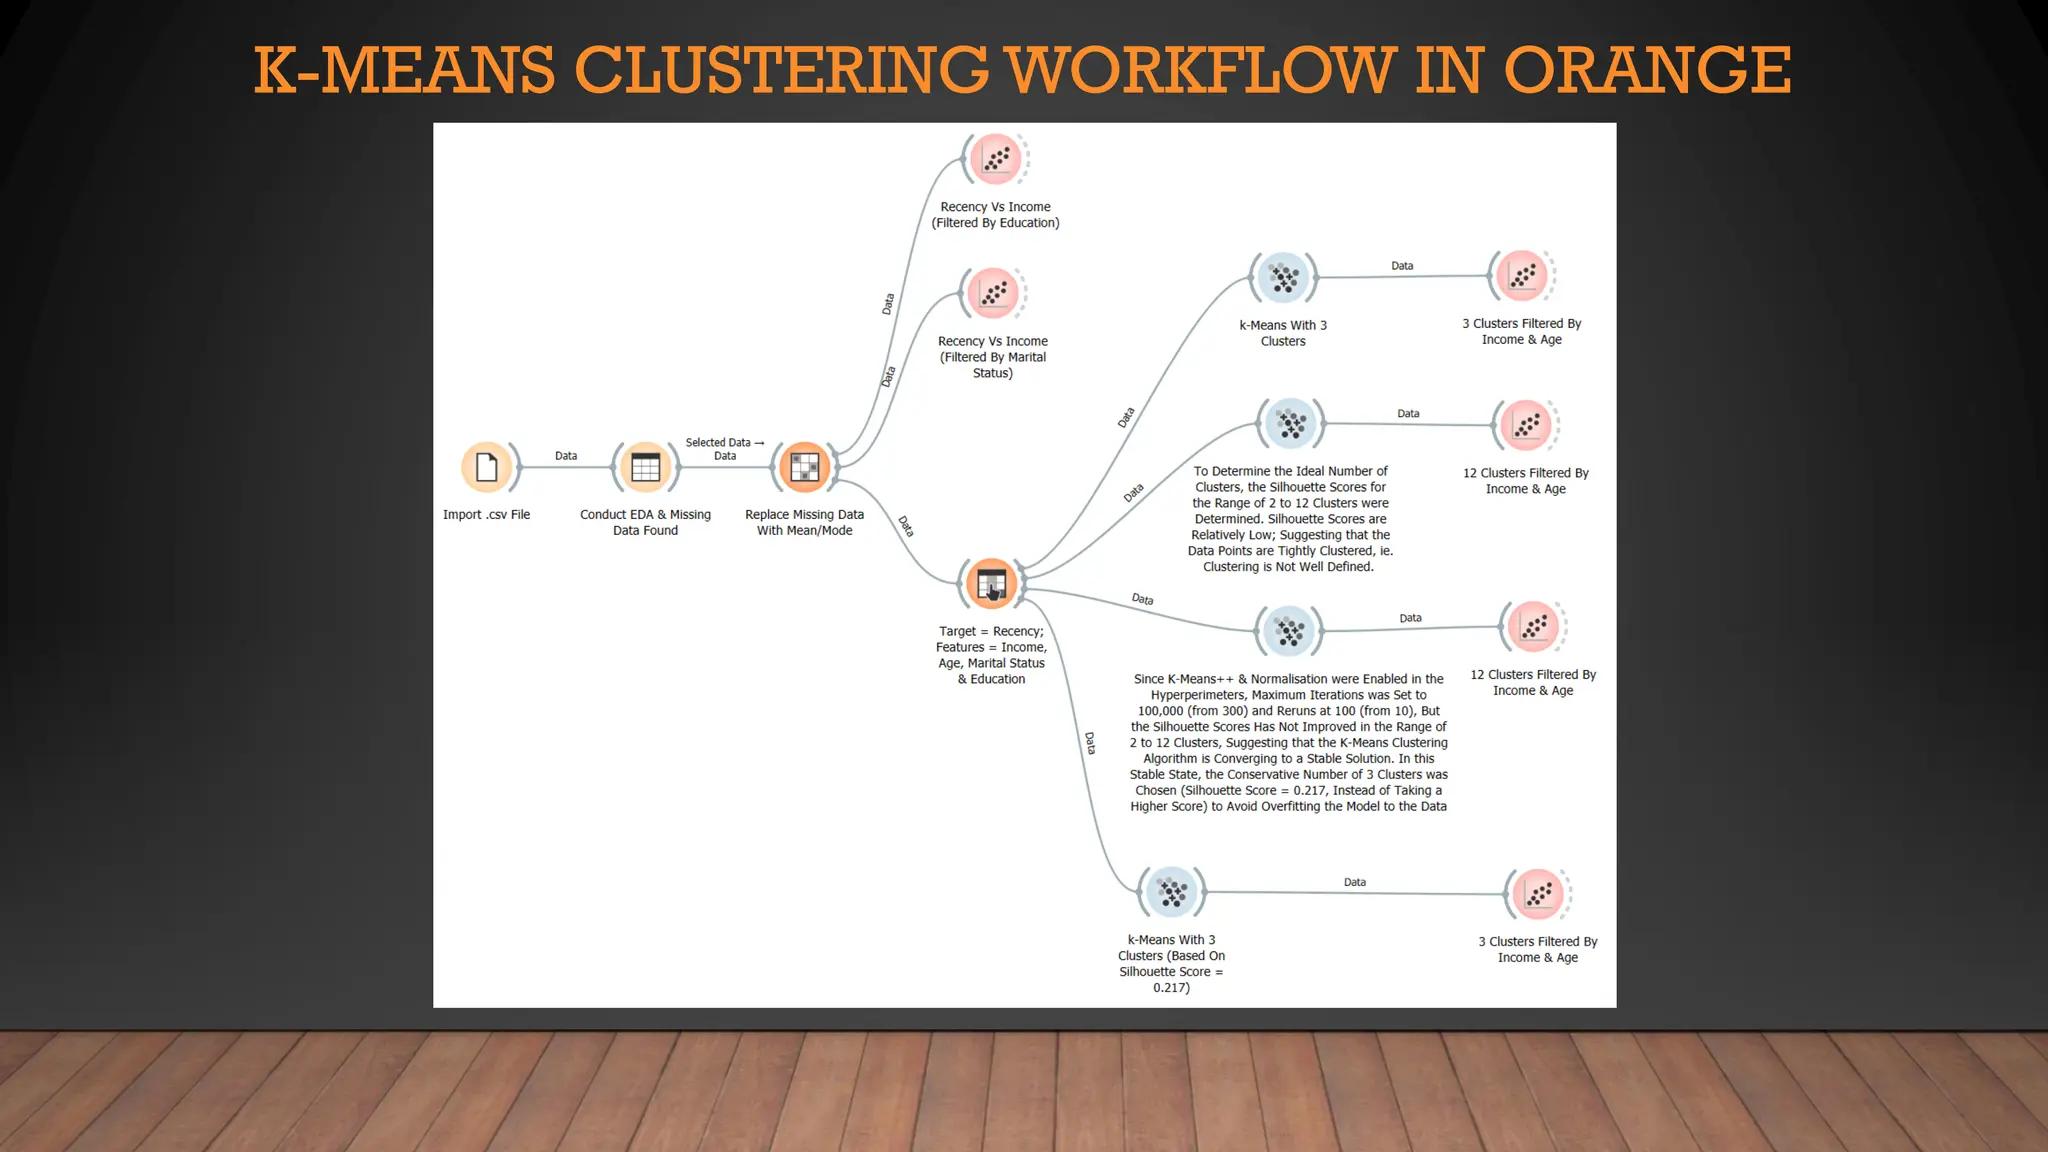
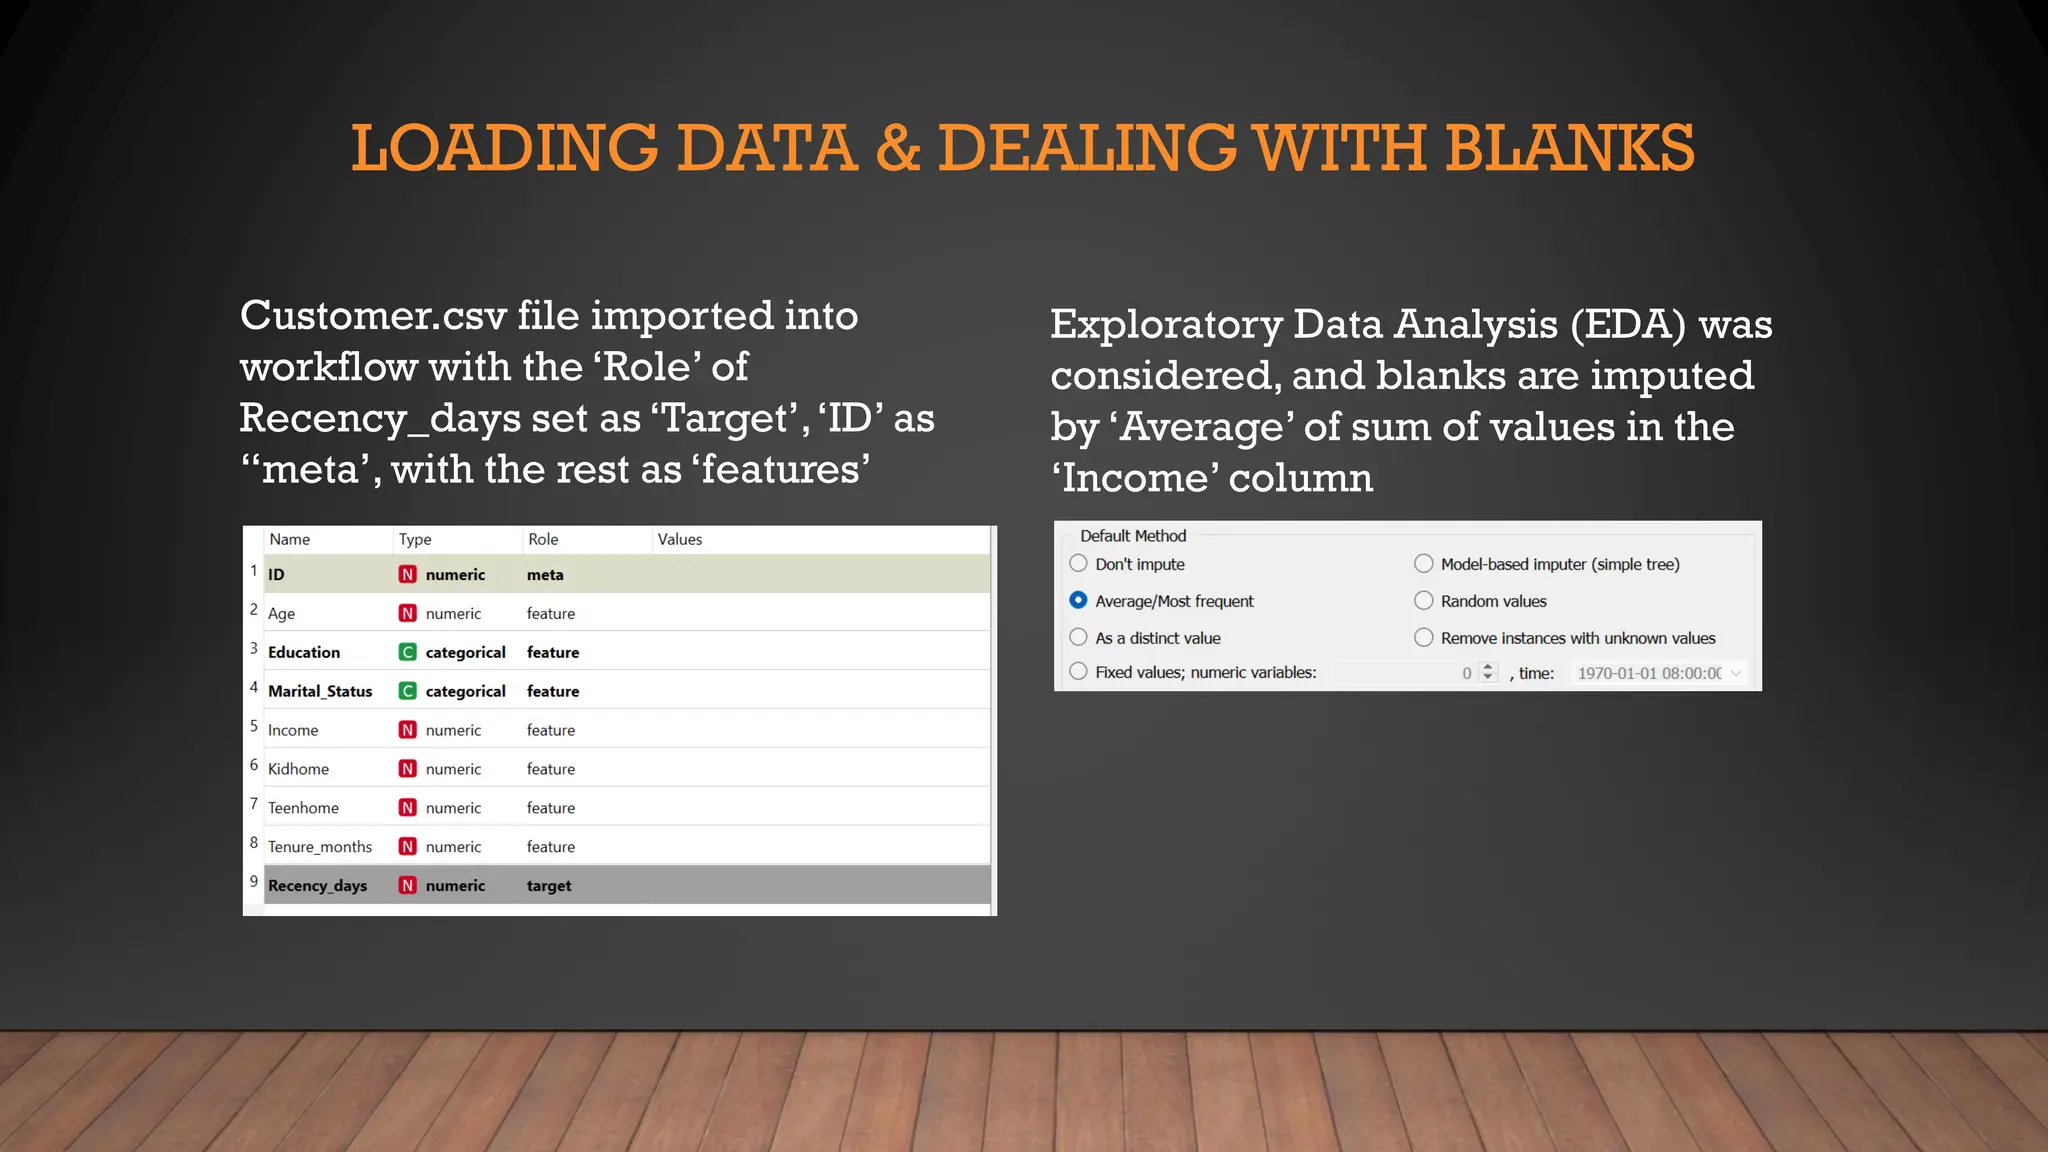
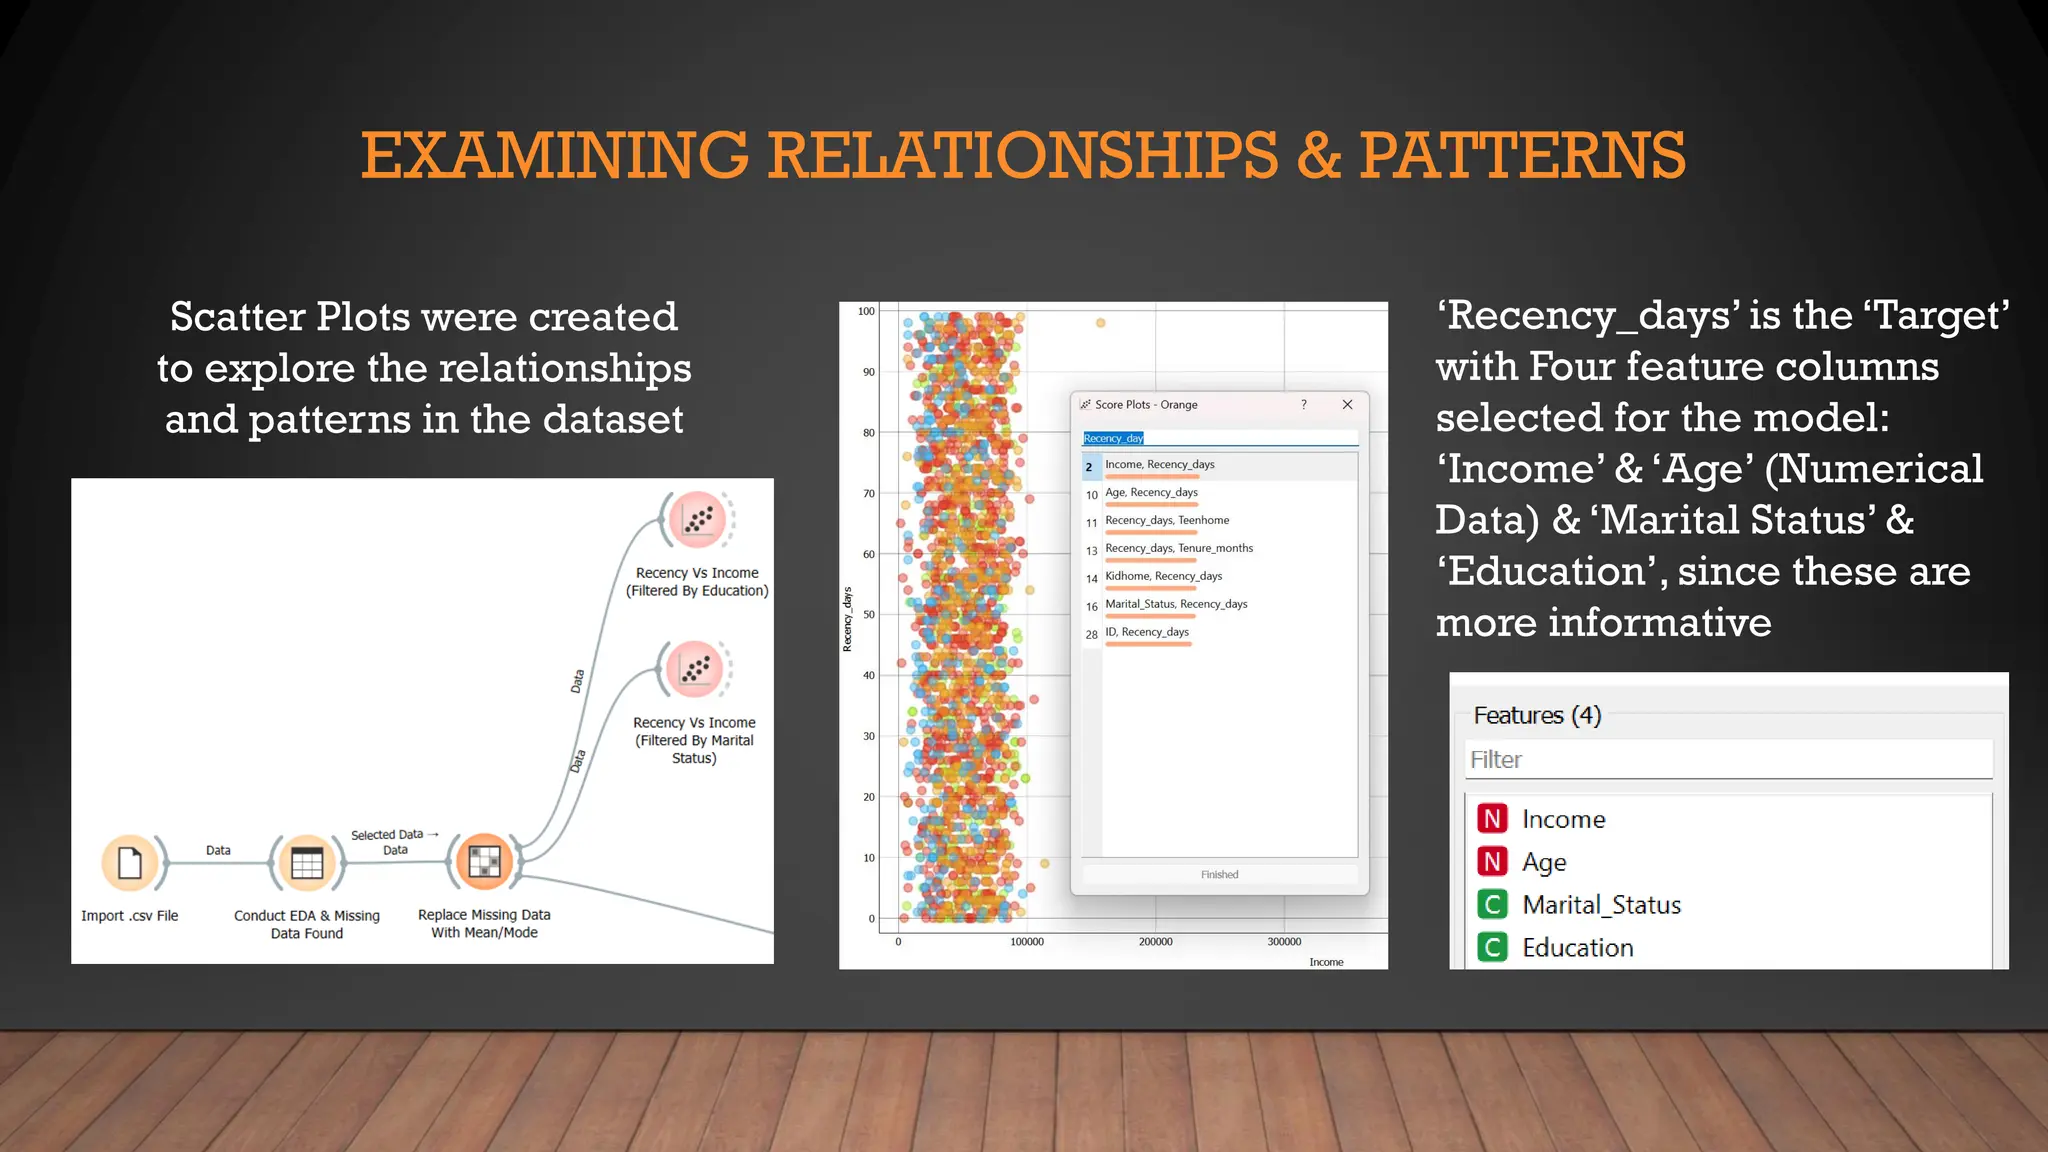
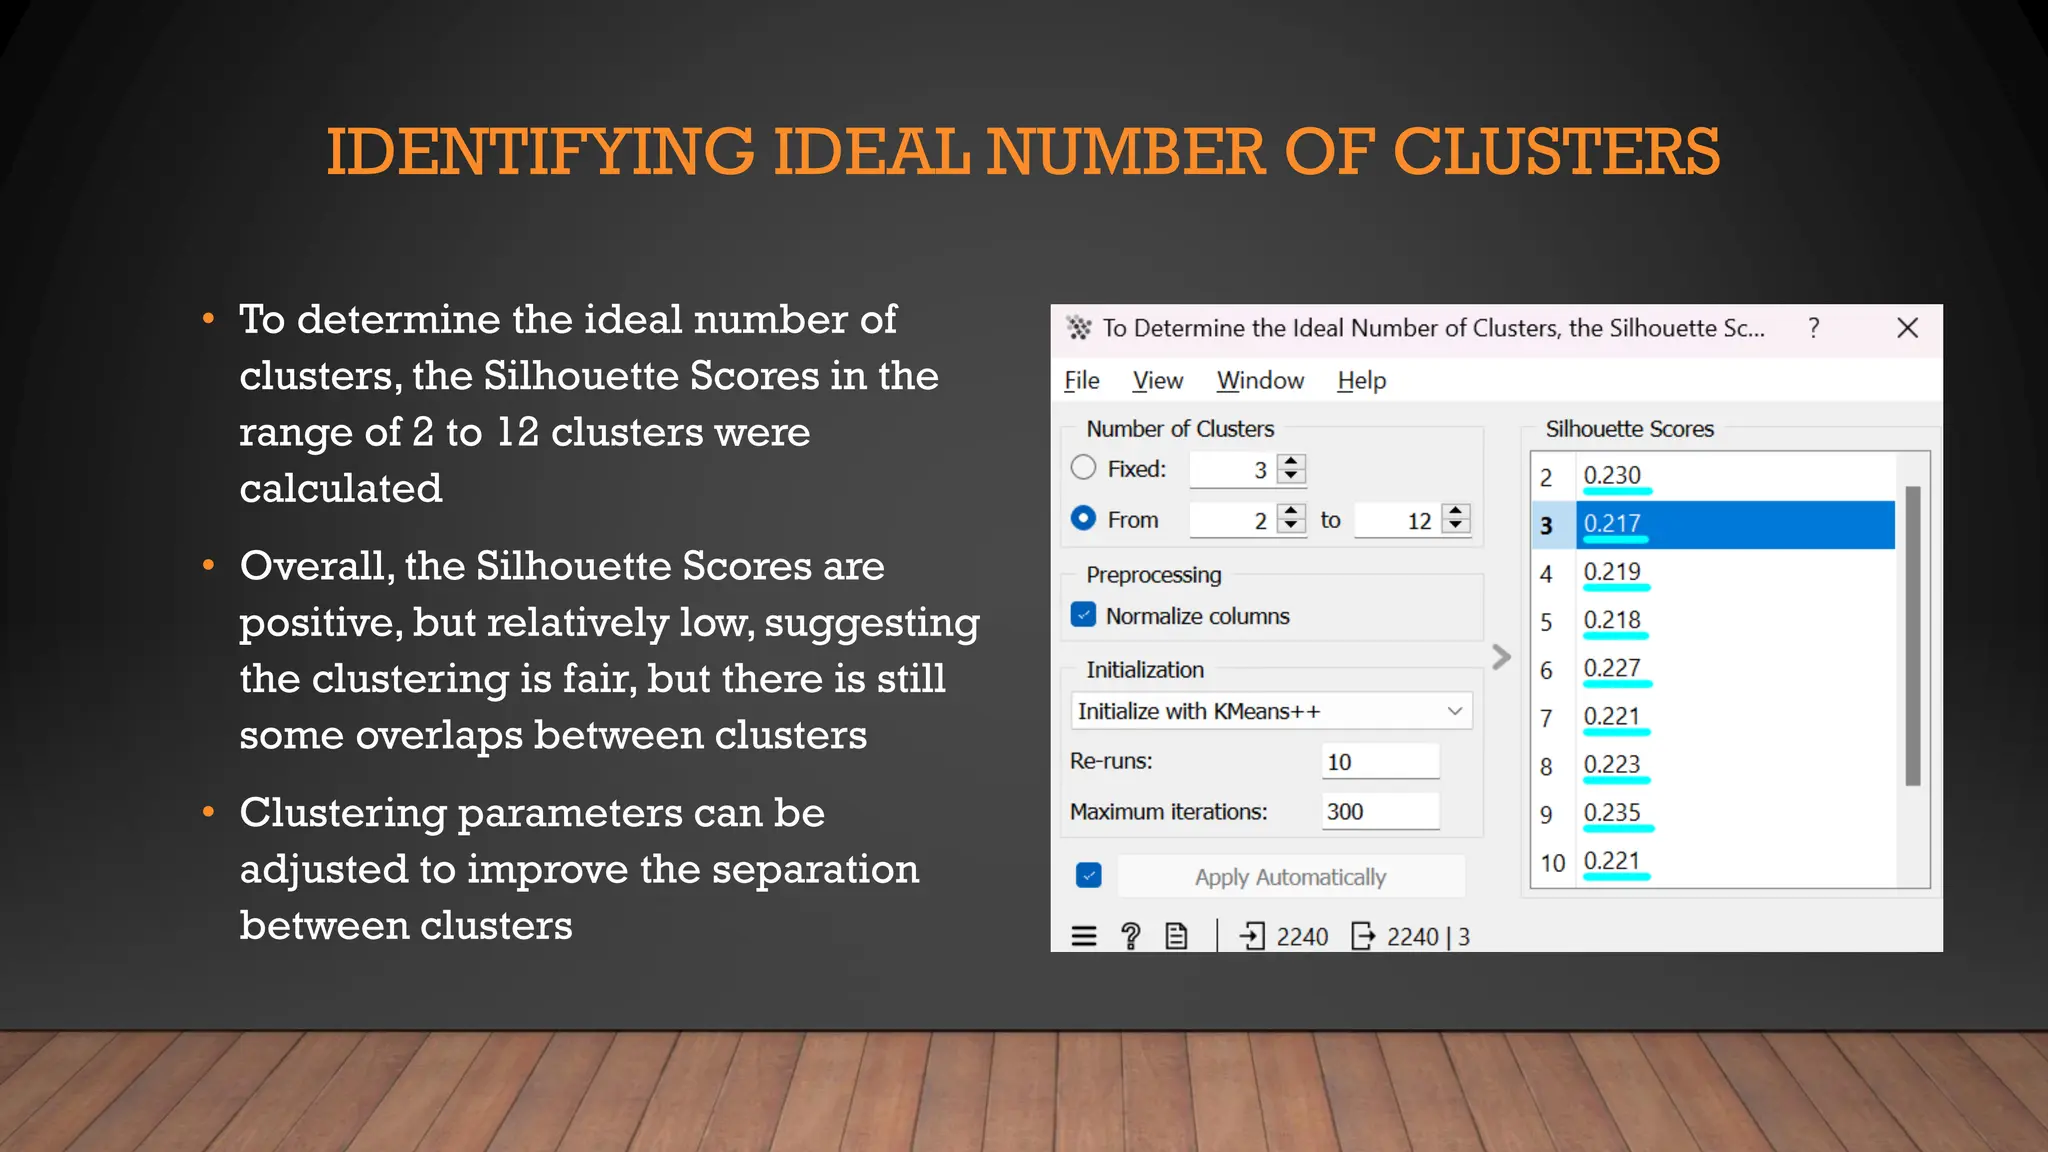
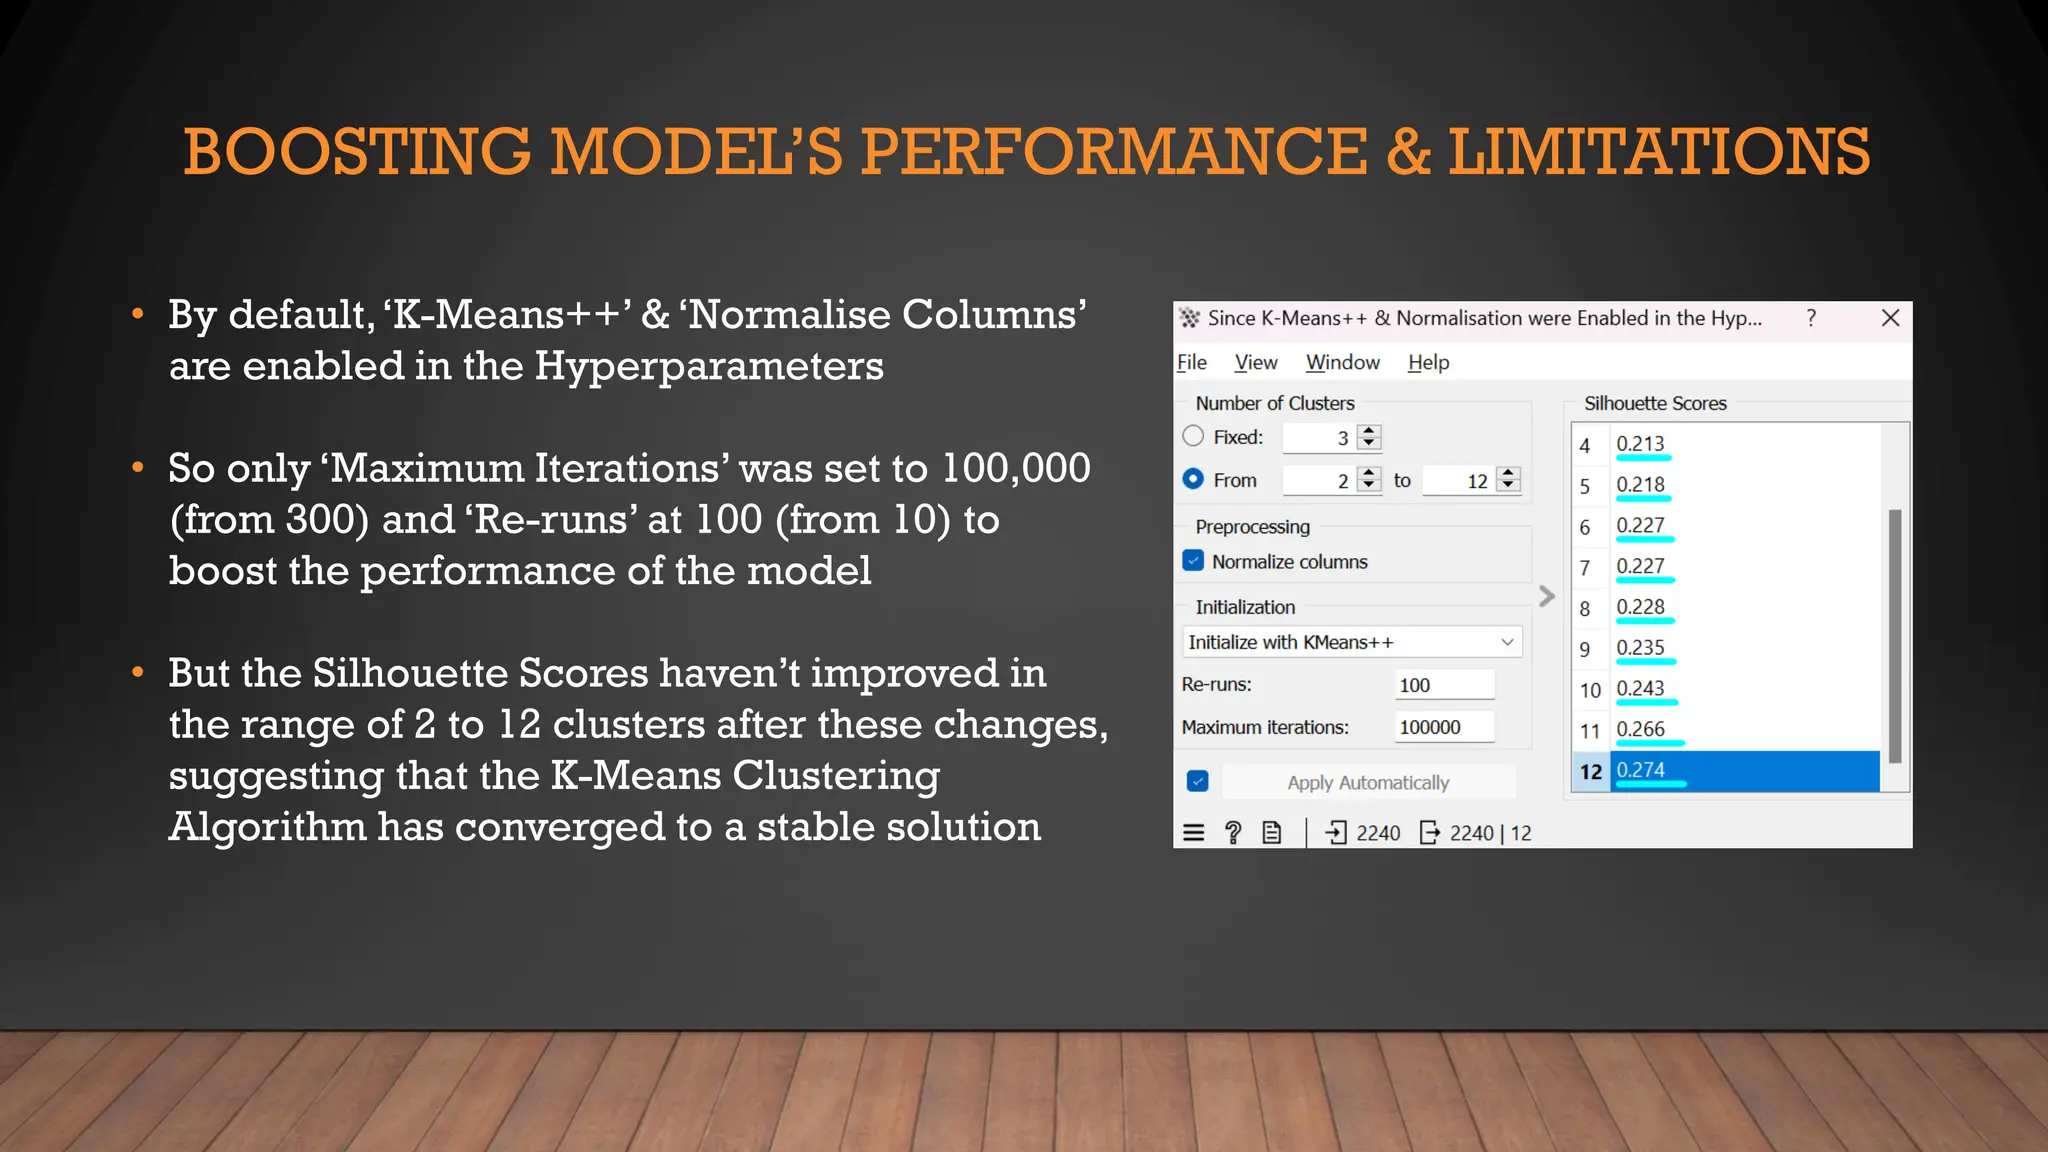
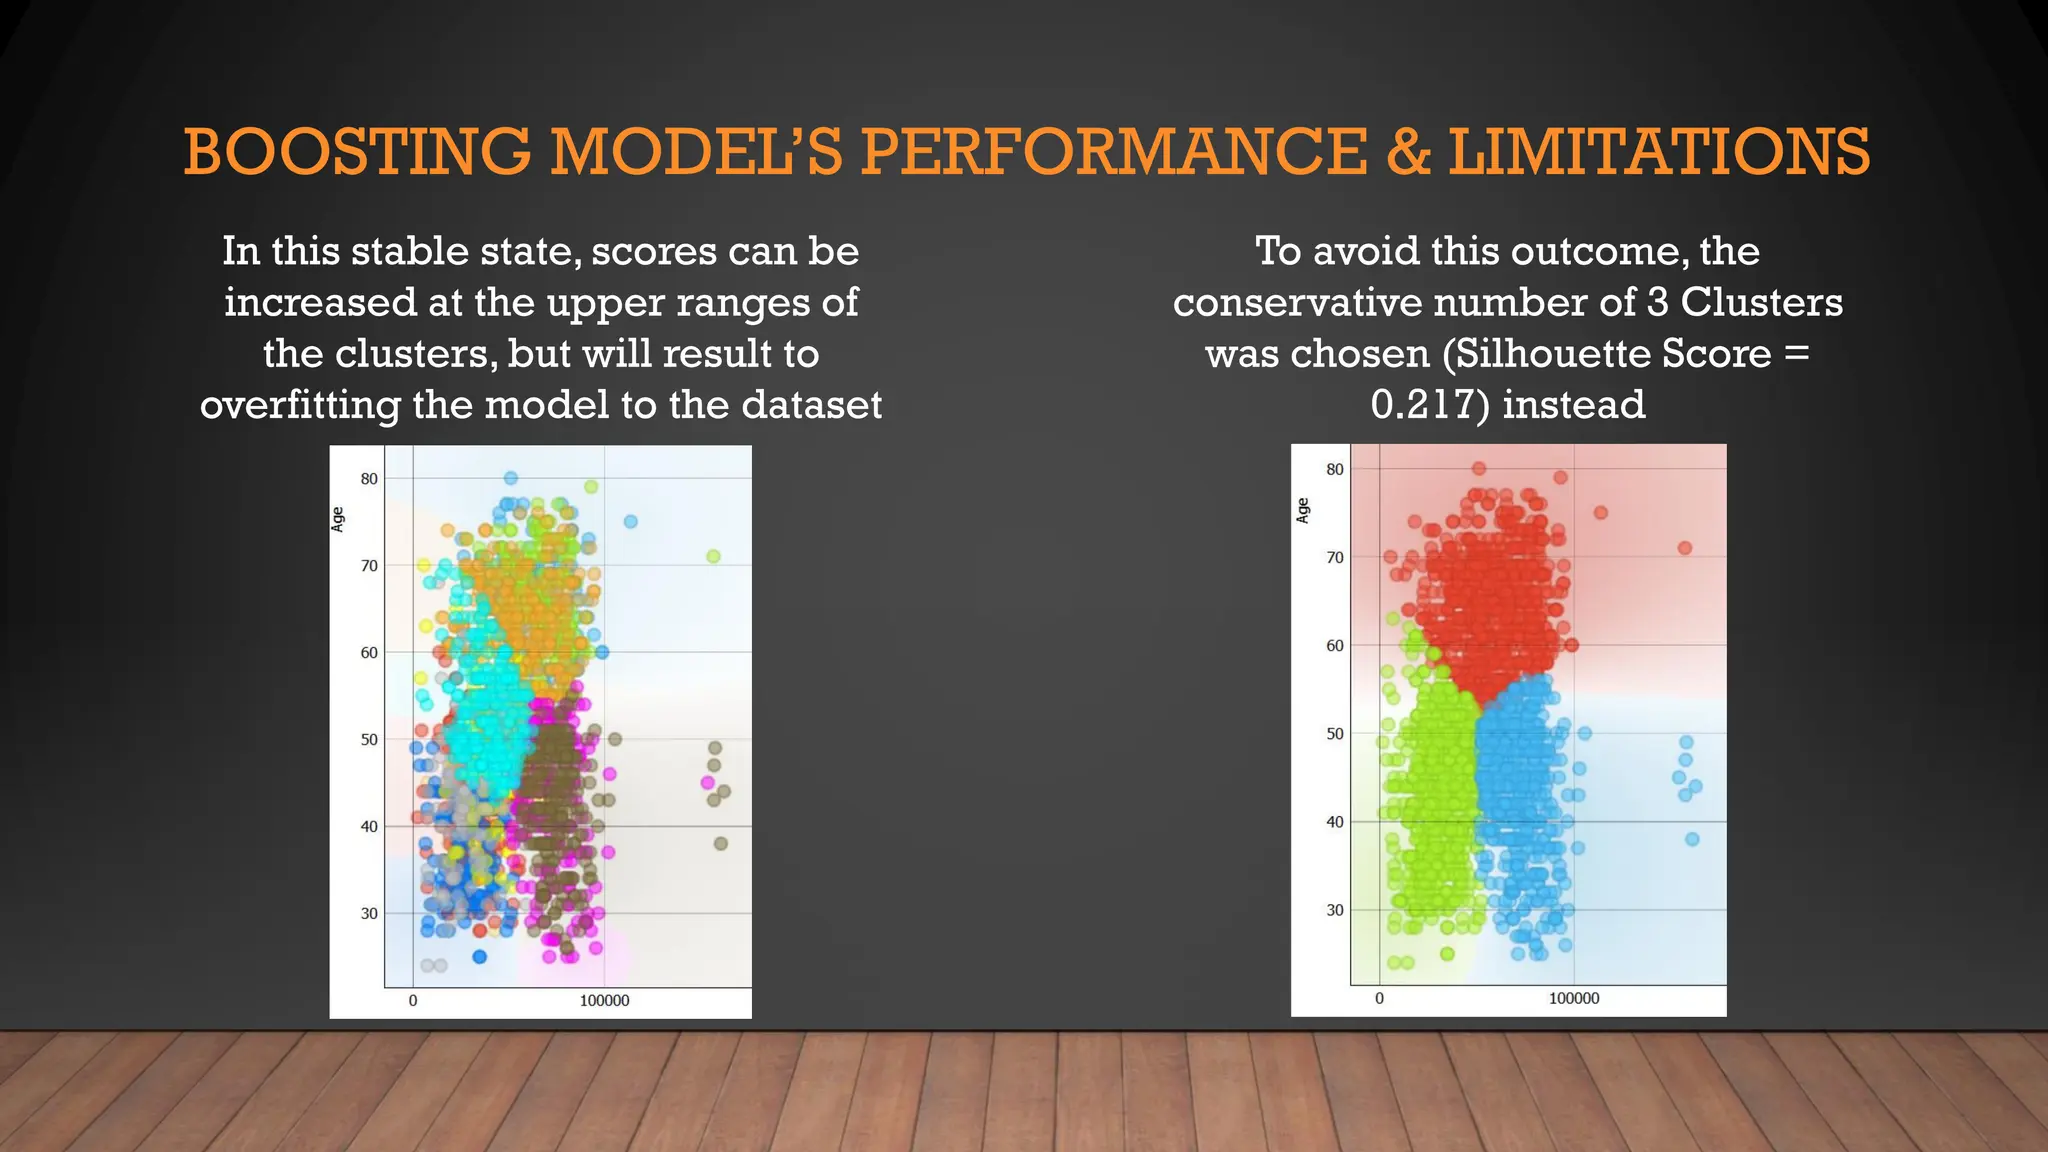
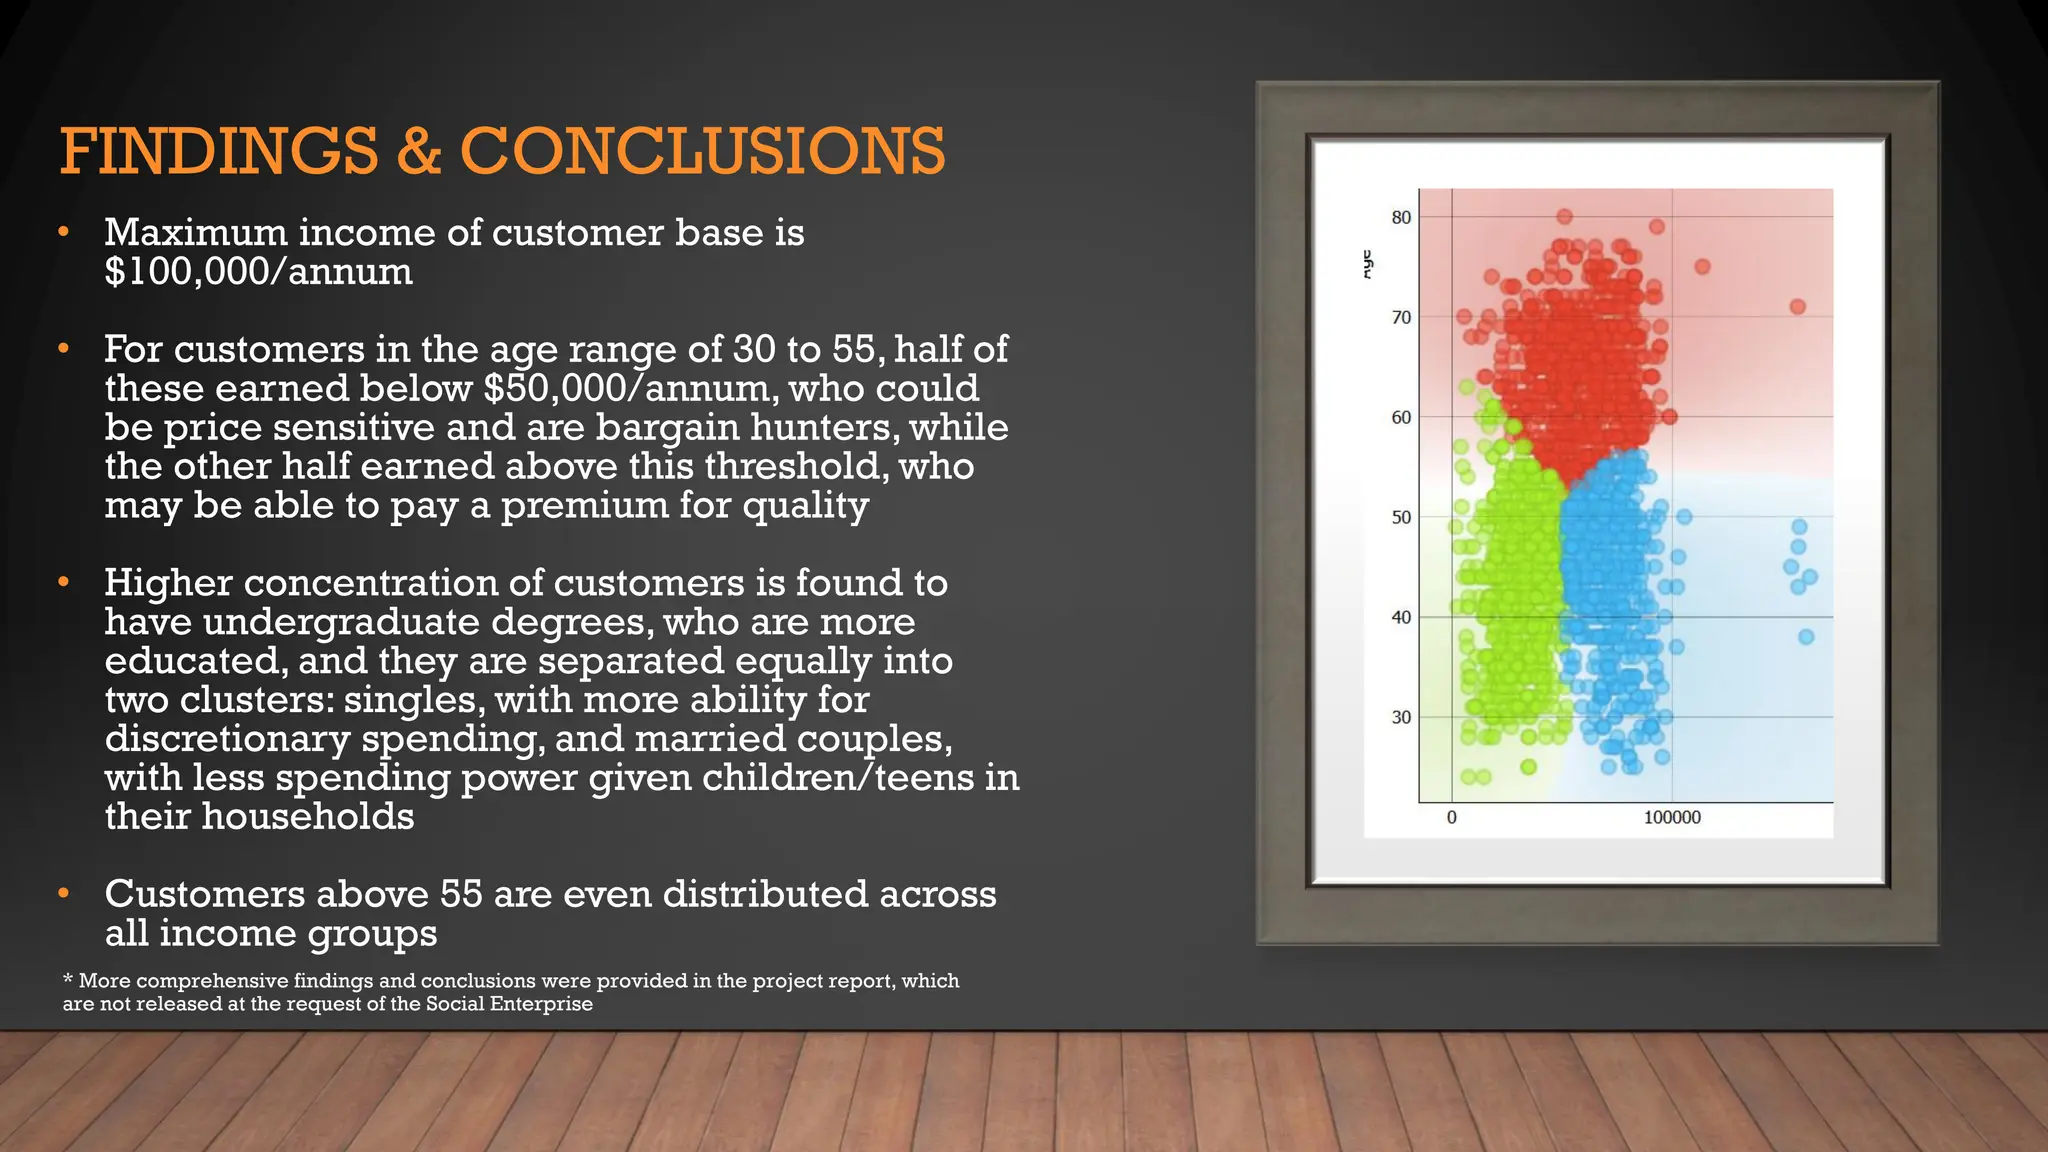
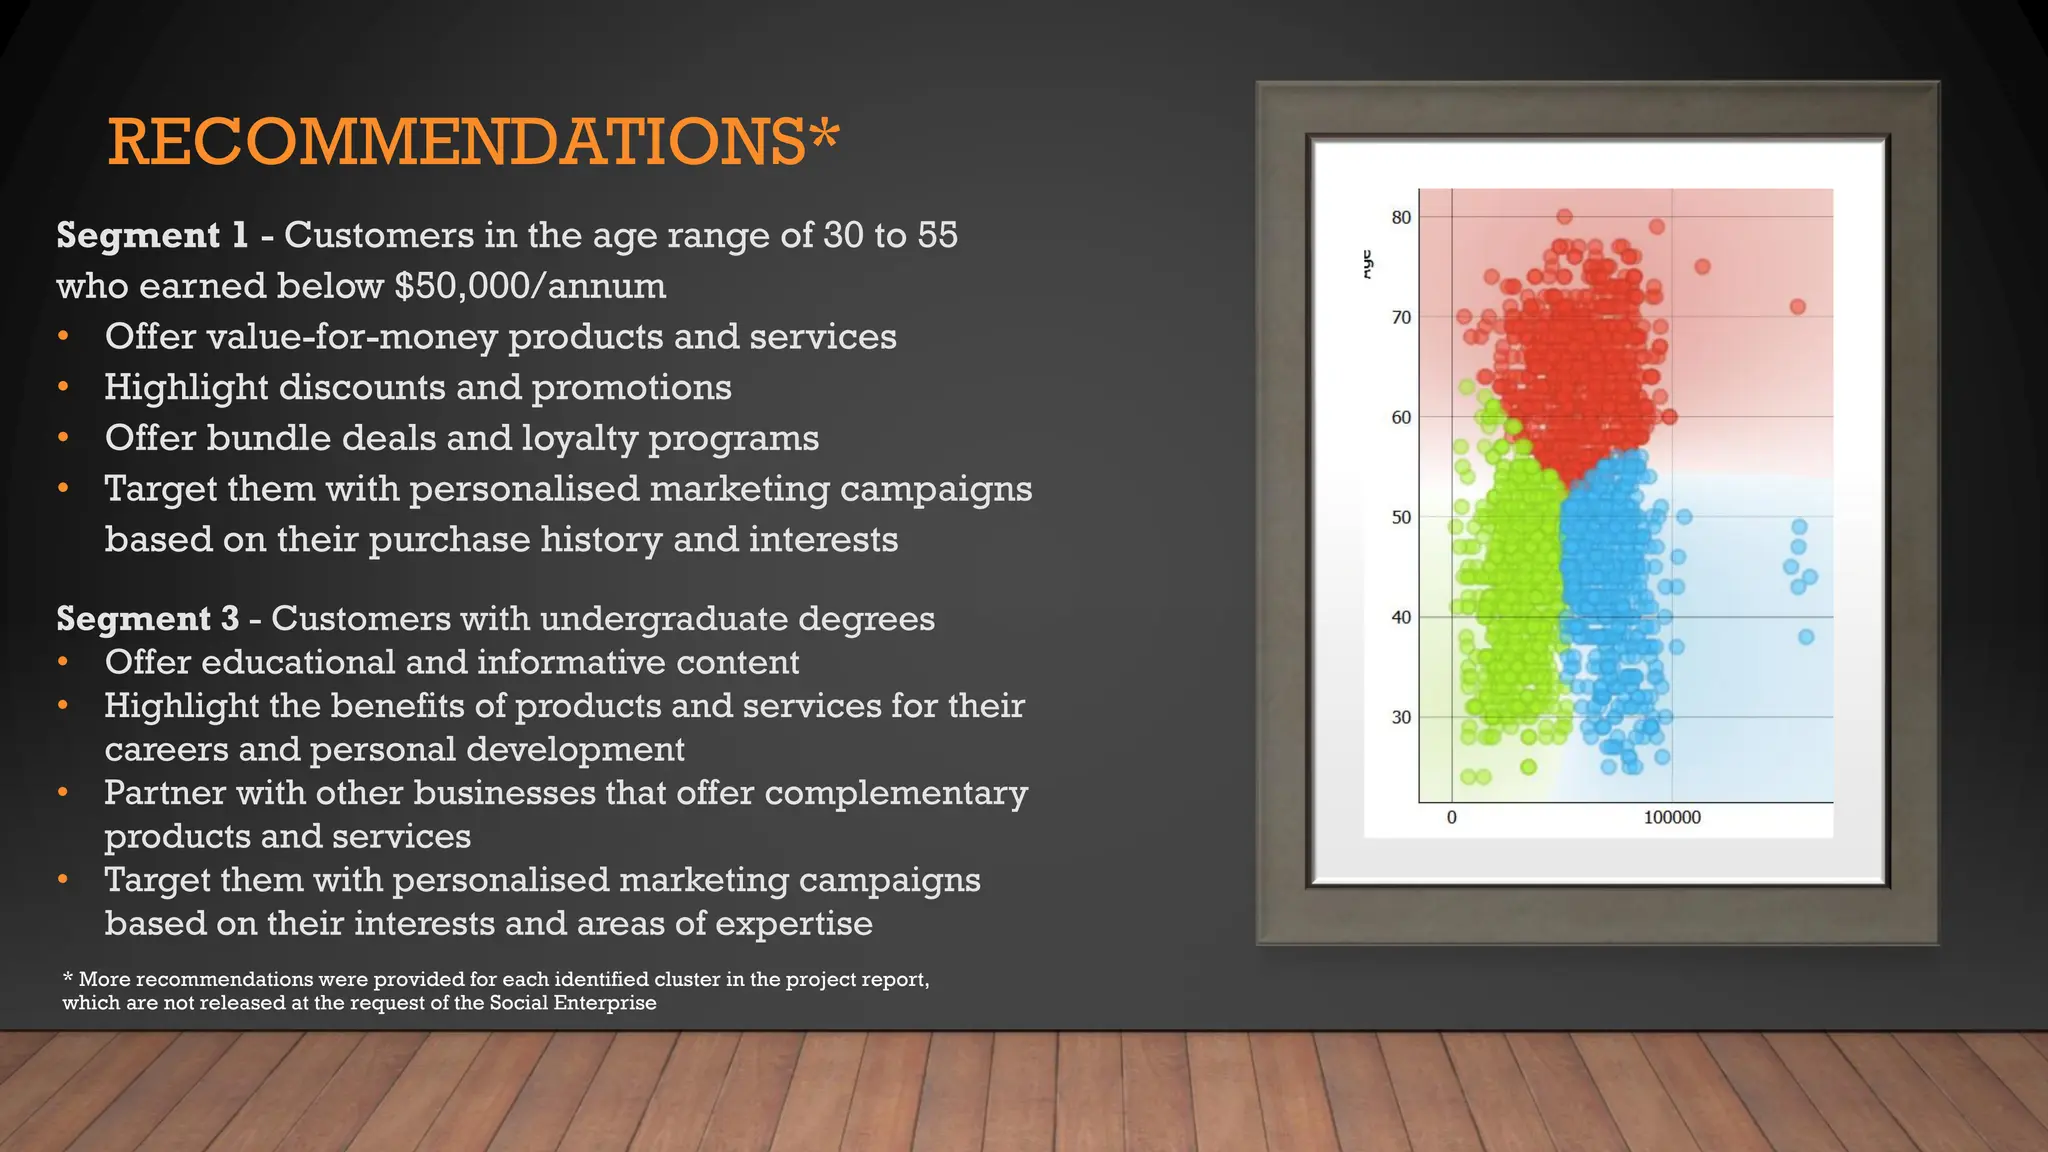
K-MEANS CLUSTERING
WITH ORANGE
IDENTIFY CUSTOMER SEGMENTS
OF A SOCIAL ENTERPRISE TO
CREATE CUSTOMER OFFERS FOR EACH SEGMENT
AUTHOR: ANTHONY MOK
DATE: 18 NOV 2023
EMAIL: XXIAOHAO@YAHOO.COM
WHAT IS ORANGE
Open-source
and Extensible
Freely available,
adaptable, and
customisable
data mining tool
Visual
Programming
Drag-and-drop
interface for
building data
analysis
workflows
Interactive Data
Exploration
Quickly
understand data
patterns and
trends using
visualisations
Wide Range of
Data Mining
Algorithms
Identify patterns,
make predictions,
and solve data mining
problems
PROJECT’S CONTEXT, OBJECTIVE & STRATEGIES
To identify customer
segments to customised
offers for each segment
Social Enterprise
collected data on
customers & wants to make
insight-informed decisions
• Explore & Clean data for
analysis
• Perform K-Means Clustering,
in Orange, to find possible
segments in the customer
data
• Tune the model to improve its
performance
• Visualise the findings, share
conclusions, and give insight-
driven recommendations
EXPLORATORY DATA ANALYSIS
Findings
• Target = Recency_in_Day
• Provides insights into customer behavior,
preferences, and churn risk
• Feature Columns = 9
• Instances = 2,240
• Blanks & Outliers
Age Column Income Column
23 Blanks -
1 Outlier 3 Outliers
K-MEANS CLUSTERING WORKFLOW IN ORANGE
LOADING DATA & DEALING WITH BLANKS
Customer.csv file imported into
workflow with the ‘Role’ of
Recency_days set as ‘Target’,‘ID’ as
“meta’, with the rest as ‘features’
Exploratory Data Analysis (EDA) was
considered, and blanks are imputed
by ‘Average’ of sum of values in the
‘Income’ column
EXAMINING RELATIONSHIPS & PATTERNS
Scatter Plots were created
to explore the relationships
and patterns in the dataset
‘Recency_days’is the ‘Target’
with Four feature columns
selected for the model:
‘Income’ & ‘Age’ (Numerical
Data) & ‘Marital Status’ &
‘Education’, since these are
more informative
IDENTIFYING IDEAL NUMBER OF CLUSTERS
• To determine the ideal number of
clusters, the Silhouette Scores in the
range of 2 to 12 clusters were
calculated
• Overall, the Silhouette Scores are
positive, but relatively low, suggesting
the clustering is fair, but there is still
some overlaps between clusters
• Clustering parameters can be
adjusted to improve the separation
between clusters
BOOSTING MODEL’S PERFORMANCE & LIMITATIONS
• By default,‘K-Means++’ & ‘Normalise Columns’
are enabled in the Hyperparameters
• So only ‘Maximum Iterations’ was set to 100,000
(from 300) and ‘Re-runs’ at 100 (from 10) to
boost the performance of the model
• But the Silhouette Scores haven’t improved in
the range of 2 to 12 clusters after these changes,
suggesting that the K-Means Clustering
Algorithm has converged to a stable solution
BOOSTING MODEL’S PERFORMANCE & LIMITATIONS
In this stable state, scores can be
increased at the upper ranges of
the clusters, but will result to
overfitting the model to the dataset
To avoid this outcome, the
conservative number of 3 Clusters
was chosen (Silhouette Score =
0.217) instead
FINDINGS & CONCLUSIONS
• Maximum income of customer base is
$100,000/annum
• For customers in the age range of 30 to 55, half of
these earned below $50,000/annum, who could
be price sensitive and are bargain hunters, while
the other half earned above this threshold, who
may be able to pay a premium for quality
• Higher concentration of customers is found to
have undergraduate degrees, who are more
educated, and they are separated equally into
two clusters: singles, with more ability for
discretionary spending, and married couples,
with less spending power given children/teens in
their households
• Customers above 55 are even distributed across
all income groups
* More comprehensive findings and conclusions were provided in the project report, which
are not released at the request of the Social Enterprise
RECOMMENDATIONS*
Segment 1 - Customers in the age range of 30 to 55
who earned below $50,000/annum
• Offer value-for-money products and services
• Highlight discounts and promotions
• Offer bundle deals and loyalty programs
• Target them with personalised marketing campaigns
based on their purchase history and interests
* More recommendations were provided for each identified cluster in the project report,
which are not released at the request of the Social Enterprise
Segment 3 - Customers with undergraduate degrees
• Offer educational and informative content
• Highlight the benefits of products and services for their
careers and personal development
• Partner with other businesses that offer complementary
products and services
• Target them with personalised marketing campaigns
based on their interests and areas of expertise
K-MEANS CLUSTERING
WITH ORANGE
IDENTIFY CUSTOMER SEGMENTS
OF A SOCIAL ENTERPRISE TO
CREATE CUSTOMER OFFERS FOR EACH SEGMENT
AUTHOR: ANTHONY MOK
DATE: 18 NOV 2023
EMAIL: XXIAOHAO@YAHOO.COM

Identify Customer Segments to Create Customer Offers for Each Segment - Application of K-Means Clustering With Orange

  • 1.
    K-MEANS CLUSTERING WITH ORANGE IDENTIFYCUSTOMER SEGMENTS OF A SOCIAL ENTERPRISE TO CREATE CUSTOMER OFFERS FOR EACH SEGMENT AUTHOR: ANTHONY MOK DATE: 18 NOV 2023 EMAIL: XXIAOHAO@YAHOO.COM
  • 2.
    WHAT IS ORANGE Open-source andExtensible Freely available, adaptable, and customisable data mining tool Visual Programming Drag-and-drop interface for building data analysis workflows Interactive Data Exploration Quickly understand data patterns and trends using visualisations Wide Range of Data Mining Algorithms Identify patterns, make predictions, and solve data mining problems
  • 3.
    PROJECT’S CONTEXT, OBJECTIVE& STRATEGIES To identify customer segments to customised offers for each segment Social Enterprise collected data on customers & wants to make insight-informed decisions • Explore & Clean data for analysis • Perform K-Means Clustering, in Orange, to find possible segments in the customer data • Tune the model to improve its performance • Visualise the findings, share conclusions, and give insight- driven recommendations
  • 4.
    EXPLORATORY DATA ANALYSIS Findings •Target = Recency_in_Day • Provides insights into customer behavior, preferences, and churn risk • Feature Columns = 9 • Instances = 2,240 • Blanks & Outliers Age Column Income Column 23 Blanks - 1 Outlier 3 Outliers
  • 5.
  • 6.
    LOADING DATA &DEALING WITH BLANKS Customer.csv file imported into workflow with the ‘Role’ of Recency_days set as ‘Target’,‘ID’ as “meta’, with the rest as ‘features’ Exploratory Data Analysis (EDA) was considered, and blanks are imputed by ‘Average’ of sum of values in the ‘Income’ column
  • 7.
    EXAMINING RELATIONSHIPS &PATTERNS Scatter Plots were created to explore the relationships and patterns in the dataset ‘Recency_days’is the ‘Target’ with Four feature columns selected for the model: ‘Income’ & ‘Age’ (Numerical Data) & ‘Marital Status’ & ‘Education’, since these are more informative
  • 8.
    IDENTIFYING IDEAL NUMBEROF CLUSTERS • To determine the ideal number of clusters, the Silhouette Scores in the range of 2 to 12 clusters were calculated • Overall, the Silhouette Scores are positive, but relatively low, suggesting the clustering is fair, but there is still some overlaps between clusters • Clustering parameters can be adjusted to improve the separation between clusters
  • 9.
    BOOSTING MODEL’S PERFORMANCE& LIMITATIONS • By default,‘K-Means++’ & ‘Normalise Columns’ are enabled in the Hyperparameters • So only ‘Maximum Iterations’ was set to 100,000 (from 300) and ‘Re-runs’ at 100 (from 10) to boost the performance of the model • But the Silhouette Scores haven’t improved in the range of 2 to 12 clusters after these changes, suggesting that the K-Means Clustering Algorithm has converged to a stable solution
  • 10.
    BOOSTING MODEL’S PERFORMANCE& LIMITATIONS In this stable state, scores can be increased at the upper ranges of the clusters, but will result to overfitting the model to the dataset To avoid this outcome, the conservative number of 3 Clusters was chosen (Silhouette Score = 0.217) instead
  • 11.
    FINDINGS & CONCLUSIONS •Maximum income of customer base is $100,000/annum • For customers in the age range of 30 to 55, half of these earned below $50,000/annum, who could be price sensitive and are bargain hunters, while the other half earned above this threshold, who may be able to pay a premium for quality • Higher concentration of customers is found to have undergraduate degrees, who are more educated, and they are separated equally into two clusters: singles, with more ability for discretionary spending, and married couples, with less spending power given children/teens in their households • Customers above 55 are even distributed across all income groups * More comprehensive findings and conclusions were provided in the project report, which are not released at the request of the Social Enterprise
  • 12.
    RECOMMENDATIONS* Segment 1 -Customers in the age range of 30 to 55 who earned below $50,000/annum • Offer value-for-money products and services • Highlight discounts and promotions • Offer bundle deals and loyalty programs • Target them with personalised marketing campaigns based on their purchase history and interests * More recommendations were provided for each identified cluster in the project report, which are not released at the request of the Social Enterprise Segment 3 - Customers with undergraduate degrees • Offer educational and informative content • Highlight the benefits of products and services for their careers and personal development • Partner with other businesses that offer complementary products and services • Target them with personalised marketing campaigns based on their interests and areas of expertise
  • 13.
    K-MEANS CLUSTERING WITH ORANGE IDENTIFYCUSTOMER SEGMENTS OF A SOCIAL ENTERPRISE TO CREATE CUSTOMER OFFERS FOR EACH SEGMENT AUTHOR: ANTHONY MOK DATE: 18 NOV 2023 EMAIL: XXIAOHAO@YAHOO.COM