Target Corporation.pdf
•
0 likes•6 views

TGT Stock Forecast & Price: Based on the Target Corporation stock forecasts from 25 analysts, the average analyst target price for Target Corporation is USD 207.69 over the next 12 months. Target Corporation’s average analyst rating is Strong Buy. Stock Target Advisor’s own stock analysis of Target Corporation is Bullish , which is based on 12 positive signals and 3 negative signals. At the last closing, Target Corporation’s stock price was USD 167.50. Target Corporation’s stock price has changed by -3.21% over the past week, +6.36% over the past month and -33.31% over the last year.

Recommended
Recommended
More Related Content
Similar to Target Corporation.pdf
Similar to Target Corporation.pdf (20)
More from Stocktargetadvisor.com
More from Stocktargetadvisor.com (20)
Recently uploaded
Recently uploaded (20)
Target Corporation.pdf
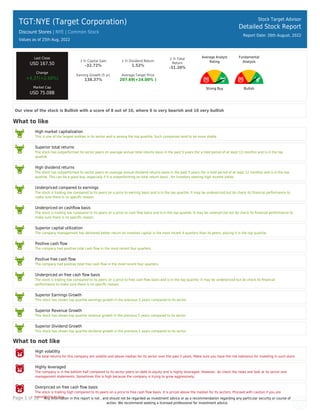
- 1. Page 1 of 10 Any information in this report is not , and should not be regarded as investment advice or as a recommendation regarding any particular security or course of action. We recommend seeking a licensed professional for investment advice. TGT:NYE (Target Corporation) Discount Stores | NYE | Common Stock Values as of 25th Aug, 2022 Stock Target Advisor Detailed Stock Report Report Date: 26th August, 2022 Last Close USD 167.50 Change +4.37(+2.68%) Market Cap USD 75.08B 1 Yr Capital Gain -32.72% 1 Yr Dividend Return 1.52% 1 Yr Total Return -31.20% Earning Growth (5 yr) 138.37% Average Target Price 207.69(+24.00% ) Average Analyst Rating Strong Buy Fundamental Analysis Bullish Our view of the stock is Bullish with a score of 8 out of 10, where 0 is very bearish and 10 very bullish What to like High market capitalization This is one of the largest entities in its sector and is among the top quartile. Such companies tend to be more stable. Superior total returns The stock has outperformed its sector peers on average annual total returns basis in the past 5 years (for a hold period of at least 12 months) and is in the top quartile. High dividend returns The stock has outperformed its sector peers on average annual dividend returns basis in the past 5 years (for a hold period of at least 12 months) and is in the top quartile. This can be a good buy, especially if it is outperforming on total return basis , for investors seeking high income yields. Underpriced compared to earnings The stock is trading low compared to its peers on a price to earning basis and is in the top quartile. It may be underpriced but do check its financial performance to make sure there is no specific reason. Underpriced on cashflow basis The stock is trading low compared to its peers on a price to cash flow basis and is in the top quartile. It may be underpriced but do check its financial performance to make sure there is no specific reason. Superior capital utilization The company management has delivered better return on invested capital in the most recent 4 quarters than its peers, placing it in the top quartile. Positive cash flow The company had positive total cash flow in the most recent four quarters. Positive free cash flow The company had positive total free cash flow in the most recent four quarters. Underpriced on free cash flow basis The stock is trading low compared to its peers on a price to free cash flow basis and is in the top quartile. It may be underpriced but do check its financial performance to make sure there is no specific reason. Superior Earnings Growth This stock has shown top quartile earnings growth in the previous 5 years compared to its sector. Superior Revenue Growth This stock has shown top quartile revenue growth in the previous 5 years compared to its sector. Superior Dividend Growth This stock has shown top quartile dividend growth in the previous 5 years compared to its sector What to not like High volatility The total returns for this company are volatile and above median for its sector over the past 5 years. Make sure you have the risk tolerance for investing in such stock. Highly leveraged The company is in the bottom half compared to its sector peers on debt to equity and is highly leveraged. However, do check the news and look at its sector and management statements. Sometimes this is high because the company is trying to grow aggressively. Overpriced on free cash flow basis The stock is trading high compared to its peers on a price to free cash flow basis. It is priced above the median for its sectors. Proceed with caution if you are considering to buy.
- 2. Page 2 of 10 Any information in this report is not , and should not be regarded as investment advice or as a recommendation regarding any particular security or course of action. We recommend seeking a licensed professional for investment advice.
- 3. Page 3 of 10 Any information in this report is not , and should not be regarded as investment advice or as a recommendation regarding any particular security or course of action. We recommend seeking a licensed professional for investment advice. TGT:NYE (Target Corporation) Discount Stores | | Common Stock Stock Target Advisor Detailed Stock Report Report Date: 26th August, 2022 Adjusted Closing Share Volume Relative Returns Relative Performance (Total Returns) Security Capital Gain Dividend Return Total Return TGT Target Corporation -33.3% +1.5% -31.8% VTI Vanguard Total Stock Market Index Fund ETF Shares -9.1% +1.3% -7.8% Company Overview Target Corporation operates as a general merchandise retailer in the United States. The company offers food assortments, including perishables, dry grocery, dairy, and frozen items; apparel, accessories, home décor products, electronics, toys, seasonal offerings, food, and other merchandise; and beauty and household essentials. It also provides in-store amenities, such as Target Café, Target Optical, Starbucks, and other food service offerings. The company sells its products through its stores; and digital channels, including Target.com. As of March 09, 2022, the company operated approximately 2,000 stores. Target Corporation was incorporated in 1902 and is headquartered in Minneapolis, Minnesota.
- 4. Page 4 of 10 Any information in this report is not , and should not be regarded as investment advice or as a recommendation regarding any particular security or course of action. We recommend seeking a licensed professional for investment advice. Company Website https://corporate.target.com Address 1000 Nicollet Mall, Minneapolis, MN, United States, 55403 Fiscal Year End January Employees 450000 Technical Indicators Value Value Beta 1.03 52 Week High 264.16 Short Ratio 1.93 52 Week Low 136.31 Shorted Shares 6,726,711 200 Day Moving Average 202.55 Shorted Shares Previous Month 7,826,314 50 Day Moving Average 155.69 Shares Held By Insiders 21.10% Short Percentage 2.00% Shares Held by Institutions 80.26 Dividend Yield 2.67%
- 5. Page 5 of 10 Any information in this report is not , and should not be regarded as investment advice or as a recommendation regarding any particular security or course of action. We recommend seeking a licensed professional for investment advice. TGT:NYE (Target Corporation) Discount Stores | | Common Stock Stock Target Advisor Detailed Stock Report Report Date: 26th August, 2022 Market Performance Market Performance vs. Industry / Classification (Discount Stores) Market Performance vs. Exchange (Nasdaq Global Select) Value Sector Median Percentile Rank Grade Market Median Percentile Rank Grade YTD Capital Gain -27.63% -27.6% 40% -11.9% 16% Dividend Return 1.24% 1.2% 75% 1.8% 38% Total Return -26.38% -26.4% 40% -10.4% 16% Trailing 12 Months Capital Gain -32.72% -32.7% 40% -10.9% 15% Dividend Return 1.52% 1.5% 75% 2.8% 30% Total Return -31.20% -31.2% 40% -8.3% 14% Trailing 5 Years Capital Gain 204.49% 72.8% 75% 6.7% 95% Dividend Return 25.16% 11.9% 100% 12.9% 81% Total Return 229.65% 87.1% 100% 21.8% 95% Average Annual (5 Year Horizon) Capital Gain 36.86% 15.5% 100% 3.0% 92% Dividend Return 2.70% 2.0% 75% 2.2% 60% Total Return 39.56% 18.8% 100% 6.4% 92% Risk Return Profile Volatility (Standard Deviation) 35.07% 32.0% 40% 22.5% 30% Risk Adjusted Return 112.80% N/A 60% 33.1% 98% Market Capitalization 75.08B 56.17B 80% 9.76B 97%
- 6. Page 6 of 10 Any information in this report is not , and should not be regarded as investment advice or as a recommendation regarding any particular security or course of action. We recommend seeking a licensed professional for investment advice. Key Financial Ratios Ratios vs. Industry / Classification (Computer Hardware) Ratios vs. Exchange (Nasdaq Global Select) Value Sector Median Percentile Rank Grade Market Median Percentile Rank Grade Market Value peratio 18.5 20.4 80% 16.3 42% pbratio 7.0 9.4 60% 1.6 10% pcfratio 8.7 11.7 80% 7.1 44% pfcfratio 10.7 15.1 100% 8.2 40% Management Effectiveness retequity 33.19% 33.2% 60% 9.9% 87% retinvcap 26.92% 24.1% 80% 5.7% 91% retass 7.09% 7.1% 60% 2.6% 80% debtequityratio 105.63% 66.6% 40% 68.4% 34% Technical Ratios yield 2.67% 1.7% 75% 3.3% 42% sratio 1.93 3.26 80% 2.53 58% spercent 1.45% 5.8% 80% 3.9% 73% beta 1.03 1.03 40% 1.04 51%
- 7. Page 7 of 10 Any information in this report is not , and should not be regarded as investment advice or as a recommendation regarding any particular security or course of action. We recommend seeking a licensed professional for investment advice. TGT:NYE (Target Corporation) Discount Stores | | Common Stock Stock Target Advisor Detailed Stock Report Report Date: 26th August, 2022 Recent Analyst Ratings Price Action Rating Action Analyst Rating Price date Target Raised by Guggenheim Securities USD 190 2022-08-22 Target Up JP Morgan & Company USD 210 2022-08-22 Target Raised by D.A. Davidson USD 203 2022-08-22 Target Raised by Cowen USD 210 2022-08-22 Target Raised by Raymond James Capital Strong-Buy USD 190 » USD 200 2022-08-18 Target Lowered by RBC Royalbank Outperform USD 231 » USD 223 2022-08-18 Maintains Stifel Nicolaus Research Hold USD 185 » USD 195 2022-08-18 Target Raised by Goldman Sachs Buy USD 155 » USD 205 2022-08-18 Reiterated Deutsche Bank Capital Buy USD 195 » USD 193 2022-08-18 Reiterated Jefferies Financial LLC Hold USD 161 » USD 170 2022-08-18 Reiterated Truist Securities Hold USD 150 » USD 165 2022-08-18 Reiterated Bank of America Securities Neutral USD 165 » USD 180 2022-08-18 Reiterated MKM Partners Neutral USD 163 » USD 161 2022-08-18 Target Raised by JP Morgan & Company Overweight USD 180 » USD 190 2022-08-09 Upgrades Wells Fargo Overweight 2022-08-09 Upgraded by Wells Fargo Equal Weight » Overweight USD 195 2022-08-01 Maintains Tigress Financial Buy USD 320 » USD 215 2022-07-29 Initiates Coverage On Piper Sandler Neutral USD 190 2022-07-22 Reiterated Barclays Overweight USD 200 » USD 175 2022-06-08 Downgraded by Bank of America Securities Buy » Neutral USD 235 » USD 165 2022-06-08 Maintains Telsey Advisory Group Outperform USD 200 » USD 185 2022-06-08 Target Lowered by Raymond James Capital Strong-Buy USD 205 » USD 190 2022-06-08 Maintains Citigroup Buy USD 188 » USD 184 2022-06-08 Reiterated Robert W Baird Outperform USD 195 » USD 180 2022-06-08 Maintains Truist Securities Hold USD 171 » USD 150 2022-06-08
- 8. Page 8 of 10 Any information in this report is not , and should not be regarded as investment advice or as a recommendation regarding any particular security or course of action. We recommend seeking a licensed professional for investment advice. TGT:NYE (Target Corporation) Discount Stores | | Common Stock Stock Target Advisor Detailed Stock Report Report Date: 26th August, 2022 Annual Financial (USD)
- 9. Page 9 of 10 Any information in this report is not , and should not be regarded as investment advice or as a recommendation regarding any particular security or course of action. We recommend seeking a licensed professional for investment advice. TGT:NYE (Target Corporation) Discount Stores | | Common Stock Stock Target Advisor Detailed Stock Report Report Date: 26th August, 2022 Quarterly Financial (USD)
- 10. Page 10 of 10 Any information in this report is not , and should not be regarded as investment advice or as a recommendation regarding any particular security or course of action. We recommend seeking a licensed professional for investment advice. TGT:NYE (Target Corporation) Discount Stores | | Common Stock Stock Target Advisor Detailed Stock Report Report Date: 26th August, 2022 Largest Industry Peers for Discount Stores Symbol Company Name Price(Change) Market Cap WMT Walmart Inc +0.90 (+0.7%) USD 369.97B DG Dollar General Corporation -1.37 (-0.6%) USD 56.17B BJ BJs Wholesale Club Holdings In.. +0.30 (+0.4%) USD 9.76B BIG Big Lots Inc +0.52 (+2.3%) USD 0.66B 2651 Lawson Inc N/A N/A 2782 Seria Co Ltd N/A N/A 7532 Pan Pacific International Hold.. N/A N/A ETFs Containing TGT Symbol Company Name Weight Mer Price(Change) Market Cap ZLU.U:CA 1.46 % 0.33 % N/A N/A CUD.A:CA 0.00 % 1.48 % N/A N/A IBCZ:F iShares IV Public Limited Comp.. 0.00 % 0.00 % +0.08 (+1.2%) USD 0.46B FLXU:XETRA Franklin LibertyShares ICAV - .. 0.00 % 0.00 % +0.14 (+1.2%) USD 0.11B ZPDD:F SPDR S&P U.S. Consumer Discret.. 0.00 % 0.00 % +0.71 (+1.2%) USD 0.09B QDVK:F iShares V Public Limited Compa.. 0.00 % 0.00 % +0.17 (+1.2%) USD 0.31B QDVI:F iShares IV Public Limited Comp.. 0.00 % 0.00 % +0.06 (+1.2%) USD 6.31B LMWE:F Lyxor FTSE EPRA/NAREIT Global .. 0.00 % 0.00 % +0.39 (+1.2%) N/A IS07:F iShares IV Public Limited Comp.. 0.00 % 0.00 % +0.12 (+1.2%) N/A IBCY:F iShares IV Public Limited Comp.. 0.00 % 0.00 % +0.10 (+1.2%) USD 0.12B The Stock Target Advisor platform run millions of calculations every day on over 30,000 Canadian and American stocks, comparing and ranking their financial and market performance against their sectors and exchange. We represent the percentile ranking using the following grading system. Letter Grade Percentage Letter Grade Percentage Letter Grade Percentage A+ 97%-100% A 93%-96% A- 90%-92% B+ 97%-89% B 83%-86% B- 80%-82% C+ 77%-79% C 73%-76% C- 70%-72% D+ 67%-69% D 63%-66% D- 60%-62% F 0%-59%