This report provides a detailed analysis of Apple Inc. (AAPL) stock. It finds the stock to be slightly bullish overall, rating it 6.7 out of 10. Strengths include its large market capitalization, superior risk-adjusted returns, and strong financial ratios. However, the stock is also considered overpriced relative to some valuation metrics. Recent analyst ratings are mixed, with most setting price targets between $150-210.
Apple Inc. designs, manufactures, and markets smartphones, personal computers, tablets, wearables, and accessories worldwide. It also sells various related services. Based on the Apple Inc stock forecasts from 29 analysts, the average analyst target price for Apple Inc is USD 186.96 over the next 12 months. Apple Inc’s average analyst rating is Strong Buy. Stock Target Advisor’s own stock analysis of Apple Inc is Slightly Bullish , which is based on 10 positive signals and 5 negative signals. At the last closing, Apple Inc’s stock price was USD 143.11. Apple Inc’s stock price has changed by -1.67% over the past week, -11.55% over the past month and +14.10% over the last year.
Apple Inc. designs, manufactures, and markets smartphones, personal computers, tablets, wearables, and accessories worldwide. It also sells various related services. In addition, the company offers iPhone, a line of smartphones.
Based on the Apple Inc stock forecasts from 27 analysts, the average analyst target price for Apple Inc is USD 183.58 over the next 12 months. Apple Inc’s average analyst rating is Strong Buy. Stock Target Advisor’s own stock analysis of Apple Inc is Slightly Bullish , which is based on 10 positive signals and 5 negative signals. At the last closing, Apple Inc’s stock price was USD 130.06. Apple Inc’s stock price has changed by -8.82% over the past week, -10.64% over the past month and -0.07% over the last year.
Based on the Apple Inc stock forecasts from 21 analysts, the average analyst target price for Apple Inc is USD 177.17 over the next 12 months. Apple Inc’s average analyst rating is Strong Buy. Stock Target Advisor’s own stock analysis of Apple Inc is Slightly Bullish , which is based on 10 positive signals and 5 negative signals. At the last closing, Apple Inc’s stock price was USD 171.52. Apple Inc’s stock price has changed by -0.34% over the past week, +10.41% over the past month and +15.74% over the last year.
Apple Inc. designs, manufactures, and markets smartphones, personal computers, tablets, wearables, and accessories worldwide. It also sells various related services. In addition, the company offers iPhone, a line of smartphones; Mac, a line of personal computers; iPad, a line of multi-purpose tablets; AirPods Max, an over-ear wireless headphone; and wearables, home, and accessories comprising AirPods, Apple TV, Apple Watch, Beats products, HomePod, and iPod touch.
Based on the Apple Inc stock forecasts from 28 analysts, the average analyst target price for Apple Inc is USD 189.83 over the next 12 months. Apple Inc’s average analyst rating is Strong Buy. Stock Target Advisor’s own stock analysis of Apple Inc is Slightly Bullish , which is based on 10 positive signals and 6 negative signals. At the last closing, Apple Inc’s stock price was USD 140.82. Apple Inc’s stock price has changed by -3.88% over the past week, -14.69% over the past month and +12.79% over the last year.
Based on the Apple stock forecast from 21 analysts, the average analyst target price for Apple is USD 177.02 over the next 12 months. Apple average analyst rating is Strong Buy. Stock Target Advisor’s own stock analysis of Apple is Slightly Bullish , which is based on 10 positive signals and 5 negative signals. At the last closing, Apple stock price was USD 170.03. Apple stock price has changed by -2.37% over the past week, +11.17% over the past month and +14.61% over the last year.
Based on the Apple Inc stock forecasts from 28 analysts, the average analyst target price for Apple Inc is USD 190.48 over the next 12 months. Apple Inc’s average analyst rating is Strong Buy. Stock Target Advisor’s own stock analysis of Apple Inc is Slightly Bullish , which is based on 10 positive signals and 6 negative signals. At the last closing, Apple Inc’s stock price was USD 147.11. Apple Inc’s stock price has changed by -6.47% over the past week, -11.00% over the past month and +15.43% over the last year.
Based on the Apple Inc stock forecasts from 22 analysts, the average analyst target price for Apple Inc is USD 175.41 over the next 12 months. Apple Inc’s average analyst rating is Strong Buy. Stock Target Advisor’s own stock analysis of Apple Inc is Bullish , which is based on 10 positive signals and 4 negative signals. At the last closing, Apple Inc’s stock price was USD 142.48. Apple Inc’s stock price has changed by -6.72% over the past week, -11.71% over the past month and -0.25% over the last year.
AAPL Stock Forecast & Price:
Based on the Apple stock forecast from 22 analysts, the average analyst target price for Apple Inc is USD 175.41 over the next 12 months. Apple Inc’s average analyst rating is Strong Buy. Stock Target Advisor’s own stock analysis of Apple Inc is Bullish , which is based on 11 positive signals and 4 negative signals. At the last closing, Apple Inc’s stock price was USD 138.20. Apple Inc’s stock price has changed by -8.13% over the past week, -11.30% over the past month and -3.12% over the last year.
Digital Turbine, Inc., through its subsidiaries, provides media and mobile communication products and solutions for mobile operators, application advertisers, publishers, device original equipment manufacturers (OEMs), and other third parties. Its application media software platform that enables mobile operators and OEMs to control, manage, and monetize devices.
Based on the Digital Turbine Inc stock forecasts from 3 analysts, the average analyst target price for Digital Turbine Inc is USD 63.00 over the next 12 months. Digital Turbine Inc’s average analyst rating is Strong Buy. Stock Target Advisor’s own stock analysis of Digital Turbine Inc is Slightly Bullish , which is based on 9 positive signals and 5 negative signals. At the last closing, Digital Turbine Inc’s stock price was USD 19.68. Digital Turbine Inc’s stock price has changed by -16.79% over the past week, -37.82% over the past month and -70.93% over the last year.
NVDA Stock Forecast & Price:
Based on the NVIDIA Corporation stock forecasts from 32 analysts, the average analyst target price for NVIDIA Corporation is USD 240.81 over the next 12 months. NVIDIA Corporation’s average analyst rating is Strong Buy. Stock Target Advisor’s own stock analysis of NVIDIA Corporation is Neutral, which is based on 8 positive signals and 8 negative signals. At the last closing, NVIDIA Corporation’s stock price was USD 162.60. NVIDIA Corporation’s stock price has changed by -8.90% over the past week, -9.59% over the past month and -28.17% over the last year.
NVDA Stock Forecast & Price:
Based on the NVDA stock forecast from 34 analysts, the average analyst target price for NVIDIA Corporation is USD 226.41 over the next 12 months. NVIDIA Corporation’s average analyst rating is Strong Buy. Stock Target Advisor’s own stock analysis of NVIDIA Corporation is Slightly Bullish , which is based on 10 positive signals and 7 negative signals. At the last closing, NVIDIA Corporation’s stock price was USD 121.39. NVIDIA Corporation’s stock price has changed by -3.01% over the past week, -11.05% over the past month and -41.48% over the last year.
Cisco Systems, Inc. designs, manufactures, and sells Internet Protocol based networking and other products related to the communications and information technology industry in the Americas, Europe, the Middle East, Africa, the Asia Pacific, Japan, and China.
Based on the Cisco Systems Inc stock forecasts from 19 analysts, the average analyst target price for Cisco Systems Inc is USD 52.64 over the next 12 months. Cisco Systems Inc’s average analyst rating is Buy . Stock Target Advisor’s own stock analysis of Cisco Systems Inc is Bullish , which is based on 11 positive signals and 4 negative signals. At the last closing, Cisco Systems Inc’s stock price was USD 48.70. Cisco Systems Inc’s stock price has changed by +4.48% over the past week, +9.24% over the past month and -16.35% over the last year.
Based on the Cenovus Energy Inc stock forecasts from 12 analysts, the average analyst target price for Cenovus Energy Inc is USD 24.29 over the next 12 months. Cenovus Energy Inc’s average analyst rating is Strong Buy. Stock Target Advisor’s own stock analysis of Cenovus Energy Inc is Slightly Bearish, which is based on 5 positive signals and 11 negative signals. At the last closing, Cenovus Energy Inc’s stock price was USD 20.63. Cenovus Energy Inc’s stock price has changed by +10.26% over the past week, +18.09% over the past month and +156.59% over the last year.
NVIDIA Corporation provides graphics, and compute and networking solutions in the United States, Taiwan, China, and internationally. The company's Graphics segment offers GeForce GPUs for gaming and PCs, the GeForce NOW game streaming service and related infrastructure, and solutions for gaming platforms.
Based on the NVIDIA Corporation stock forecasts from 30 analysts, the average analyst target price for NVIDIA Corporation is USD 273.00 over the next 12 months. NVIDIA Corporation’s average analyst rating is Strong Buy. Stock Target Advisor’s own stock analysis of NVIDIA Corporation is Slightly Bullish , which is based on 10 positive signals and 8 negative signals. At the last closing, NVIDIA Corporation’s stock price was USD 188.11. NVIDIA Corporation’s stock price has changed by +11.32% over the past week, +1.42% over the past month and +15.80% over the last year.
MSFT Stock Forecast & Price:
Based on the Microsoft Corporation stock forecast from 27 analysts, the average analyst target price for Microsoft Corporation is USD 322.01 over the next 12 months. Microsoft Corporation’s average analyst rating is Strong Buy. Stock Target Advisor’s own stock analysis of Microsoft Corporation is Bullish , which is based on 10 positive signals and 4 negative signals. At the last closing, Microsoft Corporation’s stock price was USD 229.25. Microsoft Corporation’s stock price has changed by -4.77% over the past week, -13.31% over the past month and -22.25% over the last year.
LUMN Stock Forecast & Price:
Based on the LUMN stock forecast from 3 analysts, the average analyst target price for Lumen Technologies Inc is USD 9.00 over the next 12 months. Lumen Technologies Inc’s average analyst rating is Under-perform. Stock Target Advisor’s own stock analysis of Lumen Technologies Inc is Slightly Bullish , which is based on 6 positive signals and 4 negative signals. At the last closing, Lumen Technologies Inc’s stock price was USD 7.28. Lumen Technologies Inc’s stock price has changed by -10.46% over the past week, -26.09% over the past month and -42.59% over the last year.
Microsoft Corporation develops, licenses, and supports software, services, devices, and solutions worldwide. Its Productivity and Business Processes segment offers Office, Exchange, SharePoint, Microsoft Teams, Office 365 Security and Compliance, and Skype for Business.
Based on the Microsoft Corporation stock forecasts from 19 analysts, the average analyst target price for Microsoft Corporation is USD 347.83 over the next 12 months. Microsoft Corporation’s average analyst rating is Strong Buy. Stock Target Advisor’s own stock analysis of Microsoft Corporation is Slightly Bullish , which is based on 9 positive signals and 4 negative signals. At the last closing, Microsoft Corporation’s stock price was USD 252.99. Microsoft Corporation’s stock price has changed by -6.31% over the past week, -0.92% over the past month and -1.90% over the last year.
Based on the Microsoft Corporation stock forecasts from 19 analysts, the average analyst target price for Microsoft Corporation is USD 353.32 over the next 12 months. Microsoft Corporation’s average analyst rating is Strong Buy. Stock Target Advisor’s own stock analysis of Microsoft Corporation is Bullish , which is based on 10 positive signals and 4 negative signals. At the last closing, Microsoft Corporation’s stock price was USD 261.12. Microsoft Corporation’s stock price has changed by -4.95% over the past week, -6.69% over the past month and +5.23% over the last year.
Based on the Microsoft Corporation stock forecasts from 18 analysts, the average analyst target price for Microsoft Corporation is USD 353.32 over the next 12 months. Microsoft Corporation’s average analyst rating is Strong Buy. Stock Target Advisor’s own stock analysis of Microsoft Corporation is Bullish , which is based on 10 positive signals and 4 negative signals. At the last closing, Microsoft Corporation’s stock price was USD 261.50. Microsoft Corporation’s stock price has changed by -1.16% over the past week, -6.55% over the past month and +5.38% over the last year.
Microsoft Corporation develops, licenses, and supports software, services, devices, and solutions worldwide. Its Productivity and Business Processes segment offers Office, Exchange, SharePoint, Microsoft Teams, Office 365 Security and Compliance.
Based on the Microsoft Corporation stock forecasts from 19 analysts, the average analyst target price for Microsoft Corporation is USD 346.94 over the next 12 months. Microsoft Corporation’s average analyst rating is Strong Buy. Stock Target Advisor’s own stock analysis of Microsoft Corporation is Slightly Bullish , which is based on 9 positive signals and 4 negative signals. At the last closing, Microsoft Corporation’s stock price was USD 247.65. Microsoft Corporation’s stock price has changed by -2.11% over the past week, -2.17% over the past month and -4.54% over the last year.
Albemarle Corporation develops, manufactures, and markets engineered specialty chemicals worldwide. It operates through three segments: Lithium, Bromine, and Catalysts. The Lithium segment offers lithium compounds, including lithium carbonate, lithium hydroxide.
Based on the Albemarle Corporation stock forecasts from 13 analysts, the average analyst target price for Albemarle Corporation is USD 261.86 over the next 12 months. Albemarle Corporation’s average analyst rating is Hold . Stock Target Advisor’s own stock analysis of Albemarle Corporation is Slightly Bearish, which is based on 5 positive signals and 11 negative signals. At the last closing, Albemarle Corporation’s stock price was USD 243.15. Albemarle Corporation’s stock price has changed by +1.64% over the past week, +21.19% over the past month and +52.36% over the last year.
NIO Stock Forecast & Price:
Based on the Nio Inc Class A ADR stock forecasts from 8 analysts, the average analyst target price for Nio Inc Class A ADR is USD 38.73 over the next 12 months. Nio Inc Class A ADR’s average analyst rating is Strong Buy. Stock Target Advisor’s own stock analysis of Nio Inc Class A ADR is Slightly Bearish, which is based on 3 positive signals and 6 negative signals. At the last closing, Nio Inc Class A ADR’s stock price was USD 19.92. Nio Inc Class A ADR’s stock price has changed by +4.57% over the past week, +2.21% over the past month and -47.65% over the last year.
Microsoft Corporation develops, licenses, and supports software, services, devices, and solutions worldwide. Its Productivity and Business Processes segment offers Office, Exchange, SharePoint, Microsoft Teams, Office 365 Security and Compliance, and Skype for Business. Based on the Microsoft Corporation stock forecasts from 18 analysts, the average analyst target price for Microsoft Corporation is USD 349.33 over the next 12 months. Microsoft Corporation’s average analyst rating is Strong Buy. Stock Target Advisor’s own stock analysis of Microsoft Corporation is Slightly Bullish , which is based on 9 positive signals and 4 negative signals. At the last closing, Microsoft Corporation’s stock price was USD 260.65. Microsoft Corporation’s stock price has changed by -0.33% over the past week, -4.88% over the past month and +6.31% over the last year.
Autodesk, Inc. provides 3D design, engineering, and entertainment software and services worldwide. The company offers AutoCAD Civil 3D, a surveying, design, analysis, and documentation solution for civil engineering, including land development and transportation.
Based on the Autodesk Inc stock forecasts from 19 analysts, the average analyst target price for Autodesk Inc is USD 307.36 over the next 12 months. Autodesk Inc’s average analyst rating is Strong Buy. Stock Target Advisor’s own stock analysis of Autodesk Inc is Slightly Bullish , which is based on 9 positive signals and 5 negative signals. At the last closing, Autodesk Inc’s stock price was USD 195.64. Autodesk Inc’s stock price has changed by +4.95% over the past week, -0.55% over the past month and -28.80% over the last year.
Based on the Progress Software Corporation stock forecasts from 5 analysts, the average analyst target price for Progress Software Corporation is USD 52.00 over the next 12 months. Progress Software Corporation’s average analyst rating is Strong Buy. Stock Target Advisor’s own stock analysis of Progress Software Corporation is Slightly Bullish , which is based on 7 positive signals and 5 negative signals. At the last closing, Progress Software Corporation’s stock price was USD 42.36. Progress Software Corporation’s stock price has changed by -1.49% over the past week, -12.84% over the past month and -13.13% over the last year.
CRM Stock Forecast & Price:
Based on the Salesforce.com stock forecasts from 31 analysts, the average analyst target price for Salesforce.com is USD 241.56 over the next 12 months. Salesforce.com average analyst rating is Strong Buy. Stock Target Advisor’s own stock analysis of Salesforce.com is Slightly Bullish , which is based on 7 positive signals and 4 negative signals. At the last closing, Salesforce.com stock price was USD 173.91. Salesforce.com stock price has changed by -7.46% over the past week, -1.91% over the past month and -33.33% over the last year.
DELL Stock Forecast & Price:
Based on the Dell Technologies Inc stock forecasts from 14 analysts, the average analyst target price for Dell Technologies Inc is USD 57.07 over the next 12 months. Dell Technologies Inc’s average analyst rating is Strong Buy. Stock Target Advisor’s own stock analysis of Dell Technologies Inc is Slightly Bullish , which is based on 6 positive signals and 5 negative signals. At the last closing, Dell Technologies Inc’s stock price was USD 41.43. Dell Technologies Inc’s stock price has changed by -13.09% over the past week, -6.90% over the past month and -57.27% over the last year.
Amazon.com, Inc. engages in the retail sale of consumer products and subscriptions in North America and internationally. The company operates through three segments: North America, International, and Amazon Web Services (AWS). It sells merchandise and content purchased for resale from third-party sellers through physical and online stores.
Based on the Amazon.com Inc stock forecasts from 30 analysts, the average analyst target price for Amazon.com Inc is USD 177.50 over the next 12 months. Amazon.com Inc’s average analyst rating is Strong Buy. Stock Target Advisor’s own stock analysis of Amazon.com Inc is Slightly Bullish , which is based on 8 positive signals and 5 negative signals. At the last closing, Amazon.com Inc’s stock price was USD 124.79. Amazon.com Inc’s stock price has changed by -94.58% over the past week, -94.56% over the past month and -22.16% over the last year.
Terreno Realty Corporation and together with its subsidiaries, the "Company") acquires, owns and operates industrial real estate in six major coastal U.S. markets: Los Angeles, Northern New Jersey/New York City, San Francisco Bay Area, Seattle, Miami, and Washington, D.C. All square feet, acres, occupancy and number of properties disclosed in these condensed notes to the consolidated financial statements are unaudited.
Based on the Terreno Realty Corporation stock forecasts from 6 analysts, the average analyst target price for Terreno Realty Corporation is USD 77.14 over the next 12 months. Terreno Realty Corporation’s average analyst rating is Buy . Stock Target Advisor’s own stock analysis of Terreno Realty Corporation is Slightly Bearish, which is based on 6 positive signals and 8 negative signals. At the last closing, Terreno Realty Corporation’s stock price was USD 55.50. Terreno Realty Corporation’s stock price has changed by -3.81% over the past week, -7.00% over the past month and -14.69% over the last year.
Core & Main, Inc. distributes water, wastewater, storm drainage, and fire protection products and related services to municipalities, private water companies, and professional contractors in the municipal, non-residential, and residential end markets in the United States.
Based on the Core & Main Inc stock forecasts from 7 analysts, the average analyst target price for Core & Main Inc is USD 29.18 over the next 12 months. Core & Main Inc’s average analyst rating is Strong Buy. Stock Target Advisor’s own stock analysis of Core & Main Inc is Slightly Bearish, which is based on 3 positive signals and 7 negative signals. At the last closing, Core & Main Inc’s stock price was USD 20.71. Core & Main Inc’s stock price has changed by -7.54% over the past week, -4.78% over the past month and 0% over the last year.
Stock Target Advisor’s own stock analysis of ProShares Metaverse ETF is Very Bearish, which is based on 0 positive signals and 5 negative signals. At the last closing, ProShares Metaverse ETF’s stock price was USD 32.42. ProShares Metaverse ETF’s stock price has changed by -5.18% over the past week, -6.21% over the past month and +32,315.00% over the last year.
Verseon Corporation, a pharmaceutical company, designs and develops novel therapeutics for various diseases in the United States.
The fund invests in financial instruments that ProShare Advisors believes, in combination, should produce daily returns consistent with the fund's investment objective.
Stock Target Advisor’s own stock analysis of ProShares Short Real Estate is Bearish, which is based on 1 positive signals and 3 negative signals. At the last closing, ProShares Short Real Estate’s stock price was USD 20.28. ProShares Short Real Estate’s stock price has changed by +5.02% over the past week, +6.23% over the past month and +8.23% over the last year.
Bragg Gaming Group Inc. operates as a technology and content supplier to the gaming industry worldwide.
Based on the Bragg Gaming Group Inc stock forecasts from 2 analysts, the average analyst target price for Bragg Gaming Group Inc is USD 15.33 over the next 12 months. Bragg Gaming Group Inc’s average analyst rating is Strong Buy. Stock Target Advisor’s own stock analysis of Bragg Gaming Group Inc is Very Bearish, which is based on 0 positive signals and 2 negative signals. At the last closing, Bragg Gaming Group Inc’s stock price was USD 4.77. Bragg Gaming Group Inc’s stock price has changed by -19.15% over the past week, -0.42% over the past month and 0% over the last year.
Brookline Bancorp, Inc. operates as a bank holding company for the Brookline Bank that provide commercial, business, and retail banking services to corporate, municipal, and retail customers in the United States. Its deposit products include demand checking, NOW, money market, and savings accounts.
Based on the Brookline Bancorp Inc stock forecasts from 1 analysts, the average analyst target price for Brookline Bancorp Inc is USD 18.00 over the next 12 months. Brookline Bancorp Inc’s average analyst rating is not available. Stock Target Advisor’s own stock analysis of Brookline Bancorp Inc is Bearish, which is based on 1 positive signals and 7 negative signals. At the last closing, Brookline Bancorp Inc’s stock price was USD 13.13. Brookline Bancorp Inc’s stock price has changed by -3.46% over the past week, -8.63% over the past month and -20.52% over the last year.
Tesla, Inc. designs, develops, manufactures, leases, and sells electric vehicles, and energy generation and storage systems in the United States, China, and internationally. The company operates in two segments, Automotive, and Energy Generation and Storage.
Based on the Tesla Inc stock forecasts from 30 analysts, the average analyst target price for Tesla Inc is USD 921.57 over the next 12 months. Tesla Inc’s average analyst rating is Buy . Stock Target Advisor’s own stock analysis of Tesla Inc is Slightly Bullish , which is based on 9 positive signals and 6 negative signals. At the last closing, Tesla Inc’s stock price was USD 639.30. Tesla Inc’s stock price has changed by -11.10% over the past week, -11.74% over the past month and +5.69% over the last year.
Moderna, Inc., a biotechnology company, discovers, develops, and commercializes messenger RNA therapeutics and vaccines for the treatment of infectious diseases, immuno-oncology, rare diseases, cardiovascular diseases, and auto-immune diseases in the United States, Europe, and internationally.
Based on the Moderna Inc stock forecasts from 11 analysts, the average analyst target price for Moderna Inc is USD 184.76 over the next 12 months. Moderna Inc’s average analyst rating is Hold . Stock Target Advisor’s own stock analysis of Moderna Inc is Bullish , which is based on 10 positive signals and 3 negative signals. At the last closing, Moderna Inc’s stock price was USD 121.08. Moderna Inc’s stock price has changed by -9.67% over the past week, -11.14% over the past month and -38.80% over the last year.
Bristol-Myers Squibb Company discovers, develops, licenses, manufactures, and markets biopharmaceutical products worldwide. It offers products for hematology, oncology, cardiovascular, immunology, fibrotic, neuroscience, and covid-19 diseases.
Based on the Bristol-Myers Squibb Company stock forecasts from 9 analysts, the average analyst target price for Bristol-Myers Squibb Company is USD 73.91 over the next 12 months. Bristol-Myers Squibb Company’s average analyst rating is Buy . Stock Target Advisor’s own stock analysis of Bristol-Myers Squibb Company is Slightly Bearish, which is based on 6 positive signals and 9 negative signals. At the last closing, Bristol-Myers Squibb Company’s stock price was USD 75.09. Bristol-Myers Squibb Company’s stock price has changed by -0.11% over the past week, -1.59% over the past month and +11.51% over the last year.
Five Below, Inc. operates as a specialty value retailer in the United States. It offers accessories, including socks, sunglasses, jewelry, scarves, gloves, hair accessories, athletic tops and bottoms, and t-shirts, as well as nail polishes, lip glosses, fragrances, and branded cosmetics.
Based on the Five Below Inc stock forecasts from 16 analysts, the average analyst target price for Five Below Inc is USD 197.68 over the next 12 months. Five Below Inc’s average analyst rating is Strong Buy. Stock Target Advisor’s own stock analysis of Five Below Inc is Slightly Bullish , which is based on 5 positive signals and 4 negative signals. At the last closing, Five Below Inc’s stock price was USD 127.45. Five Below Inc’s stock price has changed by -2.60% over the past week, -8.37% over the past month and -32.82% over the last year.
The Lovesac Company designs, manufactures, and sells furniture. It offers sactionals, such as seats and sides; sacs, including foam beanbag chairs; and accessories comprising drink holders, footsac blankets, decorative pillows, fitted seat tables, and ottomans.
Based on the The Lovesac Company stock forecasts from 5 analysts, the average analyst target price for The Lovesac Company is USD 105.29 over the next 12 months. The Lovesac Company’s average analyst rating is Strong Buy. Stock Target Advisor’s own stock analysis of The Lovesac Company is Bullish , which is based on 10 positive signals and 4 negative signals. At the last closing, The Lovesac Company’s stock price was USD 31.82. The Lovesac Company’s stock price has changed by -12.46% over the past week, -15.12% over the past month and -65.18% over the last year.
Ollie's Bargain Outlet Holdings, Inc. operates as a retailer of brand name merchandise. The company offers housewares, bed and bath, food, floor coverings, health and beauty aids, books and stationery, toys, and electronics; and other products.
Based on the Ollies Bargain Outlet Holdings Inc stock forecasts from 13 analysts, the average analyst target price for Ollies Bargain Outlet Holdings Inc is USD 55.65 over the next 12 months. Ollies Bargain Outlet Holdings Inc’s average analyst rating is Buy . Stock Target Advisor’s own stock analysis of Ollies Bargain Outlet Holdings Inc is Slightly Bearish, which is based on 7 positive signals and 9 negative signals. At the last closing, Ollies Bargain Outlet Holdings Inc’s stock price was USD 53.66. Ollies Bargain Outlet Holdings Inc’s stock price has changed by +13.23% over the past week, +21.95% over the past month and -38.62% over the last year.
Beam Global, a cleantech company, designs, develops, engineers, manufactures, and sells renewably energized products for electric vehicle (EV) charging infrastructure, outdoor media and branding, and energy security products.
Based on the Beam Global stock forecasts from 1 analysts, the average analyst target price for Beam Global is USD 25.00 over the next 12 months. Beam Global’s average analyst rating is not available. Stock Target Advisor’s own stock analysis of Beam Global is Bearish, which is based on 1 positive signals and 6 negative signals. At the last closing, Beam Global’s stock price was USD 19.26. Beam Global’s stock price has changed by +30.31% over the past week, +7.96% over the past month and -46.16% over the last year.
Rigel Pharmaceuticals, Inc., a biotechnology company, discovers and develops small molecule drugs to treat hematologic disorders, cancer, and rare immune diseases.
Based on the Rigel Pharmaceuticals Inc stock forecasts from 7 analysts, the average analyst target price for Rigel Pharmaceuticals Inc is USD 2.58 over the next 12 months. Rigel Pharmaceuticals Inc’s average analyst rating is Buy . Stock Target Advisor’s own stock analysis of Rigel Pharmaceuticals Inc is Slightly Bearish, which is based on 3 positive signals and 4 negative signals. At the last closing, Rigel Pharmaceuticals Inc’s stock price was USD 0.72. Rigel Pharmaceuticals Inc’s stock price has changed by -56.63% over the past week, -63.45% over the past month and -82.40% over the last year.
Block, Inc., together with its subsidiaries, creates tools that enables sellers to accept card payments and provides reporting and analytics, and next-day settlement. It provides hardware products, including Magstripe reader.
Based on the Block Inc stock forecasts from 32 analysts, the average analyst target price for Block Inc is USD 177.21 over the next 12 months. Block Inc’s average analyst rating is Strong Buy. Stock Target Advisor’s own stock analysis of Block Inc is Slightly Bullish , which is based on 6 positive signals and 5 negative signals. At the last closing, Block Inc’s stock price was USD 76.58. Block Inc’s stock price has changed by -12.42% over the past week, -8.68% over the past month and -63.57% over the last year.
Aldeyra Therapeutics, Inc., a biotechnology company, develops and commercializes medicines for immune-mediated ocular and systemic diseases. The company's lead product candidate is reproxalap.
Based on the Aldeyra The stock forecasts from 5 analysts, the average analyst target price for Aldeyra The is USD 19.67 over the next 12 months. Aldeyra The’s average analyst rating is Strong Buy. Stock Target Advisor’s own stock analysis of Aldeyra The is Bearish, which is based on 1 positive signals and 3 negative signals. At the last closing, Aldeyra The’s stock price was USD 3.86. Aldeyra The’s stock price has changed by +26.14% over the past week, +56.28% over the past month and -69.29% over the last year.
Couchbase, Inc. provides a database for enterprise applications worldwide. Its database works in multiple configurations, ranging from cloud to multi- or hybrid-cloud to on-premise environments to the edge.
Based on the Couchbase Inc stock forecasts from 8 analysts, the average analyst target price for Couchbase Inc is USD 24.53 over the next 12 months. Couchbase Inc’s average analyst rating is Buy . Stock Target Advisor’s own stock analysis of Couchbase Inc is Bearish, which is based on 1 positive signals and 3 negative signals. At the last closing, Couchbase Inc’s stock price was USD 16.00. Couchbase Inc’s stock price has changed by -0.56% over the past week, +12.36% over the past month and 0% over the last year.
Rigel Pharmaceuticals, Inc., a biotechnology company, discovers and develops small molecule drugs to treat hematologic disorders, cancer, and rare immune diseases.
Based on the Rigel Pharmaceuticals Inc stock forecasts from 5 analysts, the average analyst target price for Rigel Pharmaceuticals Inc is USD 3.25 over the next 12 months. Rigel Pharmaceuticals Inc’s average analyst rating is Buy . Stock Target Advisor’s own stock analysis of Rigel Pharmaceuticals Inc is Neutral, which is based on 3 positive signals and 3 negative signals. At the last closing, Rigel Pharmaceuticals Inc’s stock price was USD 0.70. Rigel Pharmaceuticals Inc’s stock price has changed by -59.77% over the past week, -68.47% over the past month and -82.46% over the last year.
Smartsheet Inc. provides cloud-based enterprise platform to plan, capture, manage, automate, and report on work for teams and organizations. The company offers Dashboards for real-time visibility into the status of work to align individuals, managers, and executives.
Based on the Smartsheet Inc stock forecasts from 13 analysts, the average analyst target price for Smartsheet Inc is USD 63.50 over the next 12 months. Smartsheet Inc’s average analyst rating is Strong Buy. Stock Target Advisor’s own stock analysis of Smartsheet Inc is Bearish, which is based on 1 positive signals and 3 negative signals. At the last closing, Smartsheet Inc’s stock price was USD 37.76. Smartsheet Inc’s stock price has changed by +4.22% over the past week, -13.51% over the past month and -40.00% over the last year.
Target Corporation operates as a general merchandise retailer in the United States. The company offers food assortments, including perishables, dry grocery, dairy, and frozen items.
Based on the Target Corporation stock forecasts from 25 analysts, the average analyst target price for Target Corporation is USD 216.11 over the next 12 months. Target Corporation’s average analyst rating is Strong Buy. Stock Target Advisor’s own stock analysis of Target Corporation is Very Bullish, which is based on 14 positive signals and 1 negative signals. At the last closing, Target Corporation’s stock price was USD 156.70. Target Corporation’s stock price has changed by +0.12% over the past week, -30.42% over the past month and -33.35% over the last year.
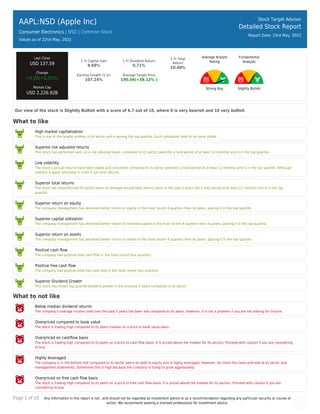
1. Page 1 of 10 Any information in this report is not , and should not be regarded as investment advice or as a recommendation regarding any particular security or course of
action. We recommend seeking a licensed professional for investment advice.
AAPL:NSD (Apple Inc)
Consumer Electronics | NSD | Common Stock
Values as of 22nd May, 2022
Stock Target Advisor
Detailed Stock Report
Report Date: 23rd May, 2022
Last Close
USD 137.59
Change
+0.00(+0.00%)
Market Cap
USD 2,226.92B
1 Yr Capital Gain
9.69%
1 Yr Dividend Return
0.71%
1 Yr Total
Return
10.40%
Earning Growth (5 yr)
107.24%
Average Target Price
190.04(+38.12% )
Average Analyst
Rating
Strong Buy
Fundamental
Analysis
Slightly Bullish
Our view of the stock is Slightly Bullish with a score of 6.7 out of 10, where 0 is very bearish and 10 very bullish
What to like
High market capitalization
This is one of the largest entities in its sector and is among the top quartile. Such companies tend to be more stable.
Superior risk adjusted returns
This stock has performed well, on a risk adjusted basis, compared to its sector peers(for a hold period of at least 12 months) and is in the top quartile.
Low volatility
The stock’s annual returns have been stable and consistent compared to its sector peers(for a hold period of at least 12 months) and is in the top quartile. Although
stability is good, also keep in mind it can limit returns.
Superior total returns
The stock has outperformed its sector peers on average annual total returns basis in the past 5 years (for a hold period of at least 12 months) and is in the top
quartile.
Superior return on equity
The company management has delivered better return on equity in the most recent 4 quarters than its peers, placing it in the top quartile.
Superior capital utilization
The company management has delivered better return on invested capital in the most recent 4 quarters than its peers, placing it in the top quartile.
Superior return on assets
The company management has delivered better return on assets in the most recent 4 quarters than its peers, placing it in the top quartile.
Positive cash flow
The company had positive total cash flow in the most recent four quarters.
Positive free cash flow
The company had positive total free cash flow in the most recent four quarters.
Superior Dividend Growth
This stock has shown top quartile dividend growth in the previous 5 years compared to its sector
What to not like
Below median dividend returns
The company’s average income yield over the past 5 years has been low compared to its peers. However, it is not a problem if you are not looking for income.
Overpriced compared to book value
The stock is trading high compared to its peers median on a price to book value basis.
Overpriced on cashflow basis
The stock is trading high compared to its peers on a price to cash flow basis. It is priced above the median for its sectors. Proceed with caution if you are considering
to buy.
Highly leveraged
The company is in the bottom half compared to its sector peers on debt to equity and is highly leveraged. However, do check the news and look at its sector and
management statements. Sometimes this is high because the company is trying to grow aggressively.
Overpriced on free cash flow basis
The stock is trading high compared to its peers on a price to free cash flow basis. It is priced above the median for its sectors. Proceed with caution if you are
considering to buy.
2. Page 2 of 10 Any information in this report is not , and should not be regarded as investment advice or as a recommendation regarding any particular security or course of
action. We recommend seeking a licensed professional for investment advice.
3. Page 3 of 10 Any information in this report is not , and should not be regarded as investment advice or as a recommendation regarding any particular security or course of
action. We recommend seeking a licensed professional for investment advice.
AAPL:NSD (Apple Inc)
Consumer Electronics | | Common Stock
Stock Target Advisor
Detailed Stock Report
Report Date: 23rd May, 2022
Adjusted Closing Share Volume
Relative Returns Relative Performance (Total Returns)
Security Capital Gain Dividend Return Total Return
AAPL
Apple Inc
+9.7% +0.7% +10.4%
QQQ
Invesco QQQ Trust Series 1
-11.7% +0.4% -11.3%
Company Overview
Apple Inc. designs, manufactures, and markets smartphones, personal computers, tablets, wearables, and accessories worldwide. It also
sells various related services. In addition, the company offers iPhone, a line of smartphones; Mac, a line of personal computers; iPad, a line
of multi-purpose tablets; AirPods Max, an over-ear wireless headphone; and wearables, home, and accessories comprising AirPods, Apple TV,
Apple Watch, Beats products, HomePod, and iPod touch. Further, it provides AppleCare support services; cloud services store services; and
operates various platforms, including the App Store that allow customers to discover and download applications and digital content, such as
books, music, video, games, and podcasts. Additionally, the company offers various services, such as Apple Arcade, a game subscription
service; Apple Music, which offers users a curated listening experience with on-demand radio stations; Apple News+, a subscription news
and magazine service; Apple TV+, which offers exclusive original content; Apple Card, a co-branded credit card; and Apple Pay, a cashless
payment service, as well as licenses its intellectual property. The company serves consumers, and small and mid-sized businesses; and the
education, enterprise, and government markets. It distributes third-party applications for its products through the App Store. The company
also sells its products through its retail and online stores, and direct sales force; and third-party cellular network carriers, wholesalers,
retailers, and resellers. Apple Inc. was incorporated in 1977 and is headquartered in Cupertino, California. Address: One Apple Park Way,
Cupertino, CA, United States, 95014
4. Page 4 of 10 Any information in this report is not , and should not be regarded as investment advice or as a recommendation regarding any particular security or course of
action. We recommend seeking a licensed professional for investment advice.
Company Website
https://www.apple.com
Address
One Apple Park Way, Cupertino, CA, United States, 95014
Fiscal Year End
September
Employees
154000
Technical Indicators
Value Value
Beta 1.19 52 Week High 182.44
Short Ratio 1.21 52 Week Low 122.43
Shorted Shares 103,977,276 200 Day Moving Average 159.58
Shorted Shares Previous Month 103,292,182 50 Day Moving Average 161.84
Shares Held By Insiders 7.00% Short Percentage 1.00%
Shares Held by Institutions 59.58 Dividend Yield 0.67%
5. Page 5 of 10 Any information in this report is not , and should not be regarded as investment advice or as a recommendation regarding any particular security or course of
action. We recommend seeking a licensed professional for investment advice.
AAPL:NSD (Apple Inc)
Consumer Electronics | | Common Stock
Stock Target Advisor
Detailed Stock Report
Report Date: 23rd May, 2022
Market Performance
Market Performance vs. Industry / Classification (Consumer Electronics) Market Performance vs. Exchange (Nasdaq Global Select)
Value Sector Median
Percentile
Rank
Grade Market Median Percentile Rank Grade
YTD
Capital Gain -22.52% -34.9% 88% -20.7% 48%
Dividend Return 0.25% 0.3% 100% 0.9% 15%
Total Return -22.26% -34.9% 88% -20.2% 47%
Trailing 12 Months
Capital Gain 9.69% -47.4% 100% -20.7% 90%
Dividend Return 0.71% 0.7% 100% 2.3% 14%
Total Return 10.40% -47.4% 100% -19.2% 90%
Trailing 5 Years
Capital Gain 257.84% 21.0% 86% 3.9% 92%
Dividend Return 10.15% 10.1% 100% 11.1% 45%
Total Return 267.99% 21.0% 86% 14.5% 92%
Average Annual (5 Year Horizon)
Capital Gain 43.41% 46.6% 38% 2.9% 87%
Dividend Return 1.34% 1.3% 100% 1.8% 38%
Total Return 44.75% 46.6% 38% 4.8% 87%
Risk Return Profile
Volatility (Standard
Deviation)
35.27% 148.9% 100% 32.2% 45%
Risk Adjusted Return 126.89% N/A 100% 21.1% 99%
Market Capitalization 2,226.92B 0.33B 100% 0.33B 100%
6. Page 6 of 10 Any information in this report is not , and should not be regarded as investment advice or as a recommendation regarding any particular security or course of
action. We recommend seeking a licensed professional for investment advice.
Key Financial Ratios
Ratios vs. Industry / Classification (Computer Hardware) Ratios vs. Exchange (Nasdaq Global Select)
Value Sector Median
Percentile
Rank
Grade Market Median Percentile Rank Grade
Market Value
peratio 22.4 22.4 57% 16.0 37%
pbratio 33.0 2.5 13% 1.6 2%
pcfratio 21.4 8.3 25% 0.0 14%
pfcfratio 17.2 11.0 43% 10.1 31%
Management Effectiveness
retequity 149.27% 1.8% 100% 0.8% 99%
retinvcap 51.66% 3.8% 88% -0.4% 96%
retass 21.70% 1.9% 100% 0.2% 99%
debtequityratio 172.94% 18.1% 33% 32.1% 12%
Technical Ratios
yield 0.67% 0.7% 100% 2.6% 10%
sratio 1.21 5.82 88% 3.10 74%
spercent 0.64% 11.7% 100% 2.9% 79%
beta 1.19 1.21 63% 1.09 42%
7. Page 7 of 10 Any information in this report is not , and should not be regarded as investment advice or as a recommendation regarding any particular security or course of
action. We recommend seeking a licensed professional for investment advice.
AAPL:NSD (Apple Inc)
Consumer Electronics | | Common Stock
Stock Target Advisor
Detailed Stock Report
Report Date: 23rd May, 2022
Recent Analyst Ratings
Price Action Rating Action Analyst Rating Price date
Maintains Bank of America Securities Buy USD 215 » USD 200 2022-05-19
Adjusts STA Research Buy USD 185 » USD 160 2022-05-16
Target Lowered by Fundamental Research Buy » Average USD 179 » USD 175 2022-05-07
Target Lowered by Rosenblatt Securities Neutral USD 184 » USD 168 2022-05-02
Reiterated by Goldman Sachs Neutral » Neutral USD 157 2022-05-02
Maintains STA Research Buy USD 185 2022-04-29
Target Lowered by JP Morgan & Company USD 205 » USD 200 2022-04-29
Target Lowered by Morgan Stanley Overweight USD 210 » USD 195 2022-04-29
Target Set by Credit Suisse USD 169 2022-04-29
Target Lowered by Piper Sandler USD 200 » USD 195 2022-04-29
Target Lowered by Deutsche Bank Capital Buy USD 210 » USD 200 2022-04-29
Maintains STA Research Buy USD 185 2022-04-19
Initiated by Rosenblatt Securities Neutral USD 184 2022-04-19
Target Set by Deutsche Bank Capital USD 210 2022-04-08
Initiated by Evercore ISI Buy USD 210 2022-03-25
Maintains STA Research Buy USD 185 2022-03-23
Maintains Barclays Equal-Weight USD 169 » USD 170 2022-03-11
Rates Zacks Investment Research Buy 2022-03-02
Reiterates STA Research Buy USD 185 2022-02-23
Target Set by JP Morgan & Company Overweight USD 210 2022-02-17
Target Raised by Tigress Financial Strong-Buy USD 198 » USD 210 2022-02-15
Maintains Credit Suisse Neutral USD 150 » USD 168 2022-01-31
Maintains Morgan Stanley Overweight USD 200 » USD 210 2022-01-28
Maintains Raymond James Capital Outperform USD 185 » USD 190 2022-01-28
Maintains Deutsche Bank Capital Buy USD 200 » USD 210 2022-01-28
8. Page 8 of 10 Any information in this report is not , and should not be regarded as investment advice or as a recommendation regarding any particular security or course of
action. We recommend seeking a licensed professional for investment advice.
AAPL:NSD (Apple Inc)
Consumer Electronics | | Common Stock
Stock Target Advisor
Detailed Stock Report
Report Date: 23rd May, 2022
Annual Financial (USD)
9. Page 9 of 10 Any information in this report is not , and should not be regarded as investment advice or as a recommendation regarding any particular security or course of
action. We recommend seeking a licensed professional for investment advice.
AAPL:NSD (Apple Inc)
Consumer Electronics | | Common Stock
Stock Target Advisor
Detailed Stock Report
Report Date: 23rd May, 2022
Quarterly Financial (USD)
10. Page 10 of 10 Any information in this report is not , and should not be regarded as investment advice or as a recommendation regarding any particular security or course of
action. We recommend seeking a licensed professional for investment advice.
AAPL:NSD (Apple Inc)
Consumer Electronics | | Common Stock
Stock Target Advisor
Detailed Stock Report
Report Date: 23rd May, 2022
Largest Industry Peers for Consumer Electronics
Symbol Company Name Price(Change) Market Cap
SONO Sonos Inc N/A USD 2.73B
GPRO GoPro Inc N/A USD 1.05B
MWK Aterian, Inc N/A USD 0.72B
VUZI Vuzix Corporation N/A USD 0.36B
UEIC Universal Electronics Inc N/A USD 0.33B
HEAR Turtle Beach Corporation N/A USD 0.29B
VOXX VOXX International Corporation N/A USD 0.17B
KOSS Koss Corporation N/A USD 0.06B
ETFs Containing AAPL
Symbol Company Name Weight Mer Price(Change) Market Cap
QQQ:PA Invesco EQQQ NASDAQ-100 UCITS .. 12.05 % 0.00 % N/A USD 5.41B
VONE Vanguard Russell 1000 Index Fu.. 6.35 % 0.12 % N/A USD 2.56B
DBX2:XETRA Xtrackers MSCI EM Asia Swap UC.. 6.18 % 0.00 % N/A USD 0.28B
DBX2:F Xtrackers - MSCI EM Asia Swap .. 6.18 % 0.00 % N/A USD 0.28B
VTHR Vanguard Russell 3000 Index Fu.. 5.98 % 0.15 % N/A USD 1.10B
VTI Vanguard Index Funds - Vanguar.. 5.94 % 0.03 % N/A USD 1,200.91B
KOKU Xtrackers MSCI Kokusai Equity .. 4.88 % 0.00 % N/A N/A
ZSP.U:CA 3.85 % 0.09 % N/A N/A
SPGM SPDR Portfolio MSCI Global Sto.. 3.79 % 0.00 % N/A N/A
VT Vanguard Total World Stock Ind.. 3.53 % 0.09 % N/A USD 32.76B
The Stock Target Advisor platform run millions of calculations every day on over 30,000 Canadian and American stocks, comparing and
ranking their financial and market performance against their sectors and exchange.
We represent the percentile ranking using the following grading system.
Letter Grade Percentage Letter Grade Percentage Letter Grade Percentage
A+ 97%-100% A 93%-96% A- 90%-92%
B+ 97%-89% B 83%-86% B- 80%-82%
C+ 77%-79% C 73%-76% C- 70%-72%
D+ 67%-69% D 63%-66% D- 60%-62%
F 0%-59%