The Lovesac Company designs, manufactures, and sells furniture. It offers sactionals, such as seats and sides; sacs, including foam beanbag chairs; and accessories comprising drink holders, footsac blankets, decorative pillows, fitted seat tables, and ottomans.
Based on the The Lovesac Company stock forecasts from 5 analysts, the average analyst target price for The Lovesac Company is USD 105.29 over the next 12 months. The Lovesac Company’s average analyst rating is Strong Buy. Stock Target Advisor’s own stock analysis of The Lovesac Company is Bullish , which is based on 10 positive signals and 4 negative signals. At the last closing, The Lovesac Company’s stock price was USD 31.82. The Lovesac Company’s stock price has changed by -12.46% over the past week, -15.12% over the past month and -65.18% over the last year.
Ollie's Bargain Outlet Holdings, Inc. operates as a retailer of brand name merchandise. The company offers housewares, bed and bath, food, floor coverings, health and beauty aids, books and stationery, toys, and electronics; and other products.
Based on the Ollies Bargain Outlet Holdings Inc stock forecasts from 13 analysts, the average analyst target price for Ollies Bargain Outlet Holdings Inc is USD 55.65 over the next 12 months. Ollies Bargain Outlet Holdings Inc’s average analyst rating is Buy . Stock Target Advisor’s own stock analysis of Ollies Bargain Outlet Holdings Inc is Slightly Bearish, which is based on 7 positive signals and 9 negative signals. At the last closing, Ollies Bargain Outlet Holdings Inc’s stock price was USD 53.66. Ollies Bargain Outlet Holdings Inc’s stock price has changed by +13.23% over the past week, +21.95% over the past month and -38.62% over the last year.
Block, Inc., together with its subsidiaries, creates tools that enables sellers to accept card payments and provides reporting and analytics, and next-day settlement. It provides hardware products, including Magstripe reader.
Based on the Block Inc stock forecasts from 32 analysts, the average analyst target price for Block Inc is USD 177.21 over the next 12 months. Block Inc’s average analyst rating is Strong Buy. Stock Target Advisor’s own stock analysis of Block Inc is Slightly Bullish , which is based on 6 positive signals and 5 negative signals. At the last closing, Block Inc’s stock price was USD 76.58. Block Inc’s stock price has changed by -12.42% over the past week, -8.68% over the past month and -63.57% over the last year.
ABNB Stock Forecast & Price:
Airbnb, Inc., based in San Francisco, California, operates an online marketplace focused on short-term homestays and experiences. The company acts as a broker and charges a commission from each booking.
Based on the Airbnb Inc stock forecasts from 28 analysts, the average analyst target price for Airbnb Inc is USD 139.87 over the next 12 months. Airbnb Inc’s average analyst rating is Buy . Stock Target Advisor’s own stock analysis of Airbnb Inc is Neutral, which is based on 8 positive signals and 7 negative signals. At the last closing, Airbnb Inc’s stock price was USD 111.76. Airbnb Inc’s stock price has changed by +0.97% over the past week, -1.65% over the past month and -32.16% over the last year.
Digital Turbine, Inc., through its subsidiaries, provides media and mobile communication products and solutions for mobile operators, application advertisers, publishers, device original equipment manufacturers (OEMs), and other third parties. Its application media software platform that enables mobile operators and OEMs to control, manage, and monetize devices.
Based on the Digital Turbine Inc stock forecasts from 3 analysts, the average analyst target price for Digital Turbine Inc is USD 63.00 over the next 12 months. Digital Turbine Inc’s average analyst rating is Strong Buy. Stock Target Advisor’s own stock analysis of Digital Turbine Inc is Slightly Bullish , which is based on 9 positive signals and 5 negative signals. At the last closing, Digital Turbine Inc’s stock price was USD 19.68. Digital Turbine Inc’s stock price has changed by -16.79% over the past week, -37.82% over the past month and -70.93% over the last year.
Based on the Owl Rock Capital Corp stock forecasts from 6 analysts, the average analyst target price for Owl Rock Capital Corp is USD 13.89 over the next 12 months. Owl Rock Capital Corp’s average analyst rating is Buy . Stock Target Advisor’s own stock analysis of Owl Rock Capital Corp is Neutral, which is based on 3 positive signals and 3 negative signals. At the last closing, Owl Rock Capital Corp’s stock price was USD 10.86. Owl Rock Capital Corp’s stock price has changed by +5.03% over the past week, -14.69% over the past month and -23.79% over the last year.
TGT Stock Forecast & Price:
Based on the Target Corporation stock forecasts from 25 analysts, the average analyst target price for Target Corporation is USD 207.69 over the next 12 months. Target Corporation’s average analyst rating is Strong Buy. Stock Target Advisor’s own stock analysis of Target Corporation is Bullish , which is based on 12 positive signals and 3 negative signals. At the last closing, Target Corporation’s stock price was USD 167.50. Target Corporation’s stock price has changed by -3.21% over the past week, +6.36% over the past month and -33.31% over the last year.
Dynatrace, Inc. provides a software intelligence platform for dynamic multi-cloud environments. It operates Dynatrace, a software intelligence platform for running and optimizing the applications and services. The company's products include AppMon that works in various applications.
Based on the Dynatrace Inc stock forecasts from 15 analysts, the average analyst target price for Dynatrace Inc is USD 56.58 over the next 12 months. Dynatrace Inc’s average analyst rating is Strong Buy. Stock Target Advisor’s own stock analysis of Dynatrace Inc is Slightly Bullish , which is based on 7 positive signals and 4 negative signals. At the last closing, Dynatrace Inc’s stock price was USD 37.97. Dynatrace Inc’s stock price has changed by +7.29% over the past week, -4.84% over the past month and -22.76% over the last year.
Five Below, Inc. operates as a specialty value retailer in the United States. It offers accessories, including socks, sunglasses, jewelry, scarves, gloves, hair accessories, athletic tops and bottoms, and t-shirts, as well as nail polishes, lip glosses, fragrances, and branded cosmetics.
Based on the Five Below Inc stock forecasts from 16 analysts, the average analyst target price for Five Below Inc is USD 197.68 over the next 12 months. Five Below Inc’s average analyst rating is Strong Buy. Stock Target Advisor’s own stock analysis of Five Below Inc is Slightly Bullish , which is based on 5 positive signals and 4 negative signals. At the last closing, Five Below Inc’s stock price was USD 127.45. Five Below Inc’s stock price has changed by -2.60% over the past week, -8.37% over the past month and -32.82% over the last year.
Amazon.com, Inc. engages in the retail sale of consumer products and subscriptions in North America and internationally. The company operates through three segments: North America, International, and Amazon Web Services (AWS). It sells merchandise and content purchased for resale from third-party sellers through physical and online stores.
Based on the Amazon.com Inc stock forecasts from 30 analysts, the average analyst target price for Amazon.com Inc is USD 177.50 over the next 12 months. Amazon.com Inc’s average analyst rating is Strong Buy. Stock Target Advisor’s own stock analysis of Amazon.com Inc is Slightly Bullish , which is based on 9 positive signals and 4 negative signals. At the last closing, Amazon.com Inc’s stock price was USD 123.00. Amazon.com Inc’s stock price has changed by -94.88% over the past week, -94.64% over the past month and -23.08% over the last year.
Terreno Realty Corporation and together with its subsidiaries, the "Company") acquires, owns and operates industrial real estate in six major coastal U.S. markets: Los Angeles, Northern New Jersey/New York City, San Francisco Bay Area, Seattle, Miami, and Washington, D.C. All square feet, acres, occupancy and number of properties disclosed in these condensed notes to the consolidated financial statements are unaudited.
Based on the Terreno Realty Corporation stock forecasts from 6 analysts, the average analyst target price for Terreno Realty Corporation is USD 77.14 over the next 12 months. Terreno Realty Corporation’s average analyst rating is Buy . Stock Target Advisor’s own stock analysis of Terreno Realty Corporation is Slightly Bearish, which is based on 6 positive signals and 8 negative signals. At the last closing, Terreno Realty Corporation’s stock price was USD 55.50. Terreno Realty Corporation’s stock price has changed by -3.81% over the past week, -7.00% over the past month and -14.69% over the last year.
NIO Stock Forecast & Price:
Based on the Nio Inc Class A ADR stock forecasts from 8 analysts, the average analyst target price for Nio Inc Class A ADR is USD 38.73 over the next 12 months. Nio Inc Class A ADR’s average analyst rating is Strong Buy. Stock Target Advisor’s own stock analysis of Nio Inc Class A ADR is Slightly Bearish, which is based on 3 positive signals and 6 negative signals. At the last closing, Nio Inc Class A ADR’s stock price was USD 19.92. Nio Inc Class A ADR’s stock price has changed by +4.57% over the past week, +2.21% over the past month and -47.65% over the last year.
Based on the Prothena Corporation plc stock forecasts from 4 analysts, the average analyst target price for Prothena Corporation plc is USD 62.00 over the next 12 months. Prothena Corporation plc’s average analyst rating is Strong Buy. Stock Target Advisor’s own stock analysis of Prothena Corporation plc is Slightly Bullish , which is based on 10 positive signals and 5 negative signals. At the last closing, Prothena Corporation plc’s stock price was USD 58.00. Prothena Corporation plc’s stock price has changed by +85.24% over the past week, +107.29% over the past month and -19.21% over the last year.
HAS Stock Forecast & Price:
Hasbro, Inc. is an American multinational conglomerate holding company incorporated and headquartered in Pawtucket, Rhode Island. Hasbro owns the trademarks and products of Kenner, Milton Bradley, Parker Brothers, and Wizards of the Coast, among others.
Based on the Hasbro Inc stock forecasts from 11 analysts, the average analyst target price for Hasbro Inc is USD 94.47 over the next 12 months. Hasbro Inc’s average analyst rating is Strong Buy. Stock Target Advisor’s own stock analysis of Hasbro Inc is Neutral, which is based on 6 positive signals and 7 negative signals. At the last closing, Hasbro Inc’s stock price was USD 68.29. Hasbro Inc’s stock price has changed by -1.57% over the past week, -13.24% over the past month and -21.61% over the last year.
Big Lots, Inc., through its subsidiaries, operates as a home discount retailer in the United States. The company offers products under various merchandising categories, such as furniture category that includes upholstery, mattresses, case goods, and ready-to-assemble departments.
Based on the Big Lots Inc stock forecasts from 9 analysts, the average analyst target price for Big Lots Inc is USD 38.69 over the next 12 months. Big Lots Inc’s average analyst rating is Under-perform. Stock Target Advisor’s own stock analysis of Big Lots Inc is Neutral, which is based on 9 positive signals and 9 negative signals. At the last closing, Big Lots Inc’s stock price was USD 26.23. Big Lots Inc’s stock price has changed by -20.18% over the past week, -24.84% over the past month and -58.78% over the last year.
ZM Stock Forecast & Price:
Based on the Zoom Video Communications Inc stock forecasts from 25 analysts, the average analyst target price for Zoom Video Communications Inc is USD 132.44 over the next 12 months. Zoom Video Communications Inc’s average analyst rating is Buy . Stock Target Advisor’s own stock analysis of Zoom Video Communications Inc is Slightly Bullish , which is based on 8 positive signals and 4 negative signals. At the last closing, Zoom Video Communications Inc’s stock price was USD 81.32. Zoom Video Communications Inc’s stock price has changed by -25.52% over the past week, -23.68% over the past month and -76.17% over the last year.
Dutch Bros Inc. operates and franchises drive-thru shops. It offers Dutch Bros hot and cold espresso-based beverages, and cold brew coffee products, as well as Blue Rebel energy drinks, tea, lemonade, smoothies, and other beverages through company-operated shops and online channels.
Based on the Dutch Bros Inc. stock forecasts from 8 analysts, the average analyst target price for Dutch Bros Inc. is USD 49.00 over the next 12 months. Dutch Bros Inc.’s average analyst rating is Buy . Stock Target Advisor’s own stock analysis of Dutch Bros Inc. is Slightly Bearish, which is based on 3 positive signals and 5 negative signals. At the last closing, Dutch Bros Inc.’s stock price was USD 39.85. Dutch Bros Inc.’s stock price has changed by +29.38% over the past week, -16.58% over the past month and 0% over the last year.
Amazon.com, Inc. engages in the retail sale of consumer products and subscriptions in North America and internationally. The company operates through three segments: North America, International, and Amazon Web Services (AWS). It sells merchandise and content purchased for resale from third-party sellers through physical and online stores.
Based on the Amazon.com Inc stock forecasts from 30 analysts, the average analyst target price for Amazon.com Inc is USD 177.50 over the next 12 months. Amazon.com Inc’s average analyst rating is Strong Buy. Stock Target Advisor’s own stock analysis of Amazon.com Inc is Slightly Bullish , which is based on 8 positive signals and 5 negative signals. At the last closing, Amazon.com Inc’s stock price was USD 124.79. Amazon.com Inc’s stock price has changed by -94.58% over the past week, -94.56% over the past month and -22.16% over the last year.
NVIDIA Corporation provides graphics, and compute and networking solutions in the United States, Taiwan, China, and internationally. The company's Graphics segment offers GeForce GPUs for gaming and PCs, the GeForce NOW game streaming service and related infrastructure, and solutions for gaming platforms.
Based on the NVIDIA Corporation stock forecasts from 30 analysts, the average analyst target price for NVIDIA Corporation is USD 273.00 over the next 12 months. NVIDIA Corporation’s average analyst rating is Strong Buy. Stock Target Advisor’s own stock analysis of NVIDIA Corporation is Slightly Bullish , which is based on 10 positive signals and 8 negative signals. At the last closing, NVIDIA Corporation’s stock price was USD 188.11. NVIDIA Corporation’s stock price has changed by +11.32% over the past week, +1.42% over the past month and +15.80% over the last year.
Zoom Video Communications, Inc. provides unified communications platform in the Americas, the Asia Pacific, Europe, the Middle East, and Africa. The company offers Zoom Meetings that offers HD video, voice, chat, and content sharing through mobile devices, desktops, laptops.
Based on the Zoom Video Communications Inc stock forecasts from 25 analysts, the average analyst target price for Zoom Video Communications Inc is USD 151.78 over the next 12 months. Zoom Video Communications Inc’s average analyst rating is Buy . Stock Target Advisor’s own stock analysis of Zoom Video Communications Inc is Slightly Bullish , which is based on 8 positive signals and 4 negative signals. At the last closing, Zoom Video Communications Inc’s stock price was USD 102.34. Zoom Video Communications Inc’s stock price has changed by +20.84% over the past week, -0.10% over the past month and -68.15% over the last year.
Guidewire Software, Inc. provides software products for property and casualty insurers worldwide. The company offers Guidewire InsuranceSuite comprising Guidewire PolicyCenter, BillingCenter, and ClaimCenter applications.
Based on the Guidewire Software Inc stock forecasts from 7 analysts, the average analyst target price for Guidewire Software Inc is USD 103.27 over the next 12 months. Guidewire Software Inc’s average analyst rating is Hold . Stock Target Advisor’s own stock analysis of Guidewire Software Inc is Slightly Bearish, which is based on 3 positive signals and 6 negative signals. At the last closing, Guidewire Software Inc’s stock price was USD 80.58. Guidewire Software Inc’s stock price has changed by +2.68% over the past week, +4.38% over the past month and -23.88% over the last year.
Cisco Systems, Inc. designs, manufactures, and sells Internet Protocol based networking and other products related to the communications and information technology industry in the Americas, Europe, the Middle East, Africa, the Asia Pacific, Japan, and China.
Based on the Cisco Systems Inc stock forecasts from 19 analysts, the average analyst target price for Cisco Systems Inc is USD 52.64 over the next 12 months. Cisco Systems Inc’s average analyst rating is Buy . Stock Target Advisor’s own stock analysis of Cisco Systems Inc is Bullish , which is based on 11 positive signals and 4 negative signals. At the last closing, Cisco Systems Inc’s stock price was USD 48.70. Cisco Systems Inc’s stock price has changed by +4.48% over the past week, +9.24% over the past month and -16.35% over the last year.
Canopy Growth Corporation, together with its subsidiaries, engages in the production, distribution, and sale of cannabis and hemp-based products for recreational and medical purposes primarily in Canada, the United States, and Germany. It operates through two segments, Global Cannabis and Other Consumer Products.
Based on the Canopy Growth Corporation stock forecasts from 15 analysts, the average analyst target price for Canopy Growth Corporation is USD 8.23 over the next 12 months. Canopy Growth Corporation’s average analyst rating is Under-perform. Stock Target Advisor’s own stock analysis of Canopy Growth Corporation is Bearish, which is based on 2 positive signals and 5 negative signals. At the last closing, Canopy Growth Corporation’s stock price was USD 4.97. Canopy Growth Corporation’s stock price has changed by +4.41% over the past week, -12.96% over the past month and -80.95% over the last year.
Target Corporation operates as a general merchandise retailer in the United States. The company offers food assortments, including perishables, dry grocery, dairy, and frozen items.
Based on the Target Corporation stock forecasts from 25 analysts, the average analyst target price for Target Corporation is USD 216.11 over the next 12 months. Target Corporation’s average analyst rating is Strong Buy. Stock Target Advisor’s own stock analysis of Target Corporation is Very Bullish, which is based on 14 positive signals and 1 negative signals. At the last closing, Target Corporation’s stock price was USD 156.70. Target Corporation’s stock price has changed by +0.12% over the past week, -30.42% over the past month and -33.35% over the last year.
Moderna, Inc., a biotechnology company, discovers, develops, and commercializes messenger RNA therapeutics and vaccines for the treatment of infectious diseases, immuno-oncology, rare diseases, cardiovascular diseases.
Based on the Lightspeed POS Inc stock forecasts from 14 analysts, the average analyst target price for Lightspeed POS Inc is USD 52.03 over the next 12 months. Lightspeed POS Inc’s average analyst rating is Strong Buy. Stock Target Advisor’s own stock analysis of Lightspeed POS Inc is Very Bearish, which is based on 0 positive signals and 2 negative signals. At the last closing, Lightspeed POS Inc’s stock price was USD 24.63. Lightspeed POS Inc’s stock price has changed by +24.27% over the past week, +10.85% over the past month and -65.00% over the last year.
Coupa Software Incorporated provides cloud-based business spend management platform that connects its customers with suppliers worldwide. The company provides visibility into and control over how companies spend money, optimize supply chains, and manage liquidity, as well as enables businesses to achieve savings that drive profitability.
Based on the Coupa Software Incorporated stock forecasts from 18 analysts, the average analyst target price for Coupa Software Incorporated is USD 135.67 over the next 12 months. Coupa Software Incorporated’s average analyst rating is Buy . Stock Target Advisor’s own stock analysis of Coupa Software Incorporated is Slightly Bearish, which is based on 4 positive signals and 6 negative signals. At the last closing, Coupa Software Incorporated’s stock price was USD 74.04. Coupa Software Incorporated’s stock price has changed by +7.63% over the past week, -2.60% over the past month and -68.72% over the last year.
Moderna, Inc., a biotechnology company, discovers, develops, and commercializes messenger RNA therapeutics and vaccines for the treatment of infectious diseases, immuno-oncology, rare diseases, cardiovascular diseases, and auto-immune diseases in the United States, Europe, and internationally.
Based on the Moderna Inc stock forecasts from 11 analysts, the average analyst target price for Moderna Inc is USD 184.76 over the next 12 months. Moderna Inc’s average analyst rating is Hold . Stock Target Advisor’s own stock analysis of Moderna Inc is Bullish , which is based on 10 positive signals and 3 negative signals. At the last closing, Moderna Inc’s stock price was USD 121.08. Moderna Inc’s stock price has changed by -9.67% over the past week, -11.14% over the past month and -38.80% over the last year.
Based on the Dutch Bros Inc. stock forecasts from 8 analysts, the average analyst target price for Dutch Bros Inc. is USD 52.67 over the next 12 months. Dutch Bros Inc.’s average analyst rating is Strong Buy. Stock Target Advisor’s own stock analysis of Dutch Bros Inc. is Neutral, which is based on 3 positive signals and 3 negative signals. At the last closing, Dutch Bros Inc.’s stock price was USD 27.00. Dutch Bros Inc.’s stock price has changed by -40.74% over the past week, -49.05% over the past month and 0% over the last year.
Microsoft Corporation develops, licenses, and supports software, services, devices, and solutions worldwide. Its Productivity and Business Processes segment offers Office, Exchange, SharePoint, Microsoft Teams, Office 365 Security and Compliance.
Based on the Microsoft Corporation stock forecasts from 19 analysts, the average analyst target price for Microsoft Corporation is USD 346.94 over the next 12 months. Microsoft Corporation’s average analyst rating is Strong Buy. Stock Target Advisor’s own stock analysis of Microsoft Corporation is Slightly Bullish , which is based on 9 positive signals and 4 negative signals. At the last closing, Microsoft Corporation’s stock price was USD 247.65. Microsoft Corporation’s stock price has changed by -2.11% over the past week, -2.17% over the past month and -4.54% over the last year.
Core & Main, Inc. distributes water, wastewater, storm drainage, and fire protection products and related services to municipalities, private water companies, and professional contractors in the municipal, non-residential, and residential end markets in the United States.
Based on the Core & Main Inc stock forecasts from 7 analysts, the average analyst target price for Core & Main Inc is USD 29.18 over the next 12 months. Core & Main Inc’s average analyst rating is Strong Buy. Stock Target Advisor’s own stock analysis of Core & Main Inc is Slightly Bearish, which is based on 3 positive signals and 7 negative signals. At the last closing, Core & Main Inc’s stock price was USD 20.71. Core & Main Inc’s stock price has changed by -7.54% over the past week, -4.78% over the past month and 0% over the last year.
More Related Content
Similar to The Lovesac Company (LOVE) Stock Analysis Report
Amazon.com, Inc. engages in the retail sale of consumer products and subscriptions in North America and internationally. The company operates through three segments: North America, International, and Amazon Web Services (AWS). It sells merchandise and content purchased for resale from third-party sellers through physical and online stores.
Based on the Amazon.com Inc stock forecasts from 30 analysts, the average analyst target price for Amazon.com Inc is USD 177.50 over the next 12 months. Amazon.com Inc’s average analyst rating is Strong Buy. Stock Target Advisor’s own stock analysis of Amazon.com Inc is Slightly Bullish , which is based on 9 positive signals and 4 negative signals. At the last closing, Amazon.com Inc’s stock price was USD 123.00. Amazon.com Inc’s stock price has changed by -94.88% over the past week, -94.64% over the past month and -23.08% over the last year.
Terreno Realty Corporation and together with its subsidiaries, the "Company") acquires, owns and operates industrial real estate in six major coastal U.S. markets: Los Angeles, Northern New Jersey/New York City, San Francisco Bay Area, Seattle, Miami, and Washington, D.C. All square feet, acres, occupancy and number of properties disclosed in these condensed notes to the consolidated financial statements are unaudited.
Based on the Terreno Realty Corporation stock forecasts from 6 analysts, the average analyst target price for Terreno Realty Corporation is USD 77.14 over the next 12 months. Terreno Realty Corporation’s average analyst rating is Buy . Stock Target Advisor’s own stock analysis of Terreno Realty Corporation is Slightly Bearish, which is based on 6 positive signals and 8 negative signals. At the last closing, Terreno Realty Corporation’s stock price was USD 55.50. Terreno Realty Corporation’s stock price has changed by -3.81% over the past week, -7.00% over the past month and -14.69% over the last year.
NIO Stock Forecast & Price:
Based on the Nio Inc Class A ADR stock forecasts from 8 analysts, the average analyst target price for Nio Inc Class A ADR is USD 38.73 over the next 12 months. Nio Inc Class A ADR’s average analyst rating is Strong Buy. Stock Target Advisor’s own stock analysis of Nio Inc Class A ADR is Slightly Bearish, which is based on 3 positive signals and 6 negative signals. At the last closing, Nio Inc Class A ADR’s stock price was USD 19.92. Nio Inc Class A ADR’s stock price has changed by +4.57% over the past week, +2.21% over the past month and -47.65% over the last year.
Based on the Prothena Corporation plc stock forecasts from 4 analysts, the average analyst target price for Prothena Corporation plc is USD 62.00 over the next 12 months. Prothena Corporation plc’s average analyst rating is Strong Buy. Stock Target Advisor’s own stock analysis of Prothena Corporation plc is Slightly Bullish , which is based on 10 positive signals and 5 negative signals. At the last closing, Prothena Corporation plc’s stock price was USD 58.00. Prothena Corporation plc’s stock price has changed by +85.24% over the past week, +107.29% over the past month and -19.21% over the last year.
HAS Stock Forecast & Price:
Hasbro, Inc. is an American multinational conglomerate holding company incorporated and headquartered in Pawtucket, Rhode Island. Hasbro owns the trademarks and products of Kenner, Milton Bradley, Parker Brothers, and Wizards of the Coast, among others.
Based on the Hasbro Inc stock forecasts from 11 analysts, the average analyst target price for Hasbro Inc is USD 94.47 over the next 12 months. Hasbro Inc’s average analyst rating is Strong Buy. Stock Target Advisor’s own stock analysis of Hasbro Inc is Neutral, which is based on 6 positive signals and 7 negative signals. At the last closing, Hasbro Inc’s stock price was USD 68.29. Hasbro Inc’s stock price has changed by -1.57% over the past week, -13.24% over the past month and -21.61% over the last year.
Big Lots, Inc., through its subsidiaries, operates as a home discount retailer in the United States. The company offers products under various merchandising categories, such as furniture category that includes upholstery, mattresses, case goods, and ready-to-assemble departments.
Based on the Big Lots Inc stock forecasts from 9 analysts, the average analyst target price for Big Lots Inc is USD 38.69 over the next 12 months. Big Lots Inc’s average analyst rating is Under-perform. Stock Target Advisor’s own stock analysis of Big Lots Inc is Neutral, which is based on 9 positive signals and 9 negative signals. At the last closing, Big Lots Inc’s stock price was USD 26.23. Big Lots Inc’s stock price has changed by -20.18% over the past week, -24.84% over the past month and -58.78% over the last year.
ZM Stock Forecast & Price:
Based on the Zoom Video Communications Inc stock forecasts from 25 analysts, the average analyst target price for Zoom Video Communications Inc is USD 132.44 over the next 12 months. Zoom Video Communications Inc’s average analyst rating is Buy . Stock Target Advisor’s own stock analysis of Zoom Video Communications Inc is Slightly Bullish , which is based on 8 positive signals and 4 negative signals. At the last closing, Zoom Video Communications Inc’s stock price was USD 81.32. Zoom Video Communications Inc’s stock price has changed by -25.52% over the past week, -23.68% over the past month and -76.17% over the last year.
Dutch Bros Inc. operates and franchises drive-thru shops. It offers Dutch Bros hot and cold espresso-based beverages, and cold brew coffee products, as well as Blue Rebel energy drinks, tea, lemonade, smoothies, and other beverages through company-operated shops and online channels.
Based on the Dutch Bros Inc. stock forecasts from 8 analysts, the average analyst target price for Dutch Bros Inc. is USD 49.00 over the next 12 months. Dutch Bros Inc.’s average analyst rating is Buy . Stock Target Advisor’s own stock analysis of Dutch Bros Inc. is Slightly Bearish, which is based on 3 positive signals and 5 negative signals. At the last closing, Dutch Bros Inc.’s stock price was USD 39.85. Dutch Bros Inc.’s stock price has changed by +29.38% over the past week, -16.58% over the past month and 0% over the last year.
Amazon.com, Inc. engages in the retail sale of consumer products and subscriptions in North America and internationally. The company operates through three segments: North America, International, and Amazon Web Services (AWS). It sells merchandise and content purchased for resale from third-party sellers through physical and online stores.
Based on the Amazon.com Inc stock forecasts from 30 analysts, the average analyst target price for Amazon.com Inc is USD 177.50 over the next 12 months. Amazon.com Inc’s average analyst rating is Strong Buy. Stock Target Advisor’s own stock analysis of Amazon.com Inc is Slightly Bullish , which is based on 8 positive signals and 5 negative signals. At the last closing, Amazon.com Inc’s stock price was USD 124.79. Amazon.com Inc’s stock price has changed by -94.58% over the past week, -94.56% over the past month and -22.16% over the last year.
NVIDIA Corporation provides graphics, and compute and networking solutions in the United States, Taiwan, China, and internationally. The company's Graphics segment offers GeForce GPUs for gaming and PCs, the GeForce NOW game streaming service and related infrastructure, and solutions for gaming platforms.
Based on the NVIDIA Corporation stock forecasts from 30 analysts, the average analyst target price for NVIDIA Corporation is USD 273.00 over the next 12 months. NVIDIA Corporation’s average analyst rating is Strong Buy. Stock Target Advisor’s own stock analysis of NVIDIA Corporation is Slightly Bullish , which is based on 10 positive signals and 8 negative signals. At the last closing, NVIDIA Corporation’s stock price was USD 188.11. NVIDIA Corporation’s stock price has changed by +11.32% over the past week, +1.42% over the past month and +15.80% over the last year.
Zoom Video Communications, Inc. provides unified communications platform in the Americas, the Asia Pacific, Europe, the Middle East, and Africa. The company offers Zoom Meetings that offers HD video, voice, chat, and content sharing through mobile devices, desktops, laptops.
Based on the Zoom Video Communications Inc stock forecasts from 25 analysts, the average analyst target price for Zoom Video Communications Inc is USD 151.78 over the next 12 months. Zoom Video Communications Inc’s average analyst rating is Buy . Stock Target Advisor’s own stock analysis of Zoom Video Communications Inc is Slightly Bullish , which is based on 8 positive signals and 4 negative signals. At the last closing, Zoom Video Communications Inc’s stock price was USD 102.34. Zoom Video Communications Inc’s stock price has changed by +20.84% over the past week, -0.10% over the past month and -68.15% over the last year.
Guidewire Software, Inc. provides software products for property and casualty insurers worldwide. The company offers Guidewire InsuranceSuite comprising Guidewire PolicyCenter, BillingCenter, and ClaimCenter applications.
Based on the Guidewire Software Inc stock forecasts from 7 analysts, the average analyst target price for Guidewire Software Inc is USD 103.27 over the next 12 months. Guidewire Software Inc’s average analyst rating is Hold . Stock Target Advisor’s own stock analysis of Guidewire Software Inc is Slightly Bearish, which is based on 3 positive signals and 6 negative signals. At the last closing, Guidewire Software Inc’s stock price was USD 80.58. Guidewire Software Inc’s stock price has changed by +2.68% over the past week, +4.38% over the past month and -23.88% over the last year.
Cisco Systems, Inc. designs, manufactures, and sells Internet Protocol based networking and other products related to the communications and information technology industry in the Americas, Europe, the Middle East, Africa, the Asia Pacific, Japan, and China.
Based on the Cisco Systems Inc stock forecasts from 19 analysts, the average analyst target price for Cisco Systems Inc is USD 52.64 over the next 12 months. Cisco Systems Inc’s average analyst rating is Buy . Stock Target Advisor’s own stock analysis of Cisco Systems Inc is Bullish , which is based on 11 positive signals and 4 negative signals. At the last closing, Cisco Systems Inc’s stock price was USD 48.70. Cisco Systems Inc’s stock price has changed by +4.48% over the past week, +9.24% over the past month and -16.35% over the last year.
Canopy Growth Corporation, together with its subsidiaries, engages in the production, distribution, and sale of cannabis and hemp-based products for recreational and medical purposes primarily in Canada, the United States, and Germany. It operates through two segments, Global Cannabis and Other Consumer Products.
Based on the Canopy Growth Corporation stock forecasts from 15 analysts, the average analyst target price for Canopy Growth Corporation is USD 8.23 over the next 12 months. Canopy Growth Corporation’s average analyst rating is Under-perform. Stock Target Advisor’s own stock analysis of Canopy Growth Corporation is Bearish, which is based on 2 positive signals and 5 negative signals. At the last closing, Canopy Growth Corporation’s stock price was USD 4.97. Canopy Growth Corporation’s stock price has changed by +4.41% over the past week, -12.96% over the past month and -80.95% over the last year.
Target Corporation operates as a general merchandise retailer in the United States. The company offers food assortments, including perishables, dry grocery, dairy, and frozen items.
Based on the Target Corporation stock forecasts from 25 analysts, the average analyst target price for Target Corporation is USD 216.11 over the next 12 months. Target Corporation’s average analyst rating is Strong Buy. Stock Target Advisor’s own stock analysis of Target Corporation is Very Bullish, which is based on 14 positive signals and 1 negative signals. At the last closing, Target Corporation’s stock price was USD 156.70. Target Corporation’s stock price has changed by +0.12% over the past week, -30.42% over the past month and -33.35% over the last year.
Moderna, Inc., a biotechnology company, discovers, develops, and commercializes messenger RNA therapeutics and vaccines for the treatment of infectious diseases, immuno-oncology, rare diseases, cardiovascular diseases.
Based on the Lightspeed POS Inc stock forecasts from 14 analysts, the average analyst target price for Lightspeed POS Inc is USD 52.03 over the next 12 months. Lightspeed POS Inc’s average analyst rating is Strong Buy. Stock Target Advisor’s own stock analysis of Lightspeed POS Inc is Very Bearish, which is based on 0 positive signals and 2 negative signals. At the last closing, Lightspeed POS Inc’s stock price was USD 24.63. Lightspeed POS Inc’s stock price has changed by +24.27% over the past week, +10.85% over the past month and -65.00% over the last year.
Coupa Software Incorporated provides cloud-based business spend management platform that connects its customers with suppliers worldwide. The company provides visibility into and control over how companies spend money, optimize supply chains, and manage liquidity, as well as enables businesses to achieve savings that drive profitability.
Based on the Coupa Software Incorporated stock forecasts from 18 analysts, the average analyst target price for Coupa Software Incorporated is USD 135.67 over the next 12 months. Coupa Software Incorporated’s average analyst rating is Buy . Stock Target Advisor’s own stock analysis of Coupa Software Incorporated is Slightly Bearish, which is based on 4 positive signals and 6 negative signals. At the last closing, Coupa Software Incorporated’s stock price was USD 74.04. Coupa Software Incorporated’s stock price has changed by +7.63% over the past week, -2.60% over the past month and -68.72% over the last year.
Moderna, Inc., a biotechnology company, discovers, develops, and commercializes messenger RNA therapeutics and vaccines for the treatment of infectious diseases, immuno-oncology, rare diseases, cardiovascular diseases, and auto-immune diseases in the United States, Europe, and internationally.
Based on the Moderna Inc stock forecasts from 11 analysts, the average analyst target price for Moderna Inc is USD 184.76 over the next 12 months. Moderna Inc’s average analyst rating is Hold . Stock Target Advisor’s own stock analysis of Moderna Inc is Bullish , which is based on 10 positive signals and 3 negative signals. At the last closing, Moderna Inc’s stock price was USD 121.08. Moderna Inc’s stock price has changed by -9.67% over the past week, -11.14% over the past month and -38.80% over the last year.
Based on the Dutch Bros Inc. stock forecasts from 8 analysts, the average analyst target price for Dutch Bros Inc. is USD 52.67 over the next 12 months. Dutch Bros Inc.’s average analyst rating is Strong Buy. Stock Target Advisor’s own stock analysis of Dutch Bros Inc. is Neutral, which is based on 3 positive signals and 3 negative signals. At the last closing, Dutch Bros Inc.’s stock price was USD 27.00. Dutch Bros Inc.’s stock price has changed by -40.74% over the past week, -49.05% over the past month and 0% over the last year.
Similar to The Lovesac Company (LOVE) Stock Analysis Report (20)
Microsoft Corporation develops, licenses, and supports software, services, devices, and solutions worldwide. Its Productivity and Business Processes segment offers Office, Exchange, SharePoint, Microsoft Teams, Office 365 Security and Compliance.
Based on the Microsoft Corporation stock forecasts from 19 analysts, the average analyst target price for Microsoft Corporation is USD 346.94 over the next 12 months. Microsoft Corporation’s average analyst rating is Strong Buy. Stock Target Advisor’s own stock analysis of Microsoft Corporation is Slightly Bullish , which is based on 9 positive signals and 4 negative signals. At the last closing, Microsoft Corporation’s stock price was USD 247.65. Microsoft Corporation’s stock price has changed by -2.11% over the past week, -2.17% over the past month and -4.54% over the last year.
Core & Main, Inc. distributes water, wastewater, storm drainage, and fire protection products and related services to municipalities, private water companies, and professional contractors in the municipal, non-residential, and residential end markets in the United States.
Based on the Core & Main Inc stock forecasts from 7 analysts, the average analyst target price for Core & Main Inc is USD 29.18 over the next 12 months. Core & Main Inc’s average analyst rating is Strong Buy. Stock Target Advisor’s own stock analysis of Core & Main Inc is Slightly Bearish, which is based on 3 positive signals and 7 negative signals. At the last closing, Core & Main Inc’s stock price was USD 20.71. Core & Main Inc’s stock price has changed by -7.54% over the past week, -4.78% over the past month and 0% over the last year.
Stock Target Advisor’s own stock analysis of ProShares Metaverse ETF is Very Bearish, which is based on 0 positive signals and 5 negative signals. At the last closing, ProShares Metaverse ETF’s stock price was USD 32.42. ProShares Metaverse ETF’s stock price has changed by -5.18% over the past week, -6.21% over the past month and +32,315.00% over the last year.
Verseon Corporation, a pharmaceutical company, designs and develops novel therapeutics for various diseases in the United States.
The fund invests in financial instruments that ProShare Advisors believes, in combination, should produce daily returns consistent with the fund's investment objective.
Stock Target Advisor’s own stock analysis of ProShares Short Real Estate is Bearish, which is based on 1 positive signals and 3 negative signals. At the last closing, ProShares Short Real Estate’s stock price was USD 20.28. ProShares Short Real Estate’s stock price has changed by +5.02% over the past week, +6.23% over the past month and +8.23% over the last year.
Bragg Gaming Group Inc. operates as a technology and content supplier to the gaming industry worldwide.
Based on the Bragg Gaming Group Inc stock forecasts from 2 analysts, the average analyst target price for Bragg Gaming Group Inc is USD 15.33 over the next 12 months. Bragg Gaming Group Inc’s average analyst rating is Strong Buy. Stock Target Advisor’s own stock analysis of Bragg Gaming Group Inc is Very Bearish, which is based on 0 positive signals and 2 negative signals. At the last closing, Bragg Gaming Group Inc’s stock price was USD 4.77. Bragg Gaming Group Inc’s stock price has changed by -19.15% over the past week, -0.42% over the past month and 0% over the last year.
Brookline Bancorp, Inc. operates as a bank holding company for the Brookline Bank that provide commercial, business, and retail banking services to corporate, municipal, and retail customers in the United States. Its deposit products include demand checking, NOW, money market, and savings accounts.
Based on the Brookline Bancorp Inc stock forecasts from 1 analysts, the average analyst target price for Brookline Bancorp Inc is USD 18.00 over the next 12 months. Brookline Bancorp Inc’s average analyst rating is not available. Stock Target Advisor’s own stock analysis of Brookline Bancorp Inc is Bearish, which is based on 1 positive signals and 7 negative signals. At the last closing, Brookline Bancorp Inc’s stock price was USD 13.13. Brookline Bancorp Inc’s stock price has changed by -3.46% over the past week, -8.63% over the past month and -20.52% over the last year.
Tesla, Inc. designs, develops, manufactures, leases, and sells electric vehicles, and energy generation and storage systems in the United States, China, and internationally. The company operates in two segments, Automotive, and Energy Generation and Storage.
Based on the Tesla Inc stock forecasts from 30 analysts, the average analyst target price for Tesla Inc is USD 921.57 over the next 12 months. Tesla Inc’s average analyst rating is Buy . Stock Target Advisor’s own stock analysis of Tesla Inc is Slightly Bullish , which is based on 9 positive signals and 6 negative signals. At the last closing, Tesla Inc’s stock price was USD 639.30. Tesla Inc’s stock price has changed by -11.10% over the past week, -11.74% over the past month and +5.69% over the last year.
Apple Inc. designs, manufactures, and markets smartphones, personal computers, tablets, wearables, and accessories worldwide. It also sells various related services. In addition, the company offers iPhone, a line of smartphones.
Based on the Apple Inc stock forecasts from 27 analysts, the average analyst target price for Apple Inc is USD 183.58 over the next 12 months. Apple Inc’s average analyst rating is Strong Buy. Stock Target Advisor’s own stock analysis of Apple Inc is Slightly Bullish , which is based on 10 positive signals and 5 negative signals. At the last closing, Apple Inc’s stock price was USD 130.06. Apple Inc’s stock price has changed by -8.82% over the past week, -10.64% over the past month and -0.07% over the last year.
Bristol-Myers Squibb Company discovers, develops, licenses, manufactures, and markets biopharmaceutical products worldwide. It offers products for hematology, oncology, cardiovascular, immunology, fibrotic, neuroscience, and covid-19 diseases.
Based on the Bristol-Myers Squibb Company stock forecasts from 9 analysts, the average analyst target price for Bristol-Myers Squibb Company is USD 73.91 over the next 12 months. Bristol-Myers Squibb Company’s average analyst rating is Buy . Stock Target Advisor’s own stock analysis of Bristol-Myers Squibb Company is Slightly Bearish, which is based on 6 positive signals and 9 negative signals. At the last closing, Bristol-Myers Squibb Company’s stock price was USD 75.09. Bristol-Myers Squibb Company’s stock price has changed by -0.11% over the past week, -1.59% over the past month and +11.51% over the last year.
Microsoft Corporation develops, licenses, and supports software, services, devices, and solutions worldwide. Its Productivity and Business Processes segment offers Office, Exchange, SharePoint, Microsoft Teams, Office 365 Security and Compliance, and Skype for Business.
Based on the Microsoft Corporation stock forecasts from 19 analysts, the average analyst target price for Microsoft Corporation is USD 347.83 over the next 12 months. Microsoft Corporation’s average analyst rating is Strong Buy. Stock Target Advisor’s own stock analysis of Microsoft Corporation is Slightly Bullish , which is based on 9 positive signals and 4 negative signals. At the last closing, Microsoft Corporation’s stock price was USD 252.99. Microsoft Corporation’s stock price has changed by -6.31% over the past week, -0.92% over the past month and -1.90% over the last year.
Beam Global, a cleantech company, designs, develops, engineers, manufactures, and sells renewably energized products for electric vehicle (EV) charging infrastructure, outdoor media and branding, and energy security products.
Based on the Beam Global stock forecasts from 1 analysts, the average analyst target price for Beam Global is USD 25.00 over the next 12 months. Beam Global’s average analyst rating is not available. Stock Target Advisor’s own stock analysis of Beam Global is Bearish, which is based on 1 positive signals and 6 negative signals. At the last closing, Beam Global’s stock price was USD 19.26. Beam Global’s stock price has changed by +30.31% over the past week, +7.96% over the past month and -46.16% over the last year.
Rigel Pharmaceuticals, Inc., a biotechnology company, discovers and develops small molecule drugs to treat hematologic disorders, cancer, and rare immune diseases.
Based on the Rigel Pharmaceuticals Inc stock forecasts from 7 analysts, the average analyst target price for Rigel Pharmaceuticals Inc is USD 2.58 over the next 12 months. Rigel Pharmaceuticals Inc’s average analyst rating is Buy . Stock Target Advisor’s own stock analysis of Rigel Pharmaceuticals Inc is Slightly Bearish, which is based on 3 positive signals and 4 negative signals. At the last closing, Rigel Pharmaceuticals Inc’s stock price was USD 0.72. Rigel Pharmaceuticals Inc’s stock price has changed by -56.63% over the past week, -63.45% over the past month and -82.40% over the last year.
Aldeyra Therapeutics, Inc., a biotechnology company, develops and commercializes medicines for immune-mediated ocular and systemic diseases. The company's lead product candidate is reproxalap.
Based on the Aldeyra The stock forecasts from 5 analysts, the average analyst target price for Aldeyra The is USD 19.67 over the next 12 months. Aldeyra The’s average analyst rating is Strong Buy. Stock Target Advisor’s own stock analysis of Aldeyra The is Bearish, which is based on 1 positive signals and 3 negative signals. At the last closing, Aldeyra The’s stock price was USD 3.86. Aldeyra The’s stock price has changed by +26.14% over the past week, +56.28% over the past month and -69.29% over the last year.
Couchbase, Inc. provides a database for enterprise applications worldwide. Its database works in multiple configurations, ranging from cloud to multi- or hybrid-cloud to on-premise environments to the edge.
Based on the Couchbase Inc stock forecasts from 8 analysts, the average analyst target price for Couchbase Inc is USD 24.53 over the next 12 months. Couchbase Inc’s average analyst rating is Buy . Stock Target Advisor’s own stock analysis of Couchbase Inc is Bearish, which is based on 1 positive signals and 3 negative signals. At the last closing, Couchbase Inc’s stock price was USD 16.00. Couchbase Inc’s stock price has changed by -0.56% over the past week, +12.36% over the past month and 0% over the last year.
Rigel Pharmaceuticals, Inc., a biotechnology company, discovers and develops small molecule drugs to treat hematologic disorders, cancer, and rare immune diseases.
Based on the Rigel Pharmaceuticals Inc stock forecasts from 5 analysts, the average analyst target price for Rigel Pharmaceuticals Inc is USD 3.25 over the next 12 months. Rigel Pharmaceuticals Inc’s average analyst rating is Buy . Stock Target Advisor’s own stock analysis of Rigel Pharmaceuticals Inc is Neutral, which is based on 3 positive signals and 3 negative signals. At the last closing, Rigel Pharmaceuticals Inc’s stock price was USD 0.70. Rigel Pharmaceuticals Inc’s stock price has changed by -59.77% over the past week, -68.47% over the past month and -82.46% over the last year.
Smartsheet Inc. provides cloud-based enterprise platform to plan, capture, manage, automate, and report on work for teams and organizations. The company offers Dashboards for real-time visibility into the status of work to align individuals, managers, and executives.
Based on the Smartsheet Inc stock forecasts from 13 analysts, the average analyst target price for Smartsheet Inc is USD 63.50 over the next 12 months. Smartsheet Inc’s average analyst rating is Strong Buy. Stock Target Advisor’s own stock analysis of Smartsheet Inc is Bearish, which is based on 1 positive signals and 3 negative signals. At the last closing, Smartsheet Inc’s stock price was USD 37.76. Smartsheet Inc’s stock price has changed by +4.22% over the past week, -13.51% over the past month and -40.00% over the last year.
IVERIC bio, Inc., a biopharmaceutical company, discovers and develops novel treatments for retinal diseases with a focus on age-related and orphan inherited retinal diseases (IRDs).
Based on the IVERIC bio Inc stock forecasts from 9 analysts, the average analyst target price for IVERIC bio Inc is USD 23.22 over the next 12 months. IVERIC bio Inc’s average analyst rating is Strong Buy. Stock Target Advisor’s own stock analysis of IVERIC bio Inc is Neutral, which is based on 3 positive signals and 3 negative signals. At the last closing, IVERIC bio Inc’s stock price was USD 11.25. IVERIC bio Inc’s stock price has changed by +8.91% over the past week, -9.35% over the past month and +70.45% over the last year.
Based on the Joby Aviation stock forecasts from 5 analysts, the average analyst target price for Joby Aviation is USD 8.60 over the next 12 months. Joby Aviation’s average analyst rating is Buy . Stock Target Advisor’s own stock analysis of Joby Aviation is Neutral, which is based on 0 positive signals and 0 negative signals. At the last closing, Joby Aviation’s stock price was USD 5.15. Joby Aviation’s stock price has changed by -12.71% over the past week, -3.38% over the past month and 0% over the last year.
Based on the Thoughtworks Holding Inc stock forecasts from 6 analysts, the average analyst target price for Thoughtworks Holding Inc is USD 27.50 over the next 12 months. Thoughtworks Holding Inc’s average analyst rating is Strong Buy. Stock Target Advisor’s own stock analysis of Thoughtworks Holding Inc is Neutral, which is based on 0 positive signals and 0 negative signals. At the last closing, Thoughtworks Holding Inc’s stock price was USD 16.62. Thoughtworks Holding Inc’s stock price has changed by -3.99% over the past week, -4.97% over the past month and 0% over the last year.
Moderna, Inc., a biotechnology company, discovers, develops, and commercializes messenger RNA therapeutics and vaccines for the treatment of infectious diseases, immuno-oncology, rare diseases, cardiovascular diseases, and auto-immune diseases in the United States, Europe, and internationally.
Based on the Moderna Inc stock forecasts from 11 analysts, the average analyst target price for Moderna Inc is USD 188.39 over the next 12 months. Moderna Inc’s average analyst rating is Hold . Stock Target Advisor’s own stock analysis of Moderna Inc is Bullish , which is based on 10 positive signals and 3 negative signals. At the last closing, Moderna Inc’s stock price was USD 145.34. Moderna Inc’s stock price has changed by +0.01% over the past week, +8.14% over the past month and -33.81% over the last year.
The European Unemployment Puzzle: implications from population agingGRAPE
We study the link between the evolving age structure of the working population and unemployment. We build a large new Keynesian OLG model with a realistic age structure, labor market frictions, sticky prices, and aggregate shocks. Once calibrated to the European economy, we quantify the extent to which demographic changes over the last three decades have contributed to the decline of the unemployment rate. Our findings yield important implications for the future evolution of unemployment given the anticipated further aging of the working population in Europe. We also quantify the implications for optimal monetary policy: lowering inflation volatility becomes less costly in terms of GDP and unemployment volatility, which hints that optimal monetary policy may be more hawkish in an aging society. Finally, our results also propose a partial reversal of the European-US unemployment puzzle due to the fact that the share of young workers is expected to remain robust in the US.
how can i use my minded pi coins I need some funds.DOT TECH
If you are interested in selling your pi coins, i have a verified pi merchant, who buys pi coins and resell them to exchanges looking forward to hold till mainnet launch.
Because the core team has announced that pi network will not be doing any pre-sale. The only way exchanges like huobi, bitmart and hotbit can get pi is by buying from miners.
Now a merchant stands in between these exchanges and the miners. As a link to make transactions smooth. Because right now in the enclosed mainnet you can't sell pi coins your self. You need the help of a merchant,
i will leave the telegram contact of my personal pi merchant below. 👇 I and my friends has traded more than 3000pi coins with him successfully.
@Pi_vendor_247
Currently pi network is not tradable on binance or any other exchange because we are still in the enclosed mainnet.
Right now the only way to sell pi coins is by trading with a verified merchant.
What is a pi merchant?
A pi merchant is someone verified by pi network team and allowed to barter pi coins for goods and services.
Since pi network is not doing any pre-sale The only way exchanges like binance/huobi or crypto whales can get pi is by buying from miners. And a merchant stands in between the exchanges and the miners.
I will leave the telegram contact of my personal pi merchant. I and my friends has traded more than 6000pi coins successfully
Tele-gram
@Pi_vendor_247
Falcon stands out as a top-tier P2P Invoice Discounting platform in India, bridging esteemed blue-chip companies and eager investors. Our goal is to transform the investment landscape in India by establishing a comprehensive destination for borrowers and investors with diverse profiles and needs, all while minimizing risk. What sets Falcon apart is the elimination of intermediaries such as commercial banks and depository institutions, allowing investors to enjoy higher yields.
how to sell pi coins in South Korea profitably.DOT TECH
Yes. You can sell your pi network coins in South Korea or any other country, by finding a verified pi merchant
What is a verified pi merchant?
Since pi network is not launched yet on any exchange, the only way you can sell pi coins is by selling to a verified pi merchant, and this is because pi network is not launched yet on any exchange and no pre-sale or ico offerings Is done on pi.
Since there is no pre-sale, the only way exchanges can get pi is by buying from miners. So a pi merchant facilitates these transactions by acting as a bridge for both transactions.
How can i find a pi vendor/merchant?
Well for those who haven't traded with a pi merchant or who don't already have one. I will leave the telegram id of my personal pi merchant who i trade pi with.
Tele gram: @Pi_vendor_247
#pi #sell #nigeria #pinetwork #picoins #sellpi #Nigerian #tradepi #pinetworkcoins #sellmypi
Resume
• Real GDP growth slowed down due to problems with access to electricity caused by the destruction of manoeuvrable electricity generation by Russian drones and missiles.
• Exports and imports continued growing due to better logistics through the Ukrainian sea corridor and road. Polish farmers and drivers stopped blocking borders at the end of April.
• In April, both the Tax and Customs Services over-executed the revenue plan. Moreover, the NBU transferred twice the planned profit to the budget.
• The European side approved the Ukraine Plan, which the government adopted to determine indicators for the Ukraine Facility. That approval will allow Ukraine to receive a EUR 1.9 bn loan from the EU in May. At the same time, the EU provided Ukraine with a EUR 1.5 bn loan in April, as the government fulfilled five indicators under the Ukraine Plan.
• The USA has finally approved an aid package for Ukraine, which includes USD 7.8 bn of budget support; however, the conditions and timing of the assistance are still unknown.
• As in March, annual consumer inflation amounted to 3.2% yoy in April.
• At the April monetary policy meeting, the NBU again reduced the key policy rate from 14.5% to 13.5% per annum.
• Over the past four weeks, the hryvnia exchange rate has stabilized in the UAH 39-40 per USD range.
how to sell pi coins effectively (from 50 - 100k pi)DOT TECH
Anywhere in the world, including Africa, America, and Europe, you can sell Pi Network Coins online and receive cash through online payment options.
Pi has not yet been launched on any exchange because we are currently using the confined Mainnet. The planned launch date for Pi is June 28, 2026.
Reselling to investors who want to hold until the mainnet launch in 2026 is currently the sole way to sell.
Consequently, right now. All you need to do is select the right pi network provider.
Who is a pi merchant?
An individual who buys coins from miners on the pi network and resells them to investors hoping to hang onto them until the mainnet is launched is known as a pi merchant.
debuts.
I'll provide you the Telegram username
@Pi_vendor_247
what is the best method to sell pi coins in 2024DOT TECH
The best way to sell your pi coins safely is trading with an exchange..but since pi is not launched in any exchange, and second option is through a VERIFIED pi merchant.
Who is a pi merchant?
A pi merchant is someone who buys pi coins from miners and pioneers and resell them to Investors looking forward to hold massive amounts before mainnet launch in 2026.
I will leave the telegram contact of my personal pi merchant to trade pi coins with.
@Pi_vendor_247
Empowering the Unbanked: The Vital Role of NBFCs in Promoting Financial Inclu...Vighnesh Shashtri
In India, financial inclusion remains a critical challenge, with a significant portion of the population still unbanked. Non-Banking Financial Companies (NBFCs) have emerged as key players in bridging this gap by providing financial services to those often overlooked by traditional banking institutions. This article delves into how NBFCs are fostering financial inclusion and empowering the unbanked.
NO1 Uk Black Magic Specialist Expert In Sahiwal, Okara, Hafizabad, Mandi Bah...Amil Baba Dawood bangali
Contact with Dawood Bhai Just call on +92322-6382012 and we'll help you. We'll solve all your problems within 12 to 24 hours and with 101% guarantee and with astrology systematic. If you want to take any personal or professional advice then also you can call us on +92322-6382012 , ONLINE LOVE PROBLEM & Other all types of Daily Life Problem's.Then CALL or WHATSAPP us on +92322-6382012 and Get all these problems solutions here by Amil Baba DAWOOD BANGALI
#vashikaranspecialist #astrologer #palmistry #amliyaat #taweez #manpasandshadi #horoscope #spiritual #lovelife #lovespell #marriagespell#aamilbabainpakistan #amilbabainkarachi #powerfullblackmagicspell #kalajadumantarspecialist #realamilbaba #AmilbabainPakistan #astrologerincanada #astrologerindubai #lovespellsmaster #kalajaduspecialist #lovespellsthatwork #aamilbabainlahore#blackmagicformarriage #aamilbaba #kalajadu #kalailam #taweez #wazifaexpert #jadumantar #vashikaranspecialist #astrologer #palmistry #amliyaat #taweez #manpasandshadi #horoscope #spiritual #lovelife #lovespell #marriagespell#aamilbabainpakistan #amilbabainkarachi #powerfullblackmagicspell #kalajadumantarspecialist #realamilbaba #AmilbabainPakistan #astrologerincanada #astrologerindubai #lovespellsmaster #kalajaduspecialist #lovespellsthatwork #aamilbabainlahore #blackmagicforlove #blackmagicformarriage #aamilbaba #kalajadu #kalailam #taweez #wazifaexpert #jadumantar #vashikaranspecialist #astrologer #palmistry #amliyaat #taweez #manpasandshadi #horoscope #spiritual #lovelife #lovespell #marriagespell#aamilbabainpakistan #amilbabainkarachi #powerfullblackmagicspell #kalajadumantarspecialist #realamilbaba #AmilbabainPakistan #astrologerincanada #astrologerindubai #lovespellsmaster #kalajaduspecialist #lovespellsthatwork #aamilbabainlahore #Amilbabainuk #amilbabainspain #amilbabaindubai #Amilbabainnorway #amilbabainkrachi #amilbabainlahore #amilbabaingujranwalan #amilbabainislamabad
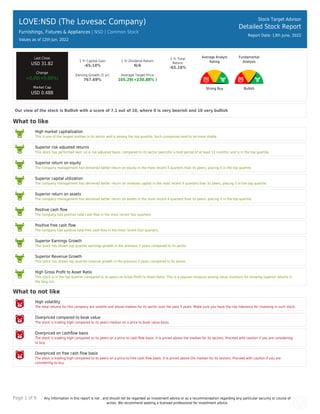
1. Page 1 of 9 Any information in this report is not , and should not be regarded as investment advice or as a recommendation regarding any particular security or course of
action. We recommend seeking a licensed professional for investment advice.
LOVE:NSD (The Lovesac Company)
Furnishings, Fixtures & Appliances | NSD | Common Stock
Values as of 12th Jun, 2022
Stock Target Advisor
Detailed Stock Report
Report Date: 13th June, 2022
Last Close
USD 31.82
Change
+0.00(+0.00%)
Market Cap
USD 0.48B
1 Yr Capital Gain
-65.18%
1 Yr Dividend Return
N/A
1 Yr Total
Return
-65.18%
Earning Growth (5 yr)
767.69%
Average Target Price
105.29(+230.88% )
Average Analyst
Rating
Strong Buy
Fundamental
Analysis
Bullish
Our view of the stock is Bullish with a score of 7.1 out of 10, where 0 is very bearish and 10 very bullish
What to like
High market capitalization
This is one of the largest entities in its sector and is among the top quartile. Such companies tend to be more stable.
Superior risk adjusted returns
This stock has performed well, on a risk adjusted basis, compared to its sector peers(for a hold period of at least 12 months) and is in the top quartile.
Superior return on equity
The company management has delivered better return on equity in the most recent 4 quarters than its peers, placing it in the top quartile.
Superior capital utilization
The company management has delivered better return on invested capital in the most recent 4 quarters than its peers, placing it in the top quartile.
Superior return on assets
The company management has delivered better return on assets in the most recent 4 quarters than its peers, placing it in the top quartile.
Positive cash flow
The company had positive total cash flow in the most recent four quarters.
Positive free cash flow
The company had positive total free cash flow in the most recent four quarters.
Superior Earnings Growth
This stock has shown top quartile earnings growth in the previous 5 years compared to its sector.
Superior Revenue Growth
This stock has shown top quartile revenue growth in the previous 5 years compared to its sector.
High Gross Profit to Asset Ratio
This stock is in the top quartile compared to its peers on Gross Profit to Asset Ratio. This is a popular measure among value investors for showing superior returns in
the long run.
What to not like
High volatility
The total returns for this company are volatile and above median for its sector over the past 5 years. Make sure you have the risk tolerance for investing in such stock.
Overpriced compared to book value
The stock is trading high compared to its peers median on a price to book value basis.
Overpriced on cashflow basis
The stock is trading high compared to its peers on a price to cash flow basis. It is priced above the median for its sectors. Proceed with caution if you are considering
to buy.
Overpriced on free cash flow basis
The stock is trading high compared to its peers on a price to free cash flow basis. It is priced above the median for its sectors. Proceed with caution if you are
considering to buy.
2. Page 2 of 9 Any information in this report is not , and should not be regarded as investment advice or as a recommendation regarding any particular security or course of
action. We recommend seeking a licensed professional for investment advice.
LOVE:NSD (The Lovesac Company)
Furnishings, Fixtures & Appliances | | Common Stock
Stock Target Advisor
Detailed Stock Report
Report Date: 13th June, 2022
Adjusted Closing Share Volume
Relative Returns Relative Performance (Total Returns)
Security Capital Gain Dividend Return Total Return
LOVE
The Lovesac Company
-65.2% 0 -65.2%
QQQ
Invesco QQQ Trust
-15.4% +0.4% -15%
Company Overview
The Lovesac Company designs, manufactures, and sells furniture. It offers sactionals, such as seats and sides; sacs, including foam beanbag
chairs; and accessories comprising drink holders, footsac blankets, decorative pillows, fitted seat tables, and ottomans. As of January 30,
2022, the company operated 146 showrooms. It markets its products primarily through lovesac.com website, as well as showrooms at top
tier malls, lifestyle centers, kiosks, mobile concierges, and street locations in 39 states of the United States; and in store pop-up- shops and
shop-in-shops. The Lovesac Company was founded in 1995 and is headquartered in Stamford, Connecticut.
3. Page 3 of 9 Any information in this report is not , and should not be regarded as investment advice or as a recommendation regarding any particular security or course of
action. We recommend seeking a licensed professional for investment advice.
Company Website
https://www.lovesac.com
Address
Two Landmark Square, Stamford, CT, United States, 06901
Fiscal Year End
January
Employees
607
Technical Indicators
Value Value
Beta 2.45 52 Week High 92.51
Short Ratio 7.13 52 Week Low 26.05
Shorted Shares 2,306,577 200 Day Moving Average 56.38
Shorted Shares Previous Month 2,168,945 50 Day Moving Average 41.46
Shares Held By Insiders 865.00% Short Percentage 17.00%
Shares Held by Institutions 103.40 Dividend Yield N/A
4. Page 4 of 9 Any information in this report is not , and should not be regarded as investment advice or as a recommendation regarding any particular security or course of
action. We recommend seeking a licensed professional for investment advice.
LOVE:NSD (The Lovesac Company)
Furnishings, Fixtures & Appliances | | Common Stock
Stock Target Advisor
Detailed Stock Report
Report Date: 13th June, 2022
Market Performance
Market Performance vs. Industry / Classification (Furnishings, Fixtures & Appliances) Market Performance vs. Exchange (Nasdaq Global Select)
Value Sector Median
Percentile
Rank
Grade Market Median Percentile Rank Grade
YTD
Capital Gain -51.98% -28.5% 15% -19.8% 23%
Dividend Return N/A 0.9% N/A 1.0% N/A
Total Return -51.98% -27.6% 15% -19.3% 23%
Trailing 12 Months
Capital Gain -65.18% -57.1% 37% -23.4% 25%
Dividend Return N/A 1.9% N/A 2.3% N/A
Total Return -65.18% -55.8% 37% -22.1% 25%
Trailing 5 Years
Capital Gain N/A -45.5% N/A 2.2% N/A
Dividend Return N/A 6.3% N/A 10.9% N/A
Total Return N/A -33.0% N/A 12.6% N/A
Average Annual (5 Year Horizon)
Capital Gain 79.20% 5.3% 95% 1.9% 93%
Dividend Return N/A 2.2% N/A 1.8% N/A
Total Return 79.20% 11.4% 95% 3.9% 93%
Risk Return Profile
Volatility (Standard
Deviation)
206.25% 54.4% 11% 31.9% 6%
Risk Adjusted Return 38.40% N/A 79% 19.0% 68%
Market Capitalization 0.48B 0.18B 79% 0.37B 59%
5. Page 5 of 9 Any information in this report is not , and should not be regarded as investment advice or as a recommendation regarding any particular security or course of
action. We recommend seeking a licensed professional for investment advice.
Key Financial Ratios
Ratios vs. Industry / Classification (Computer Hardware) Ratios vs. Exchange (Nasdaq Global Select)
Value Sector Median
Percentile
Rank
Grade Market Median Percentile Rank Grade
Market Value
peratio 11.2 17.5 71% 16.5 65%
pbratio 3.1 1.1 6% 1.6 28%
pcfratio 14.1 7.0 21% 0.0 22%
pfcfratio 10.8 11.9 53% 10.0 48%
Management Effectiveness
retequity 33.89% -3.9% 100% 0.7% 93%
retinvcap 34.89% 0.1% 100% -0.5% 94%
retass 7.75% -0.5% 90% 0.2% 88%
debtequityratio N/A 16.7% N/A 32.1% N/A
Technical Ratios
yield N/A 3.3% N/A 2.6% N/A
sratio 7.13 3.65 20% 3.06 17%
spercent 28.48% 3.1% 5% 3.0% 6%
beta 2.45 1.30 11% 1.09 6%
6. Page 6 of 9 Any information in this report is not , and should not be regarded as investment advice or as a recommendation regarding any particular security or course of
action. We recommend seeking a licensed professional for investment advice.
LOVE:NSD (The Lovesac Company)
Furnishings, Fixtures & Appliances | | Common Stock
Stock Target Advisor
Detailed Stock Report
Report Date: 13th June, 2022
Recent Analyst Ratings
Price Action Rating Action Analyst Rating Price date
Target Down BTIG Research USD 100 2022-06-09
Target Lowered by Stifel Nicolaus Research USD 110 » USD 90 2022-06-09
Maintains Canaccord Capital Buy USD 104 » USD 70 2022-06-09
Target Down Craig Hallum USD 100 2022-06-09
Downgraded D.A. Davidson USD 124 2022-06-02
Target Raised by BTIG Research Buy USD 113 » USD 118 2022-03-30
Target Raised by D.A. Davidson USD 111 » USD 135 2022-03-30
Target Raised by Canaccord Capital Buy » Buy USD 98 » USD 104 2021-12-09
Target Raised by D.A. Davidson Buy » Buy USD 100 » USD 111 2021-12-09
Target Raised by BTIG Research Buy » Buy USD 102 » USD 113 2021-12-09
Target Raised by Oppenheimer Holdings Outperform » Outperform USD 85 » USD 95 2021-12-09
Target Lowered by D.A. Davidson Buy USD 105 » USD 100 2021-12-01
Target Raised by BTIG Research Buy USD 98 » USD 102 2021-09-10
Reiterated by Roth Capital Buy USD 100 » USD 105 2021-09-10
Target Raised by Canaccord Capital Buy USD 77 » USD 98 2021-06-10
Maintains BTIG Research Buy USD 78 » USD 98 2021-06-10
Target Raised by Craig Hallum Buy USD 85 » USD 110 2021-06-10
Target Raised by Stifel Nicolaus Research Buy USD 75 » USD 105 2021-06-10
Maintains D.A. Davidson Buy USD 85 » USD 110 2021-06-10
Maintains Roth Capital Buy USD 95 » USD 100 2021-06-10
Target Raised by Roth Capital Positive » Buy USD 85 » USD 95 2021-06-08
Target Raised by Oppenheimer Holdings Outperform USD 60 » USD 85 2021-04-20
Maintains Roth Capital Buy USD 80 » USD 85 2021-04-15
Target Raised by D.A. Davidson Buy USD 57 » USD 85 2021-04-15
Target Raised by Craig Hallum USD 50 » USD 85 2021-04-14
7. Page 7 of 9 Any information in this report is not , and should not be regarded as investment advice or as a recommendation regarding any particular security or course of
action. We recommend seeking a licensed professional for investment advice.
LOVE:NSD (The Lovesac Company)
Furnishings, Fixtures & Appliances | | Common Stock
Stock Target Advisor
Detailed Stock Report
Report Date: 13th June, 2022
Annual Financial (USD)
8. Page 8 of 9 Any information in this report is not , and should not be regarded as investment advice or as a recommendation regarding any particular security or course of
action. We recommend seeking a licensed professional for investment advice.
LOVE:NSD (The Lovesac Company)
Furnishings, Fixtures & Appliances | | Common Stock
Stock Target Advisor
Detailed Stock Report
Report Date: 13th June, 2022
Quarterly Financial (USD)
9. Page 9 of 9 Any information in this report is not , and should not be regarded as investment advice or as a recommendation regarding any particular security or course of
action. We recommend seeking a licensed professional for investment advice.
LOVE:NSD (The Lovesac Company)
Furnishings, Fixtures & Appliances | | Common Stock
Stock Target Advisor
Detailed Stock Report
Report Date: 13th June, 2022
Largest Industry Peers for Furnishings, Fixtures & Appliances
Symbol Company Name Price(Change) Market Cap
MLHR Herman Miller Inc N/A USD 2.95B
IRBT iRobot Corporation N/A USD 1.10B
TILE Interface Inc N/A USD 0.84B
AMWD American Woodmark Corporation N/A USD 0.84B
SNBR Sleep Number Corp N/A USD 0.83B
PRPL Purple Innovation Inc N/A USD 0.37B
KBAL Kimball International Inc N/A USD 0.32B
LCUT Lifetime Brands Inc N/A USD 0.26B
HOFT Hooker Furniture Corporation N/A USD 0.20B
ATER Aterian Inc N/A USD 0.18B
The Stock Target Advisor platform run millions of calculations every day on over 30,000 Canadian and American stocks, comparing and
ranking their financial and market performance against their sectors and exchange.
We represent the percentile ranking using the following grading system.
Letter Grade Percentage Letter Grade Percentage Letter Grade Percentage
A+ 97%-100% A 93%-96% A- 90%-92%
B+ 97%-89% B 83%-86% B- 80%-82%
C+ 77%-79% C 73%-76% C- 70%-72%
D+ 67%-69% D 63%-66% D- 60%-62%
F 0%-59%