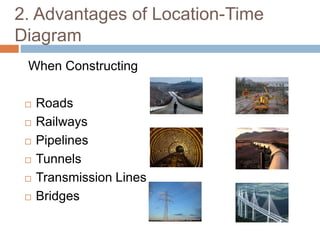
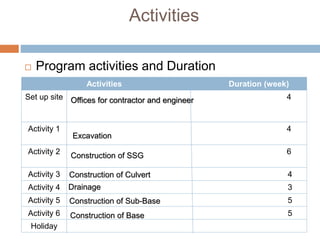
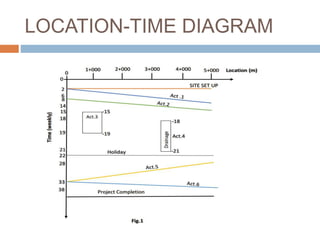
This document discusses the location-time diagram, a method for graphically presenting time schedules for longitudinal construction projects like roads, bridges and pipelines. It shows activities along both a time and distance axis to indicate their location and progress rate. The advantages are that it clearly communicates the project scope and schedule in one view and shows activity order, location and relationships. The disadvantages are that it is time-consuming to produce and update, activities' logical relationships may not be retained for large projects, and critical paths require visual interpretation. An example location-time diagram is provided.