Downloaded 248 times

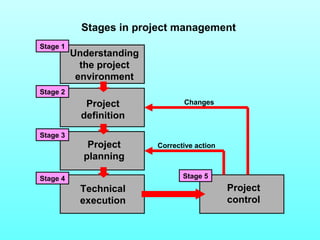
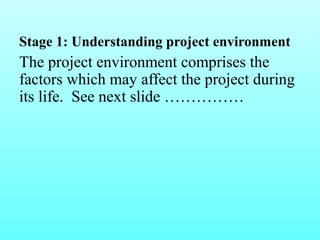
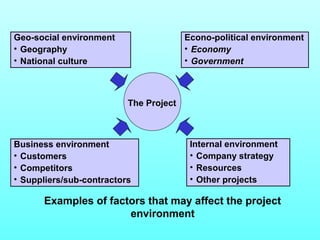
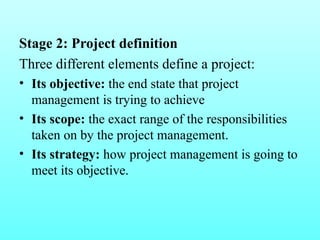

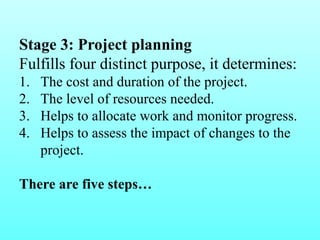
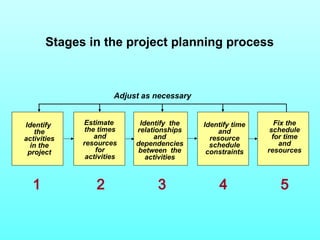

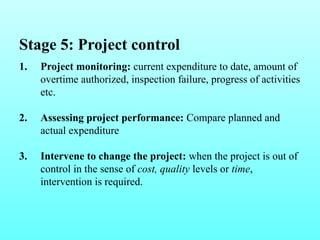
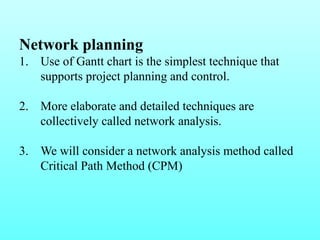
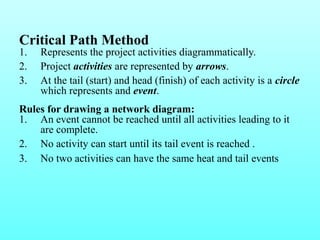


The document discusses project planning and control, covering what a project is, the stages of project management, and network planning using the Critical Path Method (CPM). It describes the five stages of project management as understanding the project environment, defining the project, planning the project, technical execution, and project control. Project planning determines the cost, duration, resource needs, and helps allocate work and monitor progress. The CPM represents activities diagrammatically and identifies the critical path which determines the minimum project duration.