SlideShare a Scribd company logo
Power BI Tips
and Timesavers
Show Values
in Rows in
Power BI
The Matrix visual in Power BI is similar to a Pivot Table in Excel
But it is not quite as intuitive, which can lead to many users being
frustrated by an apparent lack of a way to do something which is straight
forward in Excel
That is to show values in rows
Start with a simple
Matrix Visual
We have a simple
matrix with Category
set as a row
And the values
aggregating for Sales
Amount and Order
Quantity
Now go into the settings
Now we need to apply a setting to change
the positioning of the value fields
Make sure the visual is selected on the
canvas by clicking on it
Then go to the Visualizations panel and click
on the Format your visual icon
Go to the Values Section
Scroll down to the Values Section
and hit the chevron to expand
the options
Then scroll down to the bottom
of this section, and enable the
option to switch values to rows
option
Now your Values are
shown as Row groups
rather than columns
Each Value field you add
to the visual will add a
new measure rows
within each category
Adjust the Alignment
By Default the stepped layout indentation is
not too clear
To Increase the indent, go to format visual,
row headers and options
Increase the value using the slider to at
least 20 to make the visual easier to read
After Adjusting the Stepped
Layout Indentation
This Power BI Tip is one of those that is not immediately apparent
We often see users who are not aware of this setting who a struggling to
find the way to set the matrix up as it needs to be
We hope you find this useful
For more Tips, Tricks and
Timesavers, visit our website
Business Analytics Blog – Select Distinct
Credit: simon.harrison@selectdistinct.co.uk

More Related Content

Similar to How to flip values to rows in a matrix in Power BI

Power BI Data Modeling.pdf
Power BI Data Modeling.pdfPower BI Data Modeling.pdf
Power BI Data Modeling.pdfVishnuGone
 
Financial reporting rpd using obiee
Financial reporting rpd using obieeFinancial reporting rpd using obiee
Financial reporting rpd using obieeAmit Sharma
 
Financial reporting rpd using obiee
Financial reporting rpd using obieeFinancial reporting rpd using obiee
Financial reporting rpd using obieeAmit Sharma
 
Financial reporting rpd using obiee
Financial reporting rpd using obieeFinancial reporting rpd using obiee
Financial reporting rpd using obieeAmit Sharma
 
I Simply Excel
I Simply ExcelI Simply Excel
I Simply ExcelEric Couch
 
ETL Microsoft Material
ETL Microsoft MaterialETL Microsoft Material
ETL Microsoft MaterialAhmed Hashem
 
Top 5 Power BI tips 2023 most popular blog posts
Top 5 Power BI tips 2023 most popular blog postsTop 5 Power BI tips 2023 most popular blog posts
Top 5 Power BI tips 2023 most popular blog postsSelect Distinct Limited
 
Learn Database Design with MySQL - Chapter 6 - Database design process
Learn Database Design with MySQL - Chapter 6 - Database design processLearn Database Design with MySQL - Chapter 6 - Database design process
Learn Database Design with MySQL - Chapter 6 - Database design processEduonix Learning Solutions
 
Tableau1 Basics-Dashboards.pptx
Tableau1 Basics-Dashboards.pptxTableau1 Basics-Dashboards.pptx
Tableau1 Basics-Dashboards.pptxChongHuiYee
 
How to Set Up Power BI Sales Dashboard.pdf
How to Set Up Power BI Sales Dashboard.pdfHow to Set Up Power BI Sales Dashboard.pdf
How to Set Up Power BI Sales Dashboard.pdfKavika Roy
 
Power BI Report.pdf
Power BI Report.pdfPower BI Report.pdf
Power BI Report.pdfVishnuGone
 
In Mind Cloud - Product Release - 2208
In Mind Cloud - Product Release - 2208In Mind Cloud - Product Release - 2208
In Mind Cloud - Product Release - 2208In Mind Cloud
 
2580 microsoft excel2010_rtm_wsg_external
2580 microsoft excel2010_rtm_wsg_external2580 microsoft excel2010_rtm_wsg_external
2580 microsoft excel2010_rtm_wsg_externalBrittanyShatia
 
Slide Makeover #85: Showing performance compared to past and budget
Slide Makeover #85:Showing performance compared to past and budgetSlide Makeover #85:Showing performance compared to past and budget
Slide Makeover #85: Showing performance compared to past and budgetDave Paradi
 
Tableau online training || Tableau Server
Tableau online training || Tableau ServerTableau online training || Tableau Server
Tableau online training || Tableau ServerUnited Trainings
 

Similar to How to flip values to rows in a matrix in Power BI (20)

Power BI Data Modeling.pdf
Power BI Data Modeling.pdfPower BI Data Modeling.pdf
Power BI Data Modeling.pdf
 
Financial reporting rpd using obiee
Financial reporting rpd using obieeFinancial reporting rpd using obiee
Financial reporting rpd using obiee
 
Financial reporting rpd using obiee
Financial reporting rpd using obieeFinancial reporting rpd using obiee
Financial reporting rpd using obiee
 
Financial reporting rpd using obiee
Financial reporting rpd using obieeFinancial reporting rpd using obiee
Financial reporting rpd using obiee
 
Epic net content
Epic net contentEpic net content
Epic net content
 
Power BI Tips Drill through.pptx
Power BI Tips Drill through.pptxPower BI Tips Drill through.pptx
Power BI Tips Drill through.pptx
 
I Simply Excel
I Simply ExcelI Simply Excel
I Simply Excel
 
ETL Microsoft Material
ETL Microsoft MaterialETL Microsoft Material
ETL Microsoft Material
 
Top 5 Power BI tips 2023 most popular blog posts
Top 5 Power BI tips 2023 most popular blog postsTop 5 Power BI tips 2023 most popular blog posts
Top 5 Power BI tips 2023 most popular blog posts
 
Learn Database Design with MySQL - Chapter 6 - Database design process
Learn Database Design with MySQL - Chapter 6 - Database design processLearn Database Design with MySQL - Chapter 6 - Database design process
Learn Database Design with MySQL - Chapter 6 - Database design process
 
Power BI KPIs
Power BI KPIsPower BI KPIs
Power BI KPIs
 
How to use Power Pivot in Excel
How to use Power Pivot in ExcelHow to use Power Pivot in Excel
How to use Power Pivot in Excel
 
Cube remodelling
Cube remodellingCube remodelling
Cube remodelling
 
Tableau1 Basics-Dashboards.pptx
Tableau1 Basics-Dashboards.pptxTableau1 Basics-Dashboards.pptx
Tableau1 Basics-Dashboards.pptx
 
How to Set Up Power BI Sales Dashboard.pdf
How to Set Up Power BI Sales Dashboard.pdfHow to Set Up Power BI Sales Dashboard.pdf
How to Set Up Power BI Sales Dashboard.pdf
 
Power BI Report.pdf
Power BI Report.pdfPower BI Report.pdf
Power BI Report.pdf
 
In Mind Cloud - Product Release - 2208
In Mind Cloud - Product Release - 2208In Mind Cloud - Product Release - 2208
In Mind Cloud - Product Release - 2208
 
2580 microsoft excel2010_rtm_wsg_external
2580 microsoft excel2010_rtm_wsg_external2580 microsoft excel2010_rtm_wsg_external
2580 microsoft excel2010_rtm_wsg_external
 
Slide Makeover #85: Showing performance compared to past and budget
Slide Makeover #85:Showing performance compared to past and budgetSlide Makeover #85:Showing performance compared to past and budget
Slide Makeover #85: Showing performance compared to past and budget
 
Tableau online training || Tableau Server
Tableau online training || Tableau ServerTableau online training || Tableau Server
Tableau online training || Tableau Server
 

More from Select Distinct Limited

Year on Year Comparison in Power BI.pptx
Year on Year Comparison in Power BI.pptxYear on Year Comparison in Power BI.pptx
Year on Year Comparison in Power BI.pptxSelect Distinct Limited
 
Sync Slicers in Power BI a step by step guide
Sync Slicers in Power BI a step by step guideSync Slicers in Power BI a step by step guide
Sync Slicers in Power BI a step by step guideSelect Distinct Limited
 
Using Google Search Console Data in Power BI.pptx
Using Google Search Console Data in Power BI.pptxUsing Google Search Console Data in Power BI.pptx
Using Google Search Console Data in Power BI.pptxSelect Distinct Limited
 
Data Lake v Data Warehouse. What is the difference?
Data Lake v Data Warehouse. What is the difference?Data Lake v Data Warehouse. What is the difference?
Data Lake v Data Warehouse. What is the difference?Select Distinct Limited
 
How to Create Drop Down Lists in Excel, step by step
How to Create Drop Down Lists in Excel, step by stepHow to Create Drop Down Lists in Excel, step by step
How to Create Drop Down Lists in Excel, step by stepSelect Distinct Limited
 
Top 5 SQL Tips and Timesaver 2023, our most popular posts
Top 5 SQL Tips and Timesaver 2023, our most popular postsTop 5 SQL Tips and Timesaver 2023, our most popular posts
Top 5 SQL Tips and Timesaver 2023, our most popular postsSelect Distinct Limited
 
When to transform data for Power BI.pptx
When to transform data for Power BI.pptxWhen to transform data for Power BI.pptx
When to transform data for Power BI.pptxSelect Distinct Limited
 
Direction of travel on a map in Power BI.pptx
Direction of travel on a map in Power BI.pptxDirection of travel on a map in Power BI.pptx
Direction of travel on a map in Power BI.pptxSelect Distinct Limited
 
Power BI Connect to Google BigQuery.pptx
Power BI Connect to Google BigQuery.pptxPower BI Connect to Google BigQuery.pptx
Power BI Connect to Google BigQuery.pptxSelect Distinct Limited
 
How to use a slicer to toggle measures in Power BI
How to use a slicer to toggle measures in Power BIHow to use a slicer to toggle measures in Power BI
How to use a slicer to toggle measures in Power BISelect Distinct Limited
 

More from Select Distinct Limited (20)

Year on Year Comparison in Power BI.pptx
Year on Year Comparison in Power BI.pptxYear on Year Comparison in Power BI.pptx
Year on Year Comparison in Power BI.pptx
 
Sync Slicers in Power BI a step by step guide
Sync Slicers in Power BI a step by step guideSync Slicers in Power BI a step by step guide
Sync Slicers in Power BI a step by step guide
 
Using Google Search Console Data in Power BI.pptx
Using Google Search Console Data in Power BI.pptxUsing Google Search Console Data in Power BI.pptx
Using Google Search Console Data in Power BI.pptx
 
Data Lake v Data Warehouse. What is the difference?
Data Lake v Data Warehouse. What is the difference?Data Lake v Data Warehouse. What is the difference?
Data Lake v Data Warehouse. What is the difference?
 
How to Create Drop Down Lists in Excel, step by step
How to Create Drop Down Lists in Excel, step by stepHow to Create Drop Down Lists in Excel, step by step
How to Create Drop Down Lists in Excel, step by step
 
Top 5 SQL Tips and Timesaver 2023, our most popular posts
Top 5 SQL Tips and Timesaver 2023, our most popular postsTop 5 SQL Tips and Timesaver 2023, our most popular posts
Top 5 SQL Tips and Timesaver 2023, our most popular posts
 
CTEs in SQL.pptx
CTEs in SQL.pptxCTEs in SQL.pptx
CTEs in SQL.pptx
 
Divide by Zero Errors
Divide by Zero ErrorsDivide by Zero Errors
Divide by Zero Errors
 
When to transform data for Power BI.pptx
When to transform data for Power BI.pptxWhen to transform data for Power BI.pptx
When to transform data for Power BI.pptx
 
Direction of travel on a map in Power BI.pptx
Direction of travel on a map in Power BI.pptxDirection of travel on a map in Power BI.pptx
Direction of travel on a map in Power BI.pptx
 
UNION in DAX
UNION in DAXUNION in DAX
UNION in DAX
 
APPEND data in Power Query
APPEND data in Power QueryAPPEND data in Power Query
APPEND data in Power Query
 
Power BI Connect to Google BigQuery.pptx
Power BI Connect to Google BigQuery.pptxPower BI Connect to Google BigQuery.pptx
Power BI Connect to Google BigQuery.pptx
 
Group by ROLLUP in SQL Server
Group by ROLLUP in SQL ServerGroup by ROLLUP in SQL Server
Group by ROLLUP in SQL Server
 
Advanced Top N Measures in Power BI
Advanced Top N Measures in Power BIAdvanced Top N Measures in Power BI
Advanced Top N Measures in Power BI
 
Custom Formats in Power BI
Custom Formats in Power BICustom Formats in Power BI
Custom Formats in Power BI
 
Power BI Tips Top N Measures.pptx
Power BI Tips Top N Measures.pptxPower BI Tips Top N Measures.pptx
Power BI Tips Top N Measures.pptx
 
SQL Tips UNPIVOT Function.pptx
SQL Tips UNPIVOT Function.pptxSQL Tips UNPIVOT Function.pptx
SQL Tips UNPIVOT Function.pptx
 
How to PIVOT in SQL
How to PIVOT in SQLHow to PIVOT in SQL
How to PIVOT in SQL
 
How to use a slicer to toggle measures in Power BI
How to use a slicer to toggle measures in Power BIHow to use a slicer to toggle measures in Power BI
How to use a slicer to toggle measures in Power BI
 

Recently uploaded

社内勉強会資料_LLM Agents                              .
社内勉強会資料_LLM Agents                              .社内勉強会資料_LLM Agents                              .
社内勉強会資料_LLM Agents                              .NABLAS株式会社
 
Exploratory Data Analysis - Dilip S.pptx
Exploratory Data Analysis - Dilip S.pptxExploratory Data Analysis - Dilip S.pptx
Exploratory Data Analysis - Dilip S.pptxDilipVasan
 
Investigate & Recover / StarCompliance.io / Crypto_Crimes
Investigate & Recover / StarCompliance.io / Crypto_CrimesInvestigate & Recover / StarCompliance.io / Crypto_Crimes
Investigate & Recover / StarCompliance.io / Crypto_CrimesStarCompliance.io
 
Supply chain analytics to combat the effects of Ukraine-Russia-conflict
Supply chain analytics to combat the effects of Ukraine-Russia-conflictSupply chain analytics to combat the effects of Ukraine-Russia-conflict
Supply chain analytics to combat the effects of Ukraine-Russia-conflictJack Cole
 
Innovative Methods in Media and Communication Research by Sebastian Kubitschk...
Innovative Methods in Media and Communication Research by Sebastian Kubitschk...Innovative Methods in Media and Communication Research by Sebastian Kubitschk...
Innovative Methods in Media and Communication Research by Sebastian Kubitschk...correoyaya
 
2024 Q1 Tableau User Group Leader Quarterly Call
2024 Q1 Tableau User Group Leader Quarterly Call2024 Q1 Tableau User Group Leader Quarterly Call
2024 Q1 Tableau User Group Leader Quarterly Calllward7
 
Artificial_General_Intelligence__storm_gen_article.pdf
Artificial_General_Intelligence__storm_gen_article.pdfArtificial_General_Intelligence__storm_gen_article.pdf
Artificial_General_Intelligence__storm_gen_article.pdfscitechtalktv
 
Using PDB Relocation to Move a Single PDB to Another Existing CDB
Using PDB Relocation to Move a Single PDB to Another Existing CDBUsing PDB Relocation to Move a Single PDB to Another Existing CDB
Using PDB Relocation to Move a Single PDB to Another Existing CDBAlireza Kamrani
 
Jpolillo Amazon PPC - Bid Optimization Sample
Jpolillo Amazon PPC - Bid Optimization SampleJpolillo Amazon PPC - Bid Optimization Sample
Jpolillo Amazon PPC - Bid Optimization SampleJames Polillo
 
How can I successfully sell my pi coins in Philippines?
How can I successfully sell my pi coins in Philippines?How can I successfully sell my pi coins in Philippines?
How can I successfully sell my pi coins in Philippines?DOT TECH
 
Business update Q1 2024 Lar España Real Estate SOCIMI
Business update Q1 2024 Lar España Real Estate SOCIMIBusiness update Q1 2024 Lar España Real Estate SOCIMI
Business update Q1 2024 Lar España Real Estate SOCIMIAlejandraGmez176757
 
Tabula.io Cheatsheet: automate your data workflows
Tabula.io Cheatsheet: automate your data workflowsTabula.io Cheatsheet: automate your data workflows
Tabula.io Cheatsheet: automate your data workflowsalex933524
 
2024 Q2 Orange County (CA) Tableau User Group Meeting
2024 Q2 Orange County (CA) Tableau User Group Meeting2024 Q2 Orange County (CA) Tableau User Group Meeting
2024 Q2 Orange County (CA) Tableau User Group MeetingAlison Pitt
 
Webinar One View, Multiple Systems No-Code Integration of Salesforce and ERPs
Webinar One View, Multiple Systems No-Code Integration of Salesforce and ERPsWebinar One View, Multiple Systems No-Code Integration of Salesforce and ERPs
Webinar One View, Multiple Systems No-Code Integration of Salesforce and ERPsCEPTES Software Inc
 
Pre-ProductionImproveddsfjgndflghtgg.pptx
Pre-ProductionImproveddsfjgndflghtgg.pptxPre-ProductionImproveddsfjgndflghtgg.pptx
Pre-ProductionImproveddsfjgndflghtgg.pptxStephen266013
 
2024-05-14 - Tableau User Group - TC24 Hot Topics - Tableau Pulse and Einstei...
2024-05-14 - Tableau User Group - TC24 Hot Topics - Tableau Pulse and Einstei...2024-05-14 - Tableau User Group - TC24 Hot Topics - Tableau Pulse and Einstei...
2024-05-14 - Tableau User Group - TC24 Hot Topics - Tableau Pulse and Einstei...elinavihriala
 
basics of data science with application areas.pdf
basics of data science with application areas.pdfbasics of data science with application areas.pdf
basics of data science with application areas.pdfvyankatesh1
 
AI Imagen for data-storytelling Infographics.pdf
AI Imagen for data-storytelling Infographics.pdfAI Imagen for data-storytelling Infographics.pdf
AI Imagen for data-storytelling Infographics.pdfMichaelSenkow
 
how can i exchange pi coins for others currency like Bitcoin
how can i exchange pi coins for others currency like Bitcoinhow can i exchange pi coins for others currency like Bitcoin
how can i exchange pi coins for others currency like BitcoinDOT TECH
 

Recently uploaded (20)

社内勉強会資料_LLM Agents                              .
社内勉強会資料_LLM Agents                              .社内勉強会資料_LLM Agents                              .
社内勉強会資料_LLM Agents                              .
 
Exploratory Data Analysis - Dilip S.pptx
Exploratory Data Analysis - Dilip S.pptxExploratory Data Analysis - Dilip S.pptx
Exploratory Data Analysis - Dilip S.pptx
 
Investigate & Recover / StarCompliance.io / Crypto_Crimes
Investigate & Recover / StarCompliance.io / Crypto_CrimesInvestigate & Recover / StarCompliance.io / Crypto_Crimes
Investigate & Recover / StarCompliance.io / Crypto_Crimes
 
Supply chain analytics to combat the effects of Ukraine-Russia-conflict
Supply chain analytics to combat the effects of Ukraine-Russia-conflictSupply chain analytics to combat the effects of Ukraine-Russia-conflict
Supply chain analytics to combat the effects of Ukraine-Russia-conflict
 
Innovative Methods in Media and Communication Research by Sebastian Kubitschk...
Innovative Methods in Media and Communication Research by Sebastian Kubitschk...Innovative Methods in Media and Communication Research by Sebastian Kubitschk...
Innovative Methods in Media and Communication Research by Sebastian Kubitschk...
 
2024 Q1 Tableau User Group Leader Quarterly Call
2024 Q1 Tableau User Group Leader Quarterly Call2024 Q1 Tableau User Group Leader Quarterly Call
2024 Q1 Tableau User Group Leader Quarterly Call
 
Artificial_General_Intelligence__storm_gen_article.pdf
Artificial_General_Intelligence__storm_gen_article.pdfArtificial_General_Intelligence__storm_gen_article.pdf
Artificial_General_Intelligence__storm_gen_article.pdf
 
Using PDB Relocation to Move a Single PDB to Another Existing CDB
Using PDB Relocation to Move a Single PDB to Another Existing CDBUsing PDB Relocation to Move a Single PDB to Another Existing CDB
Using PDB Relocation to Move a Single PDB to Another Existing CDB
 
Jpolillo Amazon PPC - Bid Optimization Sample
Jpolillo Amazon PPC - Bid Optimization SampleJpolillo Amazon PPC - Bid Optimization Sample
Jpolillo Amazon PPC - Bid Optimization Sample
 
How can I successfully sell my pi coins in Philippines?
How can I successfully sell my pi coins in Philippines?How can I successfully sell my pi coins in Philippines?
How can I successfully sell my pi coins in Philippines?
 
Business update Q1 2024 Lar España Real Estate SOCIMI
Business update Q1 2024 Lar España Real Estate SOCIMIBusiness update Q1 2024 Lar España Real Estate SOCIMI
Business update Q1 2024 Lar España Real Estate SOCIMI
 
Tabula.io Cheatsheet: automate your data workflows
Tabula.io Cheatsheet: automate your data workflowsTabula.io Cheatsheet: automate your data workflows
Tabula.io Cheatsheet: automate your data workflows
 
2024 Q2 Orange County (CA) Tableau User Group Meeting
2024 Q2 Orange County (CA) Tableau User Group Meeting2024 Q2 Orange County (CA) Tableau User Group Meeting
2024 Q2 Orange County (CA) Tableau User Group Meeting
 
Webinar One View, Multiple Systems No-Code Integration of Salesforce and ERPs
Webinar One View, Multiple Systems No-Code Integration of Salesforce and ERPsWebinar One View, Multiple Systems No-Code Integration of Salesforce and ERPs
Webinar One View, Multiple Systems No-Code Integration of Salesforce and ERPs
 
Pre-ProductionImproveddsfjgndflghtgg.pptx
Pre-ProductionImproveddsfjgndflghtgg.pptxPre-ProductionImproveddsfjgndflghtgg.pptx
Pre-ProductionImproveddsfjgndflghtgg.pptx
 
Slip-and-fall Injuries: Top Workers' Comp Claims
Slip-and-fall Injuries: Top Workers' Comp ClaimsSlip-and-fall Injuries: Top Workers' Comp Claims
Slip-and-fall Injuries: Top Workers' Comp Claims
 
2024-05-14 - Tableau User Group - TC24 Hot Topics - Tableau Pulse and Einstei...
2024-05-14 - Tableau User Group - TC24 Hot Topics - Tableau Pulse and Einstei...2024-05-14 - Tableau User Group - TC24 Hot Topics - Tableau Pulse and Einstei...
2024-05-14 - Tableau User Group - TC24 Hot Topics - Tableau Pulse and Einstei...
 
basics of data science with application areas.pdf
basics of data science with application areas.pdfbasics of data science with application areas.pdf
basics of data science with application areas.pdf
 
AI Imagen for data-storytelling Infographics.pdf
AI Imagen for data-storytelling Infographics.pdfAI Imagen for data-storytelling Infographics.pdf
AI Imagen for data-storytelling Infographics.pdf
 
how can i exchange pi coins for others currency like Bitcoin
how can i exchange pi coins for others currency like Bitcoinhow can i exchange pi coins for others currency like Bitcoin
how can i exchange pi coins for others currency like Bitcoin
 

How to flip values to rows in a matrix in Power BI

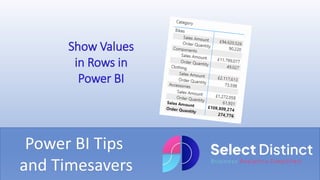
  • 1. Power BI Tips and Timesavers Show Values in Rows in Power BI
  • 2. The Matrix visual in Power BI is similar to a Pivot Table in Excel But it is not quite as intuitive, which can lead to many users being frustrated by an apparent lack of a way to do something which is straight forward in Excel That is to show values in rows
  • 3. Start with a simple Matrix Visual We have a simple matrix with Category set as a row And the values aggregating for Sales Amount and Order Quantity
  • 4. Now go into the settings Now we need to apply a setting to change the positioning of the value fields Make sure the visual is selected on the canvas by clicking on it Then go to the Visualizations panel and click on the Format your visual icon
  • 5. Go to the Values Section Scroll down to the Values Section and hit the chevron to expand the options Then scroll down to the bottom of this section, and enable the option to switch values to rows option
  • 6. Now your Values are shown as Row groups rather than columns Each Value field you add to the visual will add a new measure rows within each category
  • 7. Adjust the Alignment By Default the stepped layout indentation is not too clear To Increase the indent, go to format visual, row headers and options Increase the value using the slider to at least 20 to make the visual easier to read
  • 8. After Adjusting the Stepped Layout Indentation
  • 9. This Power BI Tip is one of those that is not immediately apparent We often see users who are not aware of this setting who a struggling to find the way to set the matrix up as it needs to be We hope you find this useful
  • 10. For more Tips, Tricks and Timesavers, visit our website Business Analytics Blog – Select Distinct Credit: simon.harrison@selectdistinct.co.uk