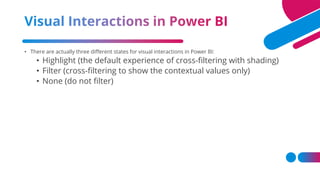
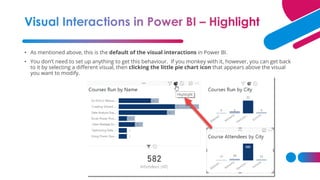
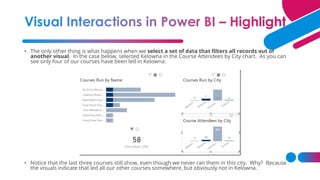
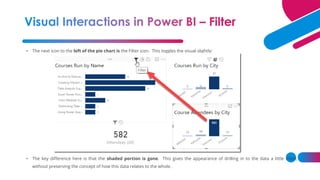
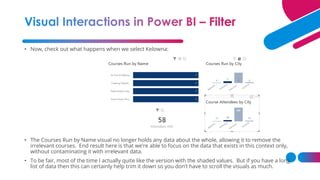
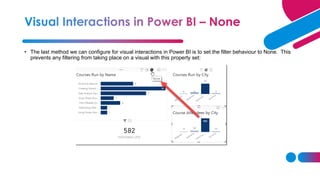
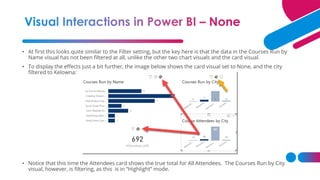
The document discusses different types of visual interactions in Power BI reports: Highlight, Filter, and None. It explains how each interaction type affects cross-filtering and data shown in visuals. It also covers setting different interaction types for individual visuals and how that impacts cross-filtering. Examples are provided to illustrate the behavior of each interaction type.
This session will show some useful data visualisation tips and how they can be used in Oracle Business Intelligence and Data Visualization Cloud Services
Prepared as part of the IT for Business Intelligence course of MBA @VGSOM, IIT Kharagpur. The tutorial describes how to create an interactive map using the open source software QGIS.
Make a floating column chart in excel. Includes four fun examples of floating column charts. Also a neat tip on adding a degree notation format to your data in excel.
Needs some basic knowledge of making charts in excel, or refer my previous tutorial. for beginners.
Level - Medium. 2nd in a series on Column Charts, 4th in my series on Charts.
IBM Planning Analytics Workspace (PAW) is a web-based interface for IBM Cogno...Hemant571882
IBM Planning Analytics Workspace (PAW) is a web-based interface for IBM Cognos TM1. It brings new exciting possibilities in terms of visualization of your TM1 data.
It is a view-based application which allows you to analyze data, plan and create new content. This is achieved primarily by using the built-in drag-and-drop tools, that come shipped with the product to build dashboards and reports.
Service Analysis - Microsoft Dynamics CRM 2016 Customer ServiceNaveen Kumar
Using default Service Dashboards
The PowerBI Service dashboard’s capabilities
Working with service reports and charts
Goals and how they apply to service
Tableau online training and tableau desktop training by United Trainings.
http://unitedtrainings.com/tableau-online-training/
Whatsapp / call :- +91 - 9100 77 3003/2 ,
Email: info@unitedtrainings.com
Tableau training uk,
Tableau online training,
Tableau training in hyderabad,
Tableau training in bangalore,
Tableau training online,
Tableau online course,
Tableau desktop training,
Tableau interview questions,
Tableau certification,
Tableau training material,
Tableau training chennai,
Tableau training pune,
Qlikview online training,
Qlikview training videos,
Qlikview designer training,
Qlikview certification,
Qlikview interview questions,
Qlikview training in hyderabad
Tableau online training and tableau desktop training by United Trainings.
http://unitedtrainings.com/tableau-online-training/
Whatsapp / call :- +91 - 9100 77 3003/2 ,
Email: info@unitedtrainings.com
Tableau training chicago,
Tableau online training,
Tableau training in hyderabad,
Tableau training in bangalore,
Tableau training online,
Tableau online course,
Tableau developer training,
Tableau interview questions,
Tableau certification,
Tableau training material,
Tableau training chennai,
Tableau training pune,
Qlikview online training,
Qlikview training videos,
Qlikview designer training
Slide Makeover #91: Comparing Revenue components to previous yearDave Paradi
Explaining the components of total revenue in an organization is an important message. Often we want to compare it to the amount contributed by each component in the previous year to see where the differences come from. This makeover shows how you can use a “steps to a total” graph instead of a spreadsheet or table of numbers.
How to make a sales pipeline sales funnel excel chartSteveEqualsTrue
Tutorial to make a sales Funnel chart or sales pipeline chart in excel for your executive dashboard template. Includes links for a free excel dashboard template file and video demonstration.
"Understand the concept of Revit detailing drawings. As generating a good set of construction, drawings play an essential factor for making the excellent model of BIM (Building Information Modeling)
Tableau online training and tableau desktop , tableau admin
tableau certification, tableau interview questions, tableau training institutes in hyderabad, tableau training institutes in Bangalore
Odoo is an enterprise resource management software that is applicable to all kind of business domains.
This is simply amazing because it covers all business requirements such as sale, purchase, billing, accounting, manufacturing, warehouse, project management etc in a single software.
Also, they are integrated to each other.
Introduction, Terminology and concepts, Introduction to statistics, Central tendencies and distributions, Variance, Distribution properties and arithmetic, Samples/CLT, Basic machine learning algorithms, Linear regression, SVM, Naive Bayes
Module 4: Data visualization (8 hrs)
Introduction, Types of data visualization, Data for visualization: Data types, Data encodings, Retinal variables, Mapping variables to encodings, Visual encodings, Data Visualization in Python-Superset or in Microsoft Power BI
TIME STUDY: Time Study, Definition, time study equipment, selection of job, steps in time study. Breaking jobs into elements, recording information. Rating & standard Rating, standard performance, scale of rating, factors of affecting rate of working, allowances and standard time determination. Predetermined motion time study – Method time measurement (MTM)
MICRO AND MEMO MOTION STUDY: Charts to record moment at work place – principles of motion economy, classification of moments two handed process chart, SIMO chart, and micro motion study. Development, definition and installation of the improved method, brief concept about synthetic motion studies. Management
Unit 2 :
Work Study: Definition, objective and scope of work study. Human factors in work study. Work study and management.
Method Study: Definition, objective and scope of method study, activity recording and exam aids. Charts to record moments in shop operation – process charts, flow process charts, travel charts and multiple activity charts.
Work Study: Definition, objective and scope of work study. Human factors in work study. Work study and management.
Method Study: Definition, objective and scope of method study, activity recording index aids. Charts to record moments in shop operation – process charts, flow process charts, travel charts and multiple activity charts.
Industrial Management: Meaning, Definition, Objective, Need, Scope, Evolution and developments.
Productivity: Definition of productivity, Measurement of productivity, factors affecting the productivity, productivity improvement programs.
Industrial Management: Meaning, Definition, Objective, Need, Scope, Evolution and developments.
Productivity: Definition of productivity, Measurement of productivity, factors affecting the productivity, productivity improvement programs.
Industrial Management: Meaning, Definition, Objective, Need, Scope, Evolution and developments.
Productivity: Definition of productivity, Measurement of productivity, factors affecting the productivity, productivity improvement programs.
Industrial Management: Meaning, Definition, Objective, Need, Scope, Evolution and developments.
Productivity: Definition of productivity, Measurement of productivity, factors affecting the productivity, productivity improvement programs.
Sachpazis:Terzaghi Bearing Capacity Estimation in simple terms with Calculati...Dr.Costas Sachpazis
Terzaghi's soil bearing capacity theory, developed by Karl Terzaghi, is a fundamental principle in geotechnical engineering used to determine the bearing capacity of shallow foundations. This theory provides a method to calculate the ultimate bearing capacity of soil, which is the maximum load per unit area that the soil can support without undergoing shear failure. The Calculation HTML Code included.
Hybrid optimization of pumped hydro system and solar- Engr. Abdul-Azeez.pdffxintegritypublishin
Advancements in technology unveil a myriad of electrical and electronic breakthroughs geared towards efficiently harnessing limited resources to meet human energy demands. The optimization of hybrid solar PV panels and pumped hydro energy supply systems plays a pivotal role in utilizing natural resources effectively. This initiative not only benefits humanity but also fosters environmental sustainability. The study investigated the design optimization of these hybrid systems, focusing on understanding solar radiation patterns, identifying geographical influences on solar radiation, formulating a mathematical model for system optimization, and determining the optimal configuration of PV panels and pumped hydro storage. Through a comparative analysis approach and eight weeks of data collection, the study addressed key research questions related to solar radiation patterns and optimal system design. The findings highlighted regions with heightened solar radiation levels, showcasing substantial potential for power generation and emphasizing the system's efficiency. Optimizing system design significantly boosted power generation, promoted renewable energy utilization, and enhanced energy storage capacity. The study underscored the benefits of optimizing hybrid solar PV panels and pumped hydro energy supply systems for sustainable energy usage. Optimizing the design of solar PV panels and pumped hydro energy supply systems as examined across diverse climatic conditions in a developing country, not only enhances power generation but also improves the integration of renewable energy sources and boosts energy storage capacities, particularly beneficial for less economically prosperous regions. Additionally, the study provides valuable insights for advancing energy research in economically viable areas. Recommendations included conducting site-specific assessments, utilizing advanced modeling tools, implementing regular maintenance protocols, and enhancing communication among system components.
Saudi Arabia stands as a titan in the global energy landscape, renowned for its abundant oil and gas resources. It's the largest exporter of petroleum and holds some of the world's most significant reserves. Let's delve into the top 10 oil and gas projects shaping Saudi Arabia's energy future in 2024.
Explore the innovative world of trenchless pipe repair with our comprehensive guide, "The Benefits and Techniques of Trenchless Pipe Repair." This document delves into the modern methods of repairing underground pipes without the need for extensive excavation, highlighting the numerous advantages and the latest techniques used in the industry.
Learn about the cost savings, reduced environmental impact, and minimal disruption associated with trenchless technology. Discover detailed explanations of popular techniques such as pipe bursting, cured-in-place pipe (CIPP) lining, and directional drilling. Understand how these methods can be applied to various types of infrastructure, from residential plumbing to large-scale municipal systems.
Ideal for homeowners, contractors, engineers, and anyone interested in modern plumbing solutions, this guide provides valuable insights into why trenchless pipe repair is becoming the preferred choice for pipe rehabilitation. Stay informed about the latest advancements and best practices in the field.
Industrial Training at Shahjalal Fertilizer Company Limited (SFCL)MdTanvirMahtab2
This presentation is about the working procedure of Shahjalal Fertilizer Company Limited (SFCL). A Govt. owned Company of Bangladesh Chemical Industries Corporation under Ministry of Industries.
TECHNICAL TRAINING MANUAL GENERAL FAMILIARIZATION COURSEDuvanRamosGarzon1
AIRCRAFT GENERAL
The Single Aisle is the most advanced family aircraft in service today, with fly-by-wire flight controls.
The A318, A319, A320 and A321 are twin-engine subsonic medium range aircraft.
The family offers a choice of engines
CFD Simulation of By-pass Flow in a HRSG module by R&R Consult.pptxR&R Consult
CFD analysis is incredibly effective at solving mysteries and improving the performance of complex systems!
Here's a great example: At a large natural gas-fired power plant, where they use waste heat to generate steam and energy, they were puzzled that their boiler wasn't producing as much steam as expected.
R&R and Tetra Engineering Group Inc. were asked to solve the issue with reduced steam production.
An inspection had shown that a significant amount of hot flue gas was bypassing the boiler tubes, where the heat was supposed to be transferred.
R&R Consult conducted a CFD analysis, which revealed that 6.3% of the flue gas was bypassing the boiler tubes without transferring heat. The analysis also showed that the flue gas was instead being directed along the sides of the boiler and between the modules that were supposed to capture the heat. This was the cause of the reduced performance.
Based on our results, Tetra Engineering installed covering plates to reduce the bypass flow. This improved the boiler's performance and increased electricity production.
It is always satisfying when we can help solve complex challenges like this. Do your systems also need a check-up or optimization? Give us a call!
Work done in cooperation with James Malloy and David Moelling from Tetra Engineering.
More examples of our work https://www.r-r-consult.dk/en/cases-en/
NO1 Uk best vashikaran specialist in delhi vashikaran baba near me online vas...Amil Baba Dawood bangali
Contact with Dawood Bhai Just call on +92322-6382012 and we'll help you. We'll solve all your problems within 12 to 24 hours and with 101% guarantee and with astrology systematic. If you want to take any personal or professional advice then also you can call us on +92322-6382012 , ONLINE LOVE PROBLEM & Other all types of Daily Life Problem's.Then CALL or WHATSAPP us on +92322-6382012 and Get all these problems solutions here by Amil Baba DAWOOD BANGALI
#vashikaranspecialist #astrologer #palmistry #amliyaat #taweez #manpasandshadi #horoscope #spiritual #lovelife #lovespell #marriagespell#aamilbabainpakistan #amilbabainkarachi #powerfullblackmagicspell #kalajadumantarspecialist #realamilbaba #AmilbabainPakistan #astrologerincanada #astrologerindubai #lovespellsmaster #kalajaduspecialist #lovespellsthatwork #aamilbabainlahore#blackmagicformarriage #aamilbaba #kalajadu #kalailam #taweez #wazifaexpert #jadumantar #vashikaranspecialist #astrologer #palmistry #amliyaat #taweez #manpasandshadi #horoscope #spiritual #lovelife #lovespell #marriagespell#aamilbabainpakistan #amilbabainkarachi #powerfullblackmagicspell #kalajadumantarspecialist #realamilbaba #AmilbabainPakistan #astrologerincanada #astrologerindubai #lovespellsmaster #kalajaduspecialist #lovespellsthatwork #aamilbabainlahore #blackmagicforlove #blackmagicformarriage #aamilbaba #kalajadu #kalailam #taweez #wazifaexpert #jadumantar #vashikaranspecialist #astrologer #palmistry #amliyaat #taweez #manpasandshadi #horoscope #spiritual #lovelife #lovespell #marriagespell#aamilbabainpakistan #amilbabainkarachi #powerfullblackmagicspell #kalajadumantarspecialist #realamilbaba #AmilbabainPakistan #astrologerincanada #astrologerindubai #lovespellsmaster #kalajaduspecialist #lovespellsthatwork #aamilbabainlahore #Amilbabainuk #amilbabainspain #amilbabaindubai #Amilbabainnorway #amilbabainkrachi #amilbabainlahore #amilbabaingujranwalan #amilbabainislamabad
Cosmetic shop management system project report.pdfKamal Acharya
Buying new cosmetic products is difficult. It can even be scary for those who have sensitive skin and are prone to skin trouble. The information needed to alleviate this problem is on the back of each product, but it's thought to interpret those ingredient lists unless you have a background in chemistry.
Instead of buying and hoping for the best, we can use data science to help us predict which products may be good fits for us. It includes various function programs to do the above mentioned tasks.
Data file handling has been effectively used in the program.
The automated cosmetic shop management system should deal with the automation of general workflow and administration process of the shop. The main processes of the system focus on customer's request where the system is able to search the most appropriate products and deliver it to the customers. It should help the employees to quickly identify the list of cosmetic product that have reached the minimum quantity and also keep a track of expired date for each cosmetic product. It should help the employees to find the rack number in which the product is placed.It is also Faster and more efficient way.
Final project report on grocery store management system..pdfKamal Acharya
In today’s fast-changing business environment, it’s extremely important to be able to respond to client needs in the most effective and timely manner. If your customers wish to see your business online and have instant access to your products or services.
Online Grocery Store is an e-commerce website, which retails various grocery products. This project allows viewing various products available enables registered users to purchase desired products instantly using Paytm, UPI payment processor (Instant Pay) and also can place order by using Cash on Delivery (Pay Later) option. This project provides an easy access to Administrators and Managers to view orders placed using Pay Later and Instant Pay options.
In order to develop an e-commerce website, a number of Technologies must be studied and understood. These include multi-tiered architecture, server and client-side scripting techniques, implementation technologies, programming language (such as PHP, HTML, CSS, JavaScript) and MySQL relational databases. This is a project with the objective to develop a basic website where a consumer is provided with a shopping cart website and also to know about the technologies used to develop such a website.
This document will discuss each of the underlying technologies to create and implement an e- commerce website.
Courier management system project report.pdfKamal Acharya
It is now-a-days very important for the people to send or receive articles like imported furniture, electronic items, gifts, business goods and the like. People depend vastly on different transport systems which mostly use the manual way of receiving and delivering the articles. There is no way to track the articles till they are received and there is no way to let the customer know what happened in transit, once he booked some articles. In such a situation, we need a system which completely computerizes the cargo activities including time to time tracking of the articles sent. This need is fulfilled by Courier Management System software which is online software for the cargo management people that enables them to receive the goods from a source and send them to a required destination and track their status from time to time.
2. • There are actually three different states for visual interactions in Power BI:
• Highlight (the default experience of cross-filtering with shading)
• Filter (cross-filtering to show the contextual values only)
• None (do not filter)
3. • As mentioned above, this is the default of the visual interactions in Power BI.
• You don’t need to set up anything to get this behaviour. If you monkey with it, however, you can get back
to it by selecting a different visual, then clicking the little pie chart icon that appears above the visual
you want to modify.
4. • The only other thing is what happens when we select a set of data that filters all records out of
another visual. In the case below, selected Kelowna in the Course Attendees by City chart. As you can
see only four of our courses have been led in Kelowna:
• Notice that the last three courses still show, even though we never ran them in this city. Why? Because
the visuals indicate that led all our other courses somewhere, but obviously not in Kelowna.
5. • The next icon to the left of the pie chart is the Filter icon. This toggles the visual slightly:
• The key difference here is that the shaded portion is gone. This gives the appearance of drilling in to the data a little more,
without preserving the concept of how this data relates to the whole.
6. • Now, check out what happens when we select Kelowna:
• The Courses Run by Name visual no longer holds any data about the whole, allowing it to remove the
irrelevant courses. End result here is that we’re able to focus on the data that exists in this context only,
without contaminating it with irrelevant data.
• To be fair, most of the time I actually quite like the version with the shaded values. But if you have a long
list of data then this can certainly help trim it down so you don’t have to scroll the visuals as much.
7. • The last method we can configure for visual interactions in Power BI is to set the filter behaviour to None. This
prevents any filtering from taking place on a visual with this property set:
8. • At first this looks quite similar to the Filter setting, but the key here is that the data in the Courses Run by
Name visual has not been filtered at all, unlike the other two chart visuals and the card visual.
• To display the effects just a bit further, the image below shows the card visual set to None, and the city
filtered to Kelowna:
• Notice that this time the Attendees card shows the true total for All Attendees. The Courses Run by City
visual, however, is filtering, as this is in “Highlight” mode.
9. • Can set up different actions for each visual on the report. That adds a fair amount of flexibility in order to get
your report filtering working just the want you want.
• be keenly aware of this fact:
• All visual interactions set up as shown in the last image. (cross filter)
• Keeping that in mind, look what happens when click on the Creating Vibrant dashboards course:
• It cross filters all other visuals using the default interactions!
• This is kind of a key thing to be aware of. Just because can customize the visual interactions for the Course
Attendees by City visual, it doesn’t force those relationships back the other way.
12. • Visualizations are used to effectively present your data and are the basic building blocks of any Business
Intelligence tool.
• Power BI contains various default data visualization components that include simple bar charts to pie charts
to maps, and also complex models such as waterfalls, funnels, gauges, and many other components.
• In Power BI, you can create visualization in two ways.
• First is by adding from the right side pane to Report Canvas. By default, it is the table type visualization, which is
selected in Power BI.
• Another way is to drag the fields from right side bar to the axis and value axis under Visualization. You can add
multiple fields to each axis as per the requirement.
• In Power BI, it is also possible to move your visualization on the reporting canvas by clicking and then
dragging it. You can also switch between different type of charts and visualizations from the Visualization
pane. Power BI attempts to convert your selected fields to the new visual type as closely as possible.
13.
14. • In Power BI, we have two types of map visualization - bubble maps and shape maps.
• If you want to create a bubble map, select the map option from the visualization pane.
To use a bubble map, drag the map from
Visualizations to the Report Canvas. To
display values, you have to add any location
object to the axis.
15. • In the value fields, you can see that it accepts values axis such as City and State and or you can also add longitude
and latitude values.
• To change the bubble size, you need to add a field to the value axis.
• You can also use a filled map in data visualization, just by dragging the filled map to the Report Canvas
• Note − If you see a warning symbol on top of your map visualization, it means that you need to add more locations to
your map chart.
16. • In data visualization, it is also required to plot multiple measures in a single chart.
• Power BI supports various combination chart types to plot measure values. Let us say you want to plot
revenue and unit_solds in one chart. Combination charts are the most suitable option for these kind of
requirement.
• One of the most common Combination chart in Power BI is Line and Stacked column charts. Let us say we
have a revenue field and we have added a new data source that contains customer-wise unit quantity and we
want to plot this in our visualization.
17. • Once you add a data source, it will be added to the list of fields on the right side. You can add units to the
column axis as shown in the following screenshot.
• You have other type of combine chart that you can use in Power BI - Line and Clustered Column.
18. • In Power BI, when you add a dataset to your visualization, it adds a table chart to the Report canvas. You can
drag the fields that you want to add to the report. You can also select the checkbox in front of each field to add
those to the Report area.
• With the numerical values in a table, you can see a sum of values at the bottom.
• You can also perform a sort in the table using an arrow key at the top of the column. To perform
ascending/descending sort, just click the arrow mark, and the values in the column will be sorted.
19. • The order of the columns in a table is determined by the order in the value bucket on the right side. If you want
to change the order, you can delete any column and add the other one.
20. • You can also undo summarize or apply different aggregate function on numerical values in the table. To
change the aggregation type, click the arrow in the value bucket in front of the measure and you will see a list
of formulas that can be used.
21. • Another table type in Power BI is the matrix table that provides a lot of features such as auto sizing, column
tables, and setting colors, etc.
22. • In Power BI, you can also modify the colors in the chart. When you select any visualization, it has an option to
change the color. Following options are available under the Format tab −
• Legend
• Data Colors
• Detail Label
• Title
• Background
• Lock Aspect
• Border
• General
• To open these options, go to the Format tab as shown in the following screenshot. Once you click, you can see
all the options available.
23. • When you expand the Legend field, you have an option where you want to display the legend.
• You can select −
• Position
• Title
• Legend Name
• Color
• Text Size
• Font Family
24. • Similarly, you have data colors. In case, you want to change the color of any data field, you can use this option.
It shows all objects and their corresponding colors in the chart.
25. • You also have Analytics feature in the tool, where you can draw lines as per requirement in data visualization.
You have the following line types in data visualization −
• Constant Line
• Min Line
• Max Line
• Average Line
• Median Line
• Percentile Line
• You can opt for a dashed, dotted, or a solid line. You can select Transparency level, color, and position of the
line. You can also switch on/off data label for this line.
26. • Sometimes it is required that you need to add static text, images, or shapes to your visualization. In case you
want to add header/footer or any static signatures, messages to data visualization this option can be used.
• You can also add URLs in the text box and Power BI uses those link to make it live.
• To add shapes, images and text box, navigate to the Home tab and at the top you will find an option to add
images.
• You can insert different shapes in data visualization. To see the available shapes, click the arrow next to the
Shapes button.
27. • When you click on the text box, it adds a text box in your Report canvas. You can enter any text in the text box
and use the rich text editor to make formatting changes.
28. • Similarly, images can be added to data visualization to add logos or other images to data visualization. When
you click the Image option, it asks for a path to pass the image file.
• You can add shapes by selecting any shape from the dropdown list. You can also resize it using different
options.
29. • In Power BI, you have flexible options to adjust the page layout and formatting such as orientation and page
size of your report. Navigate to Page View menu from the Home tab and the following options are provided.
• Fit to Page
• Fit to Width
• Actual Size
30. • By default, the page size in a report is 16:9; however, it is also possible to change the page size of the report.
To change the page size, navigate to the Visualization pane and select Paint brush.
• Note − To change page size, no visualization should be added to the Report canvas. You have the following
options available under Page layout −
• Page Information
• Page Size
• Page Background
• Under Page Information, you have Name and Q&A.
• Under Page Size, you can select from the following options −
• Type
• Width
• Height
31.
32. • Under Page Background, you can select from the following options:
• Color
• Transparency
• Add Image