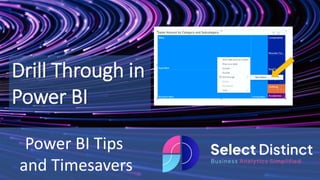
Understanding Drill Through in Power BI and How to Use Them to Dig Deeper into Your Data
Drill Through in Power BI is a powerful feature that allows users to explore their data in greater depth.
Navigate from one page to another drilling down into the details behind the numbers
#PowerBI #DrillThrough #dataviz
https://www.selectdistinct.co.uk/2023/05/25/power-bi-drill-through/
Learn the essentials of creating effective Power BI reports and discover how you can use them to tell compelling visual stories about your data.
Why is Report Design Important?
It's now easier than ever to design reports and dashboards thanks to a huge variety of BI platforms. However, many of these fail to live up to their purpose and provide true business value.
Fortunately, there are some good design guidelines that you can follow to ensure that your reports are useful and able to convey key business insights to those who use them. In particular, a well-designed report should be able to:
Simplify complex information
Convey insights as concisely as possible
Elaborate on information only as needed
Odoo Kingfisher Pro Fashion Theme, Responsive eCommerce Fashion Store ThemeBiztech Store
Odoo Kingfisher Pro Fashion imparts great benefits in the form of stellar design. Get the store speed optimized with Less CSS. It is a professional responsive theme which helps enhance the look and feel of your fashion store.
https://store.biztechconsultancy.com/odoo-kingfisher-fashion-theme.htm
This was the presentation that Ben Zelikovitz used to showcase all the new features and functionality of the SiteScout DSP during our webinar on September 10th, 2014, which include: new inventory, new data partners, campaign groups and folders, mobile rich media (MRAID), and various other improvements.
Odoo Crafito Theme, Multipurpose Odoo Template For All IndustriesBiztech Store
Crafito is a powerful and responsive theme with plenty of customization option to suite all kinds of ecommerce stores. No matter which industry you operate in, if you are building an Odoo ecommerce store, then Crafito is what you need.
https://store.biztechconsultancy.com/odoo-crafito-theme.htm
This slide is intended to highlight the cutting-edge Dynamic Reports feature found in Odoo 17 accounting module, giving a brief but insightful rundown of its versatile and sophisticated reporting features.
Este documento BARC es la versión inaugural de la nueva evaluación de proveedores y metodología de clasificación, llamado Score, que evalúa las plataformas de Inteligencia de Negocios más importantes del mercado sobre la base de un sinnúmero de puntos de datos de la encuesta de BI y muchas interacciones de los analistas. Los proveedores se clasifican en una variedad de criterios, a partir de las capacidades del producto, arquitectura, estrategia de marketing y ventas, el rendimiento financiero y comentarios de los clientes.
What are Custom Dimensions in Google Ads?
When appropriately used, custom dimensions have the power to simplify your campaign management and data analysis processes. As such, they are a vitally important asset in the PPC manager’s toolkit.
Dissimilar to labels, Google Ads custom dimensions are specifically designed to be applied to and remain consistent for the long-haul. Your secondary dimensions provide you with the opportunity to include a hierarchical structure to your campaign reporting while allowing you to drill down from department, all the way to your product line.
When you get familiar with this feature, you’ll soon see that it can improve your campaigns, saving you a lot of time, money, and frustration along the way.
Masterclass: Advanced Strategies on LinkedIn [New York]LinkedIn
You’ve launched campaigns, A/B tested, and know LinkedIn best practices….
Now it's time to take your LinkedIn campaigns to the next level. Learn how with the help of this deck from our Masterclass series!
Flash Series! Bing Shopping Campaigns: Reports You Need To Drive Optimal Perf...Hanapin Marketing
With Bing Shopping Campaigns mainstreamed to all advertisers, you should look at your reporting to help optimize for the best performance.
In this presentation, Bing’s Program Manager and Shopping Campaign expert, Richard Park, will discuss the reporting features in the UI and which reports you can pull to help better optimize your campaign(s).
http://cmsmart.net/magento-extensions/mb-banner-ads-manager-magento-extension
http://cmsmart.net/tags/magento-order-manager
http://cmsmart.net/tags/magento-social-media-extension
http://cmsmart.net/tags/joomla-responsive-templates
http://cmsmart.net/tags/joomla3-templates
http://cmsmart.net/tags/virtuemart-responsive-templates
Banner Ads Manager Magento Extension
Banner Ads Manager extension is a powerful marketing tool which allows Magento store owners to manage unlimited banners in their website easily and effectively.
#MAGENTO #EXTENSION #CMSMART
slide deck from Stepehen Stanley, presenting his wonderfully curated highlights of the recent Spring 24 Salesforce release. This was presented to the virtual meeting of the SFWelly Salesforce wellington trailblazer community group.
Magento 2 Grouped Promotions Extension by itoris Inc.Itexus LLC
More information about Magento 2 Grouped Promotions: https://www.itoris.com/magento-2-grouped-promotions.html
Other Magento 2 extensions: https://www.itoris.com/magento-2-extensions
Is your most clicked button these days the “Return to Old Interface” button in the new AdWords interface? Earlier this year, Google AdWords introduced a new UI that’s being met with both positive and negative reactions. While this uplift was long overdue, we know how hard it can be to adjust to such a big change.
In this presentation, Hanapin expert, Kass Bots will walk you through how to use the new interface like a boss and pull the essentials you need. She’ll also talk through the bugs we are seeing on the Hanapin team and how to work with them.
Year on Year comparison by weekday in power BI
A Step by Step guide to avoid potential errors when using SAMEPERIODLASTYEAR and a simple solution to ensure you compare matching weekdays
https://www.selectdistinct.co.uk/2024/04/16/year-on-year-power-bi/
#PowerBI #SAMEPERIODLASTYEAR #DataViz
Sync Your Slicers in Power BI
A Step by Step guide, to keeping separate slicers in sync across different data sets using slicer groups
https://www.selectdistinct.co.uk/2024/03/12/sync_slicers_in_power_bi/
#PowerBI #Slicers #DataViz
Make your Google Search Console Data more useful with Power BI
Here is a simple step by step guide to taking the daily GSC data, smoothing it into weekly summary data and presenting a nice clean report to show progress without all of the noise that the daily data shows
https://www.selectdistinct.co.uk/2024/03/01/using-google-search-console-data-in-power-bi/
#SEO #DataAnalytics #PowerBI #GSC
Data Lake v Data Warehouse
Do you know the difference?
Data lakes and data warehouses are both storage systems for big data, but they have several key differences.
A data lake is designed to store raw data of all types, including structured, semi-structured, and unstructured data. It’s a great option for companies that benefit from raw data for machine learning.
A data warehouse is designed to be a repository for already structured data to be queried and analysed for very specific purposes. It’s a better fit for companies whose business analysts need to decipher analytics in a structured system.
Understanding these key differences is important for any aspiring data professional
https://www.selectdistinct.co.uk/2024/01/02/difference-between-a-data-lake-and-a-data-warehouse/
#datawarehouse #datalake #dataanalytics
How to create a drop down list in Excel
Use this feature to help get your data input right at source, with built in data validation and in cell drop down
Limit the amount of spelling variations, inconsistencies and errors in Excel
https://www.selectdistinct.co.uk/2024/01/02/dropdown-lists-in-excel/
#Excel #dropdown #datavalidation
Top 5 SQL tips 2023
Presenting our most popular SQL tips for 2023
1. How to calculate running totals in SQL server
2. How to use the LEAD and LAG functions in SQL
3. Group by ROLLUP in SQL
4. Divide by Zero Errors
5. How to split a column in SQL Server
https://www.selectdistinct.co.uk/2023/12/19/top-sql-tips-for-2023/
#SQL #businessanalytics #data #analytics #sqltips
Top 5 Power Bi tips 2023
Presenting our most popular Power BI tips for 2023
1. Show values in Rows
2. Use SAMEPERIODLASTYEAR
3. How to sort dates properly
4. Toggle Measures with SWITCH
5. Advanced TOPN filter
https://www.selectdistinct.co.uk/2023/12/18/top-power-bi-tips-for-2023/
#PowerBI #dataviz #businessanalytics #data #analytics
Music by www.bensound.com
What are CTE's in SQL
WITH Statements?
What the benefits, limitations and Syntax are
https://www.selectdistinct.co.uk/2023/12/05/how-to-use-a-cte/
#SQL #CTE #SQLWITH #DATA
Do you know the difference between calculated columns and measures in Power BI?
In this article, you’ll learn what calculated columns and measures are, how they work, and when to use them.
You’ll also get some tips and best practices for choosing between them.
https://www.selectdistinct.co.uk/2023/11/21/calculated-columns-and-measures-in-power-bi/
#powerBI #measures #calculatedcolumns
Divide by zero errors and how to avoid them
Examples and code samples for SQL, Big Query, Excel, Power BI including DAX and Power Query
https://www.selectdistinct.co.uk/2023/11/01/divide-by-zero-errors/
#dividebyzero #SQL #PowerBI
music by www.bensound.com
How to choose between DAX, Power Query or SQL
to transform data for your Power BI reporting
https://www.selectdistinct.co.uk/2023/10/25/when-to-transform-data/
#powerbi #DAX #PowerQuery
KPIs in Power BI are a great way to focus attention on what matters
This step by step guide shows you how to set them up with tips on their best use
https://www.selectdistinct.co.uk/2023/10/18/power-bi-kpis/
#powerbi #KPIs #dataviz
Need to show the direction of travel on a map in Power BI
We had a client which needed us to do this very thing
This short guide shows how to do it using the Icon Map
https://www.selectdistinct.co.uk/2023/10/11/direction-of-travel-on-a-map-in-power-bi/
#PowerBI #IconMap #businessintelligence
How to combine data tables in DAX in Power BI using the UNION command
This guide shows you how to create a seamless data set from 2 or more tables to make further analysis and reporting much easier
https://www.selectdistinct.co.uk/2023/10/04/union-in-dax/
#PowerBI #DAX #UNION
Combine data sets with APPEND in Power Query
You can use this simple technique to consolidate data from different sources into a single data set to make analysis easier
This is useful if you can't combine the data at source or if you dont have the facility
https://www.selectdistinct.co.uk/2023/09/27/append-data-in-power-query/
#PowerQuery #Append #PowerBI
Connect Power BI to Google BigQuery
Use the public datasets to develop your skills and demonstrate the power of both platforms for FREE
In this example we use the actual wholesale sales data for the US state of Iowa that is one of the public datasets
https://www.selectdistinct.co.uk/2023/09/07/connect-power-bi-to-google-big-query/
This is a great starting point for anyone wanting to build their skills with data that can be refreshed
#PowerBI #BigQuery #PublicData
Easily add subtotals into your queries with the Group by ROLLUP clause in SQL server
We explain the syntax, the logic, and the benefits of using ROLLUP to create subtotals and grand totals in your queries. With examples you can follow
https://www.selectdistinct.co.uk/2023/08/23/group-by-rollup-in-sql-server
#ROLLUP #SQL #DATAANALYTICS
Advanced Top N in Power BI
Here we set up a slicer to define how many Top items we want to see, but importantly classify the rest as 'Others'
This allows us to see the whole picture and focus on the leading items
https://www.selectdistinct.co.uk/2023/07/27/advanced-top-n-filter-power-bi/
#PowerBI #TOPN #DataVisualisation
Power BI comes ready loaded with a wide range of format options
But did you know that you are not limited to the pre-defined options
Some organisations have specific standards for things such as date formats, these can be catered for using custom formats
https://www.selectdistinct.co.uk/2023/07/20/custom-formats-in-power-bi/
#powerbi #dataviz #customformats
You have heard of the 80:20 rule (Pareto)
Power BI has a TOPN function in DAX
This guide shows you how to start using it
https://www.selectdistinct.co.uk/2023/06/28/topn-in-power-bi/
#powerbi #topn #businessintelligence
In the world of data analysis, having the ability to efficiently rank and prioritize information is crucial. This is where the TOPN function in Power BI comes into play. By utilizing this powerful ranking function, analysts and data professionals can gain valuable insights from their datasets.
The TOPN function, short for "top n," allows users to identify and retrieve the top or bottom records based on a specified criteria. This function is particularly useful when dealing with large datasets that require quick and accurate analysis.
With Power BI's extensive capabilities, the TOPN function can be utilized through its native DAX (Data Analysis Expressions) formula language. By incorporating this formula into your Power BI reports and dashboards, you can effectively sort and filter data to highlight key trends, outliers, or patterns.
The importance of the TOPN function lies in its ability to streamline decision-making processes by presenting relevant information in a concise manner. Whether you are analysing sales figures, customer satisfaction ratings, or any other dataset, being able to quickly identify the top performers or underperformers can greatly impact strategic decision-making.
In this section, we will delve deeper into understanding how the TOPN function works within Power BI and explore real-world use cases where it can be applied effectively. So let's dive in and unlock the full potential of this essential feature in Power BI!
Techniques to optimize the pagerank algorithm usually fall in two categories. One is to try reducing the work per iteration, and the other is to try reducing the number of iterations. These goals are often at odds with one another. Skipping computation on vertices which have already converged has the potential to save iteration time. Skipping in-identical vertices, with the same in-links, helps reduce duplicate computations and thus could help reduce iteration time. Road networks often have chains which can be short-circuited before pagerank computation to improve performance. Final ranks of chain nodes can be easily calculated. This could reduce both the iteration time, and the number of iterations. If a graph has no dangling nodes, pagerank of each strongly connected component can be computed in topological order. This could help reduce the iteration time, no. of iterations, and also enable multi-iteration concurrency in pagerank computation. The combination of all of the above methods is the STICD algorithm. [sticd] For dynamic graphs, unchanged components whose ranks are unaffected can be skipped altogether.
StarCompliance is a leading firm specializing in the recovery of stolen cryptocurrency. Our comprehensive services are designed to assist individuals and organizations in navigating the complex process of fraud reporting, investigation, and fund recovery. We combine cutting-edge technology with expert legal support to provide a robust solution for victims of crypto theft.
Our Services Include:
Reporting to Tracking Authorities:
We immediately notify all relevant centralized exchanges (CEX), decentralized exchanges (DEX), and wallet providers about the stolen cryptocurrency. This ensures that the stolen assets are flagged as scam transactions, making it impossible for the thief to use them.
Assistance with Filing Police Reports:
We guide you through the process of filing a valid police report. Our support team provides detailed instructions on which police department to contact and helps you complete the necessary paperwork within the critical 72-hour window.
Launching the Refund Process:
Our team of experienced lawyers can initiate lawsuits on your behalf and represent you in various jurisdictions around the world. They work diligently to recover your stolen funds and ensure that justice is served.
At StarCompliance, we understand the urgency and stress involved in dealing with cryptocurrency theft. Our dedicated team works quickly and efficiently to provide you with the support and expertise needed to recover your assets. Trust us to be your partner in navigating the complexities of the crypto world and safeguarding your investments.
As Europe's leading economic powerhouse and the fourth-largest hashtag#economy globally, Germany stands at the forefront of innovation and industrial might. Renowned for its precision engineering and high-tech sectors, Germany's economic structure is heavily supported by a robust service industry, accounting for approximately 68% of its GDP. This economic clout and strategic geopolitical stance position Germany as a focal point in the global cyber threat landscape.
In the face of escalating global tensions, particularly those emanating from geopolitical disputes with nations like hashtag#Russia and hashtag#China, hashtag#Germany has witnessed a significant uptick in targeted cyber operations. Our analysis indicates a marked increase in hashtag#cyberattack sophistication aimed at critical infrastructure and key industrial sectors. These attacks range from ransomware campaigns to hashtag#AdvancedPersistentThreats (hashtag#APTs), threatening national security and business integrity.
🔑 Key findings include:
🔍 Increased frequency and complexity of cyber threats.
🔍 Escalation of state-sponsored and criminally motivated cyber operations.
🔍 Active dark web exchanges of malicious tools and tactics.
Our comprehensive report delves into these challenges, using a blend of open-source and proprietary data collection techniques. By monitoring activity on critical networks and analyzing attack patterns, our team provides a detailed overview of the threats facing German entities.
This report aims to equip stakeholders across public and private sectors with the knowledge to enhance their defensive strategies, reduce exposure to cyber risks, and reinforce Germany's resilience against cyber threats.
Opendatabay - Open Data Marketplace.pptxOpendatabay
Opendatabay.com unlocks the power of data for everyone. Open Data Marketplace fosters a collaborative hub for data enthusiasts to explore, share, and contribute to a vast collection of datasets.
First ever open hub for data enthusiasts to collaborate and innovate. A platform to explore, share, and contribute to a vast collection of datasets. Through robust quality control and innovative technologies like blockchain verification, opendatabay ensures the authenticity and reliability of datasets, empowering users to make data-driven decisions with confidence. Leverage cutting-edge AI technologies to enhance the data exploration, analysis, and discovery experience.
From intelligent search and recommendations to automated data productisation and quotation, Opendatabay AI-driven features streamline the data workflow. Finding the data you need shouldn't be a complex. Opendatabay simplifies the data acquisition process with an intuitive interface and robust search tools. Effortlessly explore, discover, and access the data you need, allowing you to focus on extracting valuable insights. Opendatabay breaks new ground with a dedicated, AI-generated, synthetic datasets.
Leverage these privacy-preserving datasets for training and testing AI models without compromising sensitive information. Opendatabay prioritizes transparency by providing detailed metadata, provenance information, and usage guidelines for each dataset, ensuring users have a comprehensive understanding of the data they're working with. By leveraging a powerful combination of distributed ledger technology and rigorous third-party audits Opendatabay ensures the authenticity and reliability of every dataset. Security is at the core of Opendatabay. Marketplace implements stringent security measures, including encryption, access controls, and regular vulnerability assessments, to safeguard your data and protect your privacy.
2. Drill Through in Power BI is a powerful feature that allows users to
explore their data in greater depth
Drill Through also allows users to navigate from one page to another,
through to a page which explains the detail behind the numbers
And its easy to get started
3. Why set up a drill through?
Drill through is a powerful way to let
your report users explore deeper
into the data behind a visual
Built in drill through features in
Power BI allow you to set up a right
click driven drill through to a more
detailed report
In this example we will set up a drill
through from a high-level summary,
through to a best seller’s report
showing the top 20 items in that
category, subcategory or country
4. First step….Set up a drill through target page
As this is a retail example, we will set up
a best sellers page to help us see the
most significant products
Here we have set up a top 20 table of
Models by Sales Amount
Typically the sales are driven by a few
strong items at the top of the list with a
long ‘tail’ of smaller items which make
up the balance
5. Step 2. Set the drill through filters
On this new page,
We need to select the visual we want to
drill through to
We want to keep all applied filters, in
the Drillthrough section of
the Visualizations pane, set Keep
all filters to On.
New set the filter fields you want to
pass from the other report pages to
filter down your best sellers
Here we will select Category,
Sub Category and Country
6. Drill through from relevant visuals
Now we can go back to any of our other
pages and we can see a drill through
option showing where the relevant
Category, Sub Category or Country fields
are used in the visual