More Related Content
Similar to Intelligent design tableau 3 (20)
Intelligent design tableau 3
- 1. perceptual
edge
Intelligent Design: Introducing Tableau 3.0
Stephen Few, Perceptual Edge
Visual Business Intelligence Newsletter
April 2007
The evolutionary processes that produced the complex organisms that we are, brimming
with intelligence but also our fair share of foibles, are far too slow for the development of
software. We can’t wait around a few million years for a good visual analysis tool to rise from
the primordial soup. All software is produced by human designers, but it is rarely the product
of intelligent design. Each iteration of Tableau, however, has been a delightful exception, the
product of thoughtful choices, including the newest version: Tableau 3.0. With this release,
the team at Tableau has continued to expand and deepen the analytical prowess of the soft-
ware, but have also recognized how important it is to help people clearly present the results
of their analyses to others with little additional effort.
Analytical Features
Features that enrich Tableau’s analytical functionality include:
• Sorting shortcuts
• Ad-hoc grouping
• Auto-calculated reference lines
• Faceted analytical displays with global filters
Sorting Shortcuts
Never underestimate the importance of sorting to the analytical process. Few simple opera-
tions are as capable paving the way to important insights. Tableau has always supported a
rich set of sorting options, but now they’ve made those that are most common extremely fast
and easy. Good visual analysis software provides ways to perform common operations on
the data without having to take your eyes off of it, so your train of thought is not interrupted.
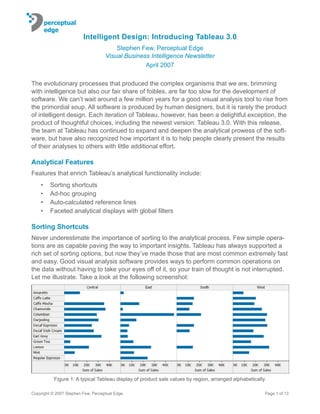
Let me illustrate. Take a look at the following screenshot:
Figure 1: A typical Tableau display of product sale values by region, arranged alphabetically.
Copyright © 2007 Stephen Few, Perceptual Edge Page 1 of 13
- 2. With products (the rows) arranged alphabetically, the values are hard to compare and we
aren’t able to see any meaningful patterns. Meaningful relationships can be made more vis-
ible by simply sorting the values. Let’s begin by sorting products in descending order based
on sales.
Figure 2: Products have now been sorted in descending order, based on sales amounts.
Not only is the ranking relationship among products and regions now clear, but because bars
that are close in size are now near one another, they are easier to compare. What you didn’t
see happen is that this rearrangement of the display was performed by a single click of the
mouse on the icon that appears below on the right, which is part of the toolbar:
Because I hadn’t selected any particular column or row in the display before clicking the de-
scending sort icon, the software assumed that I wanted to sorted columns and rows based
on all of the values that are displayed. If, however, I wanted to sort the products based on
the values in the Central region, I can select it simply by clicking on the Central column
heading, and then I can click the descending sort icon, which results in the following:
Figure 3: Products have now been sorted based on sales values in the Central region.
Copyright © 2007 Stephen Few, Perceptual Edge Page 2 of 13
- 3. The Central region doesn’t need to be the leftmost column to sort by it; it could be anywhere,
as illustrated below:
Figure 4: Values can be sorted based on any column, regardless of its position.
It might seem odd that I’m going on and on with about something as simple as sorting, but
the ability to sort the data in various ways with minimum effort is the kind of feature that gets
a data analyst’s pulse racing, because it saves so much time.
In the past, I featured a guest article by Ramana Rao about a visualization called a table
lens. This type of display allows you to place several quantitative variables, all related to
a common categorical variable, side by side, using bars to encode the data in a way that
makes simple multivariate comparisons and correlations easy to see. You can create a simi-
lar display using Tableau, and now you can bring it alive with the new quick and convenient
sorting controls. Here’s an example:
Figure 5: Each column of bars displays a different quantitative variable related to states (the rows) in a manner
that appears and functions a bit like a table lens visualization.
In this display we are comparing five quantitative variables (sales revenue, marketing ex-
penses, sales margin, value of inventory, and profit amount) by several states. The purpose
is not to compare the magnitudes of the values across the variables, which is not possible
because their quantitative scales are not the same, but rather to compare the magnitudes of
the bars within a single column and to compare the patterns formed by the bars in different
columns. Because I’ve sorted the states by sales revenue (the leftmost column), it is easy to
Copyright © 2007 Stephen Few, Perceptual Edge Page 3 of 13
- 4. see to what degree sales is correlated by state to the other variables. As you can see, based
on the fact that the shape of the bars in each column roughly proceeds from large to small,
that there is a correlation between sales and every one of these variable, but it is erratic in
some cases, such as the correlation between sales on the left and profits on the right.
If we quickly sort the display based on the values of margin (see below), we can see that
there is a stronger correlation between margin and profit, based on the fact that the patterns
formed by the bars in each of these columns is closer than those formed by sales and profit,
which we examined a moment ago.
Figure 6: Now we are focusing on the correlation between margin (the center column) and the other variables.
If several steps were required each time you wanted to sort the data differently, this type of
display would be less useful, but the sorting shortcuts of Tableau 3.0 have brought it alive.
Ad-hoc Grouping
Another thing that analysts frequently do, which is not as common as sorting but quite use-
ful from time to time, is to group categorical items together. For example, if you are analyz-
ing the sales of several coffees and teas, and you want to see how all of the dessert coffees
perform as a group rather than individually to the other products, it would be useful to throw
them together quickly for this purpose. If you must submit a request to the IT department
to group them together in the data warehouse, you probably won’t bother. Even if you must
write a calculation to group them together using your analysis software, you might not take
the time. By what if you can simply highlight them in a graph and click a single icon? In the
screenshot on the following page, you can see that I’ve selected Amaretto, Caffe Mocha,
and Decaf Irish Cream.
Copyright © 2007 Stephen Few, Perceptual Edge Page 4 of 13
- 5. Figure 7: Three rows—Amaretto, Caffe Mocha, and Decaf Irish
Cream—have been selected.
Now I can click the ad-hoc grouping icon that resides on the toolbar (it looks like a paper
clip) and the display changes to show the following:
Figure 8: Amaretto, Caffe Mocha, and Decaf Irish Cream have
now been grouped together.
In addition to grouping these items together in the current display, a new item was also
automatically added to the list of available dimensions that can be viewed in any display. If
you wanted to give this grouping a new name, such as “Dessert Coffees,” you can select the
group and then access Edit Alias from the menu to enter a new name. Once again, the folks
at Tableau have taken a useful task that often comes in handy during the course of analysis
and made it quick and simple. In so doing, they have moved it from the realm of something
that is done too seldom to one that is done as often as it’s useful.
Auto-Calculated Reference Lines
In the last major release of Tableau, the ability to make reference lines appear in graphs was
added. It is often useful to compare data to one or more points of reference, such as a target
Copyright © 2007 Stephen Few, Perceptual Edge Page 5 of 13
- 6. or a threshold. One class of references that come in handy consists of statistical measures
of average and distribution, such means, medians, standard deviations, and percentiles.
With the release of Tableau 3.0, you can now cause one or more of these measures to ap-
pear in your graphs as reference lines without having to do the math. In the following ex-
ample, while examining the changing sum of sales margin month by month across one year,
I asked Tableau to show the monthly mean and one standard deviation above and below the
mean as reference lines. This made it easy to better see and understand the extent of varia-
tion from the norm that occurred from June through August. This is just one example of the
many ways that this feature could be used to enrich analysis.
Figure 9: Auto-calculated statistical reference lines make these variations in sales margin through time easier
to see and understand.
Faceted Analytical Displays and Global Filters
I should begin by admitting that you won’t find the term “faceted analytical display” in Tab-
leau’s marketing literature. At least not yet, but I’m working on it. They are currently describ-
ing this new feature as a “dynamic dashboard.” What it provides is the ability to combine in-
dividual data displays that you would normally create and view individually during the course
of analysis onto a single screen, so they can be viewed, compared, and interacted with
simultaneously. I reserve the term “dashboard” for single screen displays that are used to
monitor what’s going on. Displays that are used for monitoring information at a glance must
be designed differently from those that are used for analysis. Regardless of whether you call
it a dynamic dashboard or a faceted analytical display, the ability to combine several views of
information on a single screen so you can few it from several perspectives simultaneously is
very powerful.
One of the great benefits of Tableau from the beginning has been its visual crosstab display,
which allows you to visually display and compare information across multiple dimensions si-
multaneously as a matrix of small graphs. The ability to now combine these with other views
on a single screen, consisting either of visual crosstabs or individual graphs (or tables), is a
Copyright © 2007 Stephen Few, Perceptual Edge Page 6 of 13
- 7. logical and powerful extension of Tableau. Here’s one that you can find in Tableau’s market-
ing literature:
Figure 10: This multi-view display combines a geospatial view with two time-series line graphs and a table.
In addition to the three data views, notice that a legend for the two graphs appears on the
right along with a filter control for selecting specific geographical regions. This filter, which
could be set up to control a single view, has been designated as a global filter that affects
the data in all the views, which is usually what you want in a faceted analytical display. The
ability to filter the data in all views using a single control is a new feature that simply involves
taking a filter control that you’ve already made visible for a single worksheet and promoting it
from local to global mode.
These multi-view displays are constructed by creating individual views on separate work-
sheets and then simply dragging them onto the multi-view display, where you can place and
size them as needed. I’ll use an example that I created to review this new feature in greater
Copyright © 2007 Stephen Few, Perceptual Edge Page 7 of 13
- 8. detail. Here’s one that was built using the same coffee and tea sales database that I’ve used
in the other examples:
Figure 11: A multi-view display with five separate but related views of the data and several global filter controls.
Going clockwise, starting in the upper left corner, this display combines the following five
views:
1. Monthly sales revenues for an entire year displayed as line graphs, divided into re-
gions (columns) and product types (rows)
2. Budget versus actual sales for the current quarter, displayed as a dot plot
3. Table of four key measures by product types and products, to provide precise values
4. Correlation of marketing expenses to sales revenues by product type, displayed as a
scatterplot
5. Sales revenues by state, displayed as a bar graph
On the right, I’ve included two legends and four global filters.
While creating this example, I took some care when arranging items on the screen. If you
are doing ad-hoc analysis, you wouldn’t bother to do this. You would be throwing views on
the screen and manipulating the data with little regard for aesthetics. If, however, you were
building a display that you or others might use over and over again to perform a particular
type of analysis, it would be worthwhile to lay it out with more care. It takes a little patience
to do this. The screen space gets divided into a grid arrangement as you place items on it,
which you must push and prod a bit to place and size things as desired. Sizing items can
be particularly time consuming, requiring you to go back and forth on occasion between the
multi-view display and the separate worksheets that contain the individual views to make
adjustments.
Copyright © 2007 Stephen Few, Perceptual Edge Page 8 of 13
- 9. The one aspect of these multi-view displays working in conjunction with global filters that
impressed me the least is the way that filtering gets applied to the display. Ideally, dynamic
filters work most effectively when you can see the data change as you manipulate the fil-
ter control. What’s happening now, while satisfactory, is not ideal. If you check or uncheck
an item in a checkbox filter control, immediately following the action the data in the display
updates, but one view at a time. You can watch each view shift briefly into update mode
(evidenced by the title changing to “Loading”). This happens quickly, but ideally every view
should adjust smoothly and simultaneously. If you adjust a slider filter control, the effect is
slightly less desirable, for nothing happens as you move the slider back and forth—it waits
until you release the mouse button and then the updates are applied to the views one at
a time. I find that it is more enlightening if you can see the values change across all of the
views as you’re moving the slider.
Presentation Features
Not long ago, I attended a working meeting of the National Visual Analytics Centers, a gov-
ernment program that is dedicated to the exploration and development of visual analysis
technologies to support the work of several governmental agencies. The purpose of this
particular meeting was to identify and plan the work that was necessary to make it easier for
analysts to present their findings to others in a clear, understandable, and accurate way. Ide-
ally, the software tools that analysts use to explore and make sense of data should include
or be seamlessly paired with the means to whip the results into presentable form. If you look
at most products that are designed for visual analysis, they rarely provide the functionality
that is needed to create effective presentations. If you look at products that are designed to
produce good presentations, they can rarely be used effectively for data analysis, and tend
to emphasize glitzy graphical features that obscure the data more than they communicate it.
Tableau 3.0 has taken a good first step to bridge this gap.
The new presentation features of Tableau 3.0 include:
• Annotations
• Enhanced formatting
Annotations
If you’ve spent much time preparing reports and presentations that feature quantitative in-
formation, you know how useful it is to include comments in or around the display to explain
what’s going on or to draw attention to particular items. These comments are called annota-
tions. If you use Excel to prepare presentations, you have probably used the text object and
arrows to add comments to the display. This works fine for a one-time presentation, but often
falls apart when the data changes, causing your comments to be no longer located where
they belong or no longer pointing to the data they are describing. What you need in a case
like this is the means to tie annotations to specific regions, locations, or values in a display.
The annotations that are now available in Tableau do just that.
Copyright © 2007 Stephen Few, Perceptual Edge Page 9 of 13
- 10. In the following example, I have annotated a scatterplot to highlight three specific data
points, which represent interesting exceptions.
Figure 12: This scatterplot includes annotations that are tied to
specific values.
Now notice what happens when I filter out the high value sales. Columbian Coffee in Massa-
chusetts has disappeared, and the two remaining annotated values have changed positions
due to adjustments in the quantitative scales along both the X and Y axes. If I undo the filter,
everything goes back to the way it looked in the beginning.
Figure 13: Annotations can be tied to data values such that they
shift position along with the values.
Copyright © 2007 Stephen Few, Perceptual Edge Page 10 of 13
- 11. Annotations can have various appearances and can also be tied to regions and specific
locations in the display rather than a particular data value. You can probably imagine how
much more useful these data and graph aware annotations can be than the static text boxes
of Excel and most data presentation tools.
Enhanced Formatting
You can now transform the results of your analyses into presentations that have been flexi-
bly formatted to appear in the polished and customized ways that you are likely to need. Just
about every component of a display can now be formatted. As an example, here’s a display
that I polished a bit through formatting and annotations to serve as a nice printed report.
Figure 14: Displays can now be cleaned and polished with extensive formatting controls.
This functionality is definitely heading in the right direction, but the formatting interface isn’t
as intuitive and easy to use as the rest of Tableau. I spent far longer than I wanted to make
all of the formatting adjustments that I wanted for the example above. (Note: I intentionally
broke my own rule about never orienting text vertically when I labeled the months along the
X-axis, because Tableau does not currently provide an easy way to express dates in ab-
breviated form (for example, three character abbreviations such as “Jan”) without manually
constructing calculations to do the conversions.)
Formatting controls appear in a panel on the left that covers up the data panel. The controls
that appear at any one time are limited to the part of the display that you point to before
Copyright © 2007 Stephen Few, Perceptual Edge Page 11 of 13
- 12. beginning formatting operations. For instance, here’s what the top half of the formatting
looked like after I pointed to the Y-axis of a scatterplot:
Figure 15: Example of the for-
matting panel where formatting
controls reside.
Figuring out where to point to get the controls that you need to appear and then which tab,
which icon, and which control to select to make the desired formatting adjustments takes
some getting used to.
I’m thrilled that Tableau has introduced this new level of formatting control, but hope that the
interface becomes easier to use in future releases. I might be naïve in my notions of how the
interface could be improved, having not faced the challenge myself, but it seems that two
changes would help:
• Rather than covering up the data panel with the formatting panel, expose the format-
ting panel as a floating window that can be set by the analyst either to appear only
when it’s needed and then disappear or to remain available until it’s intentionally
closed. You could position it over the data panel if you wanted, or place it elsewhere
so you could still grab items from the data panel and format items in the display with-
out conflict.
• Fine tune the list of formatting controls to a smaller set, which appear in a single small
window without tabs or icons, based on a tighter association between the part of the
display that you point to before opening the formatting window and the controls that
are then exposed.
Copyright © 2007 Stephen Few, Perceptual Edge Page 12 of 13
- 13. Hoped for Future Directions
I don’t know what the folks at Tableau are planning for their next major release, but there are
four items that I think deserve top billing:
• A simpler and less disruptive formatting interface
• Smoother and more immediate global filtering
• Brushing functionality in the multi-view displays
• Box plots
I’ve already mentioned the first two items in this list, so I’ll skip right to the last two.
Brushing is the name for the technique that was developed by information visualization
researchers that allows you to select a subset of data in one view (such as a section of
data points in a scatterplot), which causes those items to be highlighted not only in the view
where the selection was made, but also in every other view of the same dataset that resides
on the screen. For instance, with brushing, using the faceted analytical display that appears
in Figure 10, I could use my mouse to draw a rectangle around a set of data points in the
scatterplot to highlight them, and those same values would be highlighted wherever they ap-
pear in each of the other graphs and in the table. If two of the brushed data points represent
10% of the sales in the state of California, then only 10% of the bar that represents Califor-
nia would be highlighted in the graph that displays sales by state. Brushing is the next logical
feature to add to these multi-view displays to bring to light the connections in the data that
might otherwise remain hidden.
And finally, I’ve been waiting for box plots to be added to Tableau since the beginning. No
other form of graph provides a better means to compare the distributions of multiple datas-
ets, such as the distributions of salaries paid to employees across several departments. If
there isn’t a mob of customers storming the gates and demanding box plots, it is only be-
cause they haven’t been exposed to the benefits of distribution analysis.
As always, despite the relatively minor adjustments that I would like to see in the product,
Tableau 3.0 continues the precedent that this exceptional company has set for software that
does what it should and does it well.
About the Author
Stephen Few has worked for over 20 years as an IT innovator, consultant, and teacher.
Today, as Principal of the consultancy Perceptual Edge, Stephen focuses on data visualiza-
tion for analyzing and communicating quantitative business information. He provides training
and consulting services, writes the monthly Visual Business Intelligence Newsletter, speaks
frequently at conferences, and teaches in the MBA program at the University of California,
Berkeley. He is the author of two books: Show Me the Numbers: Designing Tables and
Graphs to Enlighten and Information Dashboard Design: The Effective Visual Communica-
tion of Data. You can learn more about Stephen’s work and access an entire library of arti-
cles at www.perceptualedge.com. Between articles, you can read Stephen’s thoughts on the
industry in his blog.
Copyright © 2007 Stephen Few, Perceptual Edge Page 13 of 13