
![Mr. S. P. Shinde
66
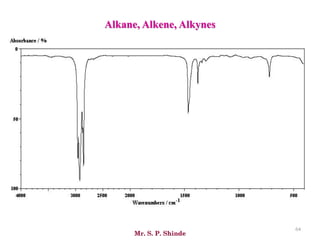
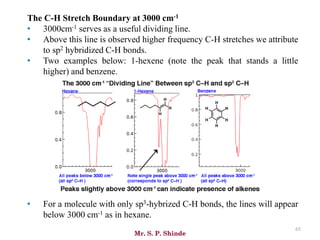
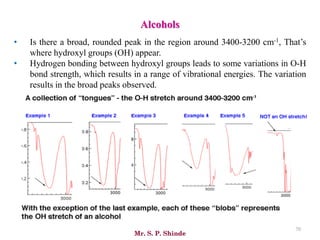
• The line at 3000 cm-1 is a useful “border” between alkene C–H (above 3000
cm-1) and alkane C–H (below 3000 cm-1 ) This can quickly help you
determine if double bonds are present.
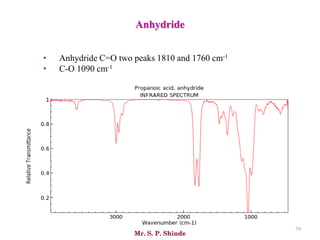
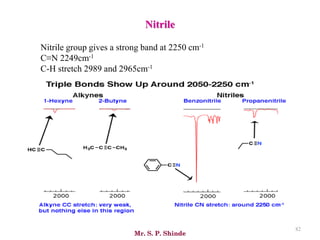
• A peak in the region around 2200 cm-1 – 2050 cm-1 is a subtle indicator of
the presence of a triple bond [C≡N or C≡C].](https://image.slidesharecdn.com/ir-230418135208-f5c16037/85/Infrared-spectroscopy-66-320.jpg)


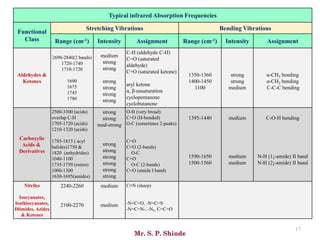
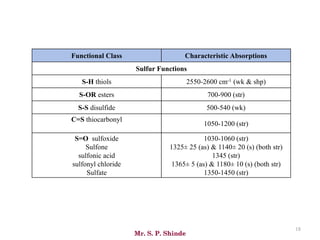
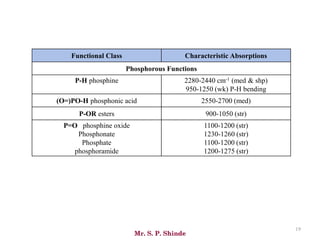
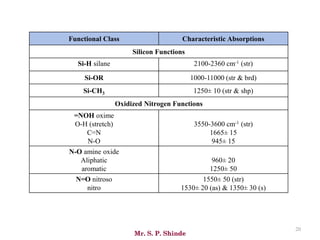
Mr. Sanket P. Shinde provides an overview of infrared (IR) spectroscopy, detailing its importance in identifying functional groups in various compounds through their vibrational characteristics. The document explains the different regions of the infrared spectrum, the relationship between dipole moments and IR activity, and the significance of vibrational modes, emphasizing the use of Hook's law in understanding absorption frequencies. Detailed tables present typical infrared absorption frequencies for various functional groups, illustrating the diversity in vibrational behavior and energy levels.


![Getting Started with Apache Spark: Big Data Made Simple [Free Meetup]](https://cdn.slidesharecdn.com/ss_thumbnails/apachesparkgettingstarted-260203175547-8361bcc3-thumbnail.jpg?width=640&height=640&fit=bounds)


