Transcriptomics of RKN resitance in Upland Cotton
•
0 likes•82 views

Presented at Institute of Plant Breeding, Genetics and Genomics (IPBGG) retreat in May 2019.

Recommended
More Related Content
What's hot
What's hot (20)
Similar to Transcriptomics of RKN resitance in Upland Cotton
Similar to Transcriptomics of RKN resitance in Upland Cotton (20)
More from Sameer Khanal
More from Sameer Khanal (20)
Recently uploaded
Recently uploaded (20)
Transcriptomics of RKN resitance in Upland Cotton
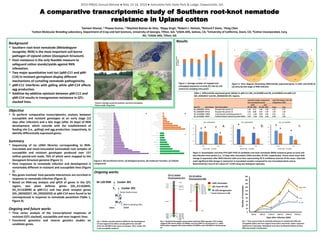
- 1. Background ▪ Southern root-knot nematode (Meloidogyne incognita; RKN) is the most important soil-borne pathogen of Upland cotton (Gossypium hirsutum). ▪ Host resistance is the only feasible measure to safeguard cotton stands/yields against RKN infestation. ▪ Two major quantitative trait loci (qMi-C11 and qMi- C14) in resistant germplasm display different mechanisms of curtailing nematode pathogenicity. ▪ qMi-C11 interferes with galling while qMi-C14 affects egg production. ▪ Additive-by-additive epistasis between qMi-C11 and qMi-C14 results in transgressive resistance in QTL- stacked lines. Objective ▪ To perform comparative transcriptomics analysis between susceptible and resistant genotypes at an early stage (12 days after infection) and a late stage (after 25 days) of RKN development, which coincide with the establishment of feeding site (i.e., galling) and egg production, respectively, to identify differentially expressed genes. Summary ▪ Sequencing of six cDNA libraries corresponding to RKN- inoculated and mock-inoculated (untreated) root samples of susceptible and resistant genotypes produced over 157 million paired-end reads, 76% of which were mapped to the Gossypium hirsutum genome (Figure 1). ▪ Host responses to nematode infection and development is remarkably different in resistant and susceptible lines (Figure 2). ▪ Key genes involved host-parasite interactions are enriched in response to nematode infection (Figure 3). ▪ Based on RNA-seq analysis and qPCR of genes in the QTL region, two plant defense genes (Gh_A11G2835, Gh_A11G3090) at qMi-C11 and two plant receptor genes (Gh_D02G0257, Gh_D02G0259) at qMi-C14 were found to be overexpressed in response to nematode parasitism (Table 1, Figure 4). Ongoing and future works ▪ Time series analysis of the transcriptional responses of resistant (QTL-stacked), susceptible and near-isogenic lines. ▪ Functional genomics and reverse genetics studies on candidate genes. A comparative transcriptomic study of Southern root-knot nematode resistance in Upland cotton 1Sameer Khanal, 1,2Pawan Kumar, 1,3Mychele Batista da Silva, 1Rippy Singh, 4Robert L. Nichols, 5Richard F Davis, 1Peng Chee 1Cotton Molecular Breeding Laboratory, Department of Crop and Soil Sciences, University of Georgia, Tifton, GA; 2USDA-ARS, Salinas, CA; 3University of California, Davis, CA; 4Cotton Incorporated, Cary, NC; 5USDA-ARS, Tifton, GA M-120 RNR Cocker 201 CH11 BC7F2 F1 BC7F1 CH14 X Cocker 201X Fig. 5 Marker assisted selection (MAS) for the development of near isogenic lines (NILs) carrying qMi-CH11 and qMi- CH14. M-120 RNR is the source of resistant QTLs. Cocker 201 is the susceptible recipient. Seven backcrosses X MAS to develop NILs C201 chromatin QTL from M-120 M-120 introgression Fig. 6 Graphical Genotypes using Variant Call from RNA-seq data. CH11 isoline mapped 168 variant alleles (16 INDELs and 152 SNPs) in chromosome 11, while CH14 isoline mapped 128 variant alleles (10 INDELs and 118 SNPs) in chromosome 14. CH-11 isoline Chromosome A11 CH-14 isoline Chromosome D02 * marker distances in MB 0 20 40 60 80 100 120 140 160 180 200 4DAI 8DAI 12DAI 16DAI 20DAI 25DAI A B A B A AB BC C A AB B C A A B B Coker 201 CH14 CH11 M-120 Fig. 7 Time-course study of nematode infections in resistant (M-120) and susceptible (C201) and near-isogenic lines (CH11 and CH14). Letters represent significance of grouping. Histological work done by Mychele Batista da Silva. RNA-seq analysis is being done. Days after infection (DAI) Numberofnematodes Ongoing works Pictures: Damage caused by Southern root-knot nematodes. Picture credit: Peng Chee Figure 1. Average number of mapped and unmapped sequences at early (E), late (L) and control (C) sampling time point. Figure 2. Venn diagram illustrating differentially expressed genes in C201 and M120 at (a) early (b) late stage of RKN infection Figure 3. GO enrichment terms. (a) biological process, (b) molecular function, (c) Cellular components Results 0 0.5 1 1.5 2 2.5 3 Early Late Gh_D02G0257 M-120 C201 0 0.5 1 1.5 2 2.5 3 Early Late Gh_D02G0259 M-120 C201 0 0.5 1 1.5 2 2.5 3 3.5 4 Early Late Gh_A11G3090 M-120 C201 Figure 4. Quantitative real-time PCR (qRT-PCR) of candidate root-knot nematode (RKN) resistance genes at early and late infection time-points [i.e., 12 days after inoculation (DAI) and after 25 DAI, respectively). Charts show mean fold- change in expression after RKN infection with error bars representing 95 % confidence interval of the mean. Asterisks mark significant fold-change in expression in inoculated samples compared to non-inoculated plants and as determined by t-test of ΔCt values (P ≤ 0.05) using two biological replicates. * * * * * * * * * a. b. c. Table 1. Differentially expressed genes (DEGs) in qMi-C11 (Gh_A11G3090 and Gh_A11G2835) and qMi-C14 (Gh_D02G0257 and Gh_D02G0259) QTL regions. Gene ID Gene Name Gene Description M-120 C201 M-120 C201 Early Late Gh_D02G0257 RLP12 Receptor-like protein 12 1.36 0.11 1.85 -1.92 1.25 3.77 Gh_D02G0259 RLP12 Receptor-like protein 12 1.42 0.00 0.55 -1.07 1.42 1.62 Gh_A11G3090 PUB21 U-box domain-containing protein 21 1.17 -1.04 0.18 -1.62 2.21 1.8 Gh_A11G2835 RGA3 Putative disease resistance protein RGA3 4.33 -2.26 -0.25 -2.26 6.58 2.01 Log2 fold change compared to non-inoculated controls Early Late Log2 fold change in M-120 compared to C201 Numberofreads (inmillions) 2019 IPBGG Annual Retreat ● May 13-14, 2019 ● Amicalola Falls State Park & Lodge, Dawsonville, GA.