QNBFS Weekly Market Report February 18, 2021
•
0 likes•105 views

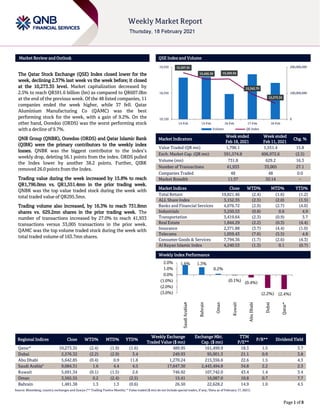
The Qatar Stock Exchange (QSE) Index closed lower for the week, declining 2.37% last week vs the week before; it closed at the 10,273.35 level.

Recommended
Recommended
More Related Content
What's hot
What's hot (12)
Similar to QNBFS Weekly Market Report February 18, 2021
Similar to QNBFS Weekly Market Report February 18, 2021 (20)
More from QNB Group
More from QNB Group (20)
Recently uploaded
Recently uploaded (20)
QNBFS Weekly Market Report February 18, 2021
- 1. ``````` Page 1 of 8 Market Review and Outlook QSE Index and Volume The Qatar Stock Exchange (QSE) Index closed lower for the week, declining 2.37% last week vs the week before; it closed at the 10,273.35 level. Market capitalization decreased by 2.5% to reach QR591.6 billion (bn) as compared to QR607.0bn at the end of the previous week. Of the 48 listed companies, 11 companies ended the week higher, while 37 fell. Qatar Aluminium Manufacturing Co (QAMC) was the best performing stock for the week, with a gain of 9.2%. On the other hand, Ooredoo (ORDS) was the worst performing stock with a decline of 9.7%. QNB Group (QNBK), Ooredoo (ORDS) and Qatar Islamic Bank (QIBK) were the primary contributors to the weekly index losses. QNBK was the biggest contributor to the index’s weekly drop, deleting 56.1 points from the index. ORDS pulled the Index lower by another 38.2 points. Further, QIBK removed 26.0 points from the Index. Trading value during the week increased by 15.8% to reach QR1,796.0mn vs. QR1,551.4mn in the prior trading week. QNBK was the top value traded stock during the week with total traded value of QR295.3mn. Trading volume also increased, by 16.3% to reach 731.8mn shares vs. 629.2mn shares in the prior trading week. The number of transactions increased by 27.0% to reach 41,933 transactions versus 33,005 transactions in the prior week. QAMC was the top volume traded stock during the week with total traded volume of 163.7mn shares. Market Indicators Week ended Feb 18, 2021 Week ended Feb 11, 2021 Chg. % Value Traded (QR mn) 1,796.1 1,551.4 15.8 Exch. Market Cap. (QR mn) 591,574.8 606,972.6 (2.5) Volume (mn) 731.8 629.2 16.3 Number of Transactions 41,933 33,005 27.1 Companies Traded 48 48 0.0 Market Breadth 11:37 32:14 – Market Indices Close WTD% MTD% YTD% Total Return 19,821.46 (2.4) (1.6) (1.2) ALL Share Index 3,152.35 (2.5) (2.0) (1.5) Banks and Financial Services 4,076.72 (2.9) (2.7) (4.0) Industrials 3,250.53 (0.8) 0.6 4.9 Transportation 3,419.64 (2.3) (0.9) 3.7 Real Estate 1,844.29 (2.2) (0.3) (4.4) Insurance 2,371.88 (3.7) (4.4) (1.0) Telecoms 1,059.43 (7.6) (5.5) 4.8 Consumer Goods & Services 7,794.36 (1.7) (2.6) (4.3) Al Rayan Islamic Index 4,240.53 (1.3) 0.1 (0.7) Weekly Index Performance Regional Indices Close WTD% MTD% YTD% Weekly Exchange Traded Value ($ mn) Exchange Mkt. Cap. ($ mn) TTM P/E** P/B** Dividend Yield Qatar* 10,273.35 (2.4) (1.9) (1.6) 489.95 161,499.9 18.3 1.5 3.7 Dubai 2,576.32 (2.2) (2.9) 3.4 249.93 95,001.3 21.1 0.9 3.8 Abu Dhabi 5,642.85 (0.4) 0.9 11.8 1,270.24 215,356.6 22.6 1.5 4.3 Saudi Arabia# 9,084.31 1.6 4.4 4.5 17,647.30 2,443,494.8 34.8 2.2 2.3 Kuwait 5,691.34 (0.1) (1.5) 2.6 746.92 107,742.0 43.4 1.4 3.4 Oman 3,565.55 0.2 (2.4) (2.5) 15.41 16,087.0 10.8 0.7 7.7 Bahrain 1,481.38 1.3 1.3 (0.6) 26.50 22,628.2 14.9 1.0 4.5 Source: Bloomberg, country exchanges and Zawya (** Trailing Twelve Months; * Value traded ($ mn) do not include special trades, if any; #Data as of February 17, 2021) 10,507.81 10,456.36 10,459.94 10,342.70 10,273.35 0 100,000,000 200,000,000 10,150 10,350 10,550 14-Feb 15-Feb 16-Feb 17-Feb 18-Feb Volume QE Index 1.6% 1.3% 0.2% (0.1%) (0.4%) (2.2%) (2.4%) (3.0%) (2.0%) (1.0%) 0.0% 1.0% 2.0% Saudi Arabia# Bahrain Oman Kuwait Abu Dhabi Dubai Qatar*
- 2. Page 2 of 8 Economic, Market & Corporate News In FY2020, QEWS recorded net profit of QR1,157.7mn as compared to QR1,413.9mn in FY2019. – EPS amounted to QR1.05 in FY2020 as compared to QR1.29 in FY2019. QEWS' net profit came in at QR123.4mn in 4Q2020. The company's revenue came in at QR635.3mn in 4Q2020, which represents an increase of 5.2% YoY. However, on QoQ basis Revenue fell 8.7%. The board recommended a dividend per share of QR0.63 to be approved at the annual shareholders’ general assembly on March 8. Total dividend payment will be QR693mn, which is 60% of the company’s net profit. QEWS reported revenue of QR2.58bn in 2020 over QR2.38bn during the same period in 2019. Operating profits amounted to QR782mn last year compared to QR879mn during the same period in 2019. Cash flows from operations remain strong when compared to the same period in the previous year. QEWS recorded operational cash flows of QR1.16bn compared to operational cash flows of QR1.13bn during the same period in the previous year. QEWS owns and operates seven power and/or water stations in Qatar and has partnered with international companies to own and operate another five power and/or water companies. Despite the effects of the COVID-19 pandemic globally, QEWS’ operations remained stable in 2020. QEWS has secured long- term Power and Water Purchase Agreements (PWPAs) with Kahramaa, in addition to long-term fuel supply agreements with Qatar Petroleum (QP), limiting its exposure to the pandemic. As a result, QEWS was able to maintain a strong credit rating of ‘A1’ with stable outlook from Moody’s during 2020. QEWS projects remain relatively unaffected and are making progress. During 2020, Umm Al Houl Power Company Expansion Project, which is 60% owned by QEWS, 30% by K1 Energy, and 5% by each of QP and Qatar Foundation, made substantial progress and is nearing the completion of the first phase of the project. Phase 1 of the project is expected to deliver a capacity of 30 MIGD by end of February 2021, with its second phase to deliver 31.45 MIGD by April 2021. The Siraj-1 Solar Power Plant Project, QEWS’ latest project, reached its financial closure in July 2020 and will become the first-of-its- kind to produce electricity using photovoltaic technology in Qatar. Located in Al Kharsaah area, the plant will be able to produce 800 MW at full capacity and is expected to account for one tenth of the current peak electricity demand in Qatar. The project will be executed via a Special Purpose Vehicle (SPV), 60% owned by Siraj Energy (a joint venture owned 49% by QEWS and 51% by QP) and 40% owned by a joint consortium of Marubeni Corp (Japan) and Total Solar International (France). The project will be completed under the Build, Own, Operate, Transfer model after which the plant will be transferred to Kahramaa following a concession period of 25 years. In January 2020, Kahramaa entered into a long-term agreement with the SPV to buy electricity from the plant during the 25-year concession period. Kahramaa intends to develop a new power and water plant (Facility E) by 2023- 2024. The facility is expected to have 2,600 MW power capacity and 100 MIGD water capacity and will be located in Ras Abu Fontas. QEWS is expected to own 55% share in the project. Further details of the project are expected to be finalised in the second quarter of 2021. QEWS, along with its JVs, has a total capacity of 10,590 MW of electricity and 481.5 MIGD of water. In addition, its foreign investment arm, Nebras Power, which is 60%, owned by QEWS holds more than 2,000 MW of electricity capacity through a mixture of natural gas, coal, and solar power outside Qatar, on equity-adjusted basis. (QNB FS Research, QSE, Gulf-Times.com) QAMC's bottom line rises to QR82.4mn in 4Q2020, above our estimate – Qatar Aluminium Manufacturing Company (QAMC) reported net profit of QR82.4mn in 4Q2020 as compared to net profit of QR19.5mn in 4Q2019 (323.6% YoY) and net loss of QR2.4mn in 3Q2020, above our estimate of QR49.2mn. The company's gain from ‘share of results from a joint venture’ came in at QR83.7mn in 4Q2020, which represents an increase of 357.7% YoY (4Q2019: QR18.3mn). However, loss from ‘share of results from a joint venture’ stood at QR0.5mn in 3Q2020. In FY2020, QAMC posted net profit of QR94.7mn as compared to QR80.0mn in FY2019. EPS amounted to QR0.0170 in FY2020 as compared to QR0.0143 in FY2019. The company has proposed a dividend distribution of QR195.3mn, representing a payout ratio of 206% of 2020’s net earnings, equivalent to 3.5% cash dividend or QR0.035 per share. QAMC’s share of revenue amounted to QR2.2bn in 2020. Sales volumes were marginally higher than last year, as its joint venture (JV) swiftly shifted the production to standard ingots (SI), as the demand for value added products (VAP) and alloys used by various industries declined during peak of pandemic due to lockdowns and lack of industrial activity. The channelling of production volumes swiftly from VAP to SI supported in ensuring achieving maximum sales volumes. Though, lower VAP volumes resulted in lower realised LME premiums. Given the demand for VAP showed signs of recovery, especially towards end of third quarter of 2020, QAMC’s JV successfully shifted the product mix back to VAP from SI in the subsequent quarter, resulting in higher premiums and better margins for the quarter. Profitability remained under pressure mainly on lower revenues due to a 12% decline in selling prices, and contributed QR289mn negatively to the net profits for the review period. This was partially offset by the sales volumes, which positively contributed QR10mn to net profits in 2020. The overall cost of goods sold remained lower on declining raw material prices, energy costs and cost optimization initiatives helped to realize savings in staff costs, plant maintenance and technical services costs. On overall basis, decline in cost of goods sold contributed QR255mn positively to the net profits in 2020. QAMC's total assets stood at QR5.8bn. Its share of net debt in the JV increased marginally by QR5mn during 2020, to reach QR1.9bn at the end of December 31, 2020, after considering share of cash and bank balances amounting to QR332mn. Share of debt declined by 8% on repayment of principal debt amounting to QR222mn. QAMC’s financial position continued to remain robust despite several macroeconomic headwinds, with the liquidity position reaching QR740mn in cash and bank balances (including proportionate share of cash and bank balances of the joint venture, after excluding restricted cash balance pertaining to dividend payable). During the year, QAMC's JV generated positive share of operating cash flows of QR684mn, marginally
- 3. Page 3 of 8 down 1% compared to 2019, with a share of free cash flows of QR226mn. (QNB FS Research, QSE, Gulf-Times.com) In FY2020, Ooredoo Group has posted a net profit of QR1.1bn – ORDS reports net loss of QR341.7mn in 4Q2020 as compared to net profit of QR459.6mn in 4Q2019 and net profit of QR649.8mn in 3Q2020. The company's revenue came in at QR7,452.6mn in 4Q2020, which represents a decrease of 6.3% YoY. However, on QoQ basis revenue rose 2.1%. In FY2020, Ooredoo Group has posted a net profit of QR1.1bn, which was down 35% YoY mainly due to lower EBITDA and one off gains in 2019 from the Indonesian tower sales. EPS amounted to QR0.35 in FY2020 as compared to QR0.54 in FY2019. In 4Q2020 the net profit was “negatively impacted” by foreign exchange losses mainly due to the devaluation of the Iraqi dinar and a one-off impairment from an investment, Ooredoo said while announcing its financial results for FY2020. Revenue declined by 4% YoY to QR28.9bn in 2020, due to the COVID-19 pandemic impact, with a reduction in handset sales and roaming business as well as macroeconomic weakness in some of its markets. This was partially offset by growth in Indonesia, Myanmar and Palestine. EBITDA declined by 6% YoY to QR12.1bn in 2020, impacted by lower revenues and challenging market conditions across most markets. The company said it maintains its focus on digitalization and cost optimization, which has been reflected in a healthy EBITDA margin of 42% for FY2020. Ooredoo Group expanded its customer base by 3% to 121mn customers, boosted by additions in Iraq, Indonesia and Myanmar. The Group maintains healthy cash reserves and liquidity levels, and with a net profit of QR1.1bn, the board of directors has recommended the distribution of a cash dividend of QR0.25 per share. Ooredoo’s Managing Director, Aziz Aluthman Fakhroo said, “I am pleased to report a solid financial performance across our operations, in spite of the Covid-19 pandemic and the challenging macro-economic environment. Group revenues were QR28.9bn in 2020, down 4% compared to the previous year, due to macroeconomic weaknesses in some of our markets. Throughout the year, we remained focused on our cost optimization strategy, which enabled us to maintain a robust EBITDA margin of 42% in 2020. EBITDA during the year was QR12.1bn, down slightly from QR12.8bn in the previous year due to the decline in revenues. Net profit for the year declined to QR1.1bn, mainly due to lower EBITDA and to one off gains from the Indonesian tower sales in 2019. Ooredoo Group continues to witness strong demand for its product and services, as demonstrated by the 3% increase in our customer base to 121mn during these challenging times, supported by strong customer growth in Myanmar, Indonesia and Iraq.” Ooredoo Qatar – Ooredoo Qatar delivered a solid performance in 2020, despite a range of challenges caused by the COVID-19 pandemic. Reported revenue stood at QR7bn (FY 2019: QR7.3bn), down 3% mainly as a result of the pandemic. EBITDA was QR3.7bn (FY 2019: QR4bn), 7% below FY2019, with an EBITDA margin of 52%. Following a service disruption during the period, customers were provided with a 50% discount on mobile bills as compensation, impacting the 4Q2020 results, Ooredoo said. Customer numbers were 3.3mn by year-end in line with 2019, with the mobile customer base growing by 1% and the post-paid base growing by 10% compared to 4Q2019. The Ooredoo ONE ‘All-In-One’ Home Service support posted growth of 1% in the OTV customer base compared to 4Q2019. (QSE, Gulf-Times.com) QATI's bottom line rises 50.0% YoY and 310.9% QoQ in 4Q2020 – Qatar Insurance Company's (QATI) net profit rose 50.0% YoY (+310.9% QoQ) to QR248.4mn in 4Q2020.The company's net earned premiums came in at QR1,531.8mn in 4Q2020, which represents a decrease of 27.5% YoY (-29.1% QoQ). In FY2020, QATI recorded net profit of QR101.0mn as compared to QR650.9mn in FY2019. Loss per share amounted to QR0.004 in FY2020 as compared to earnings per share of QR0.174 in FY2019. QATI reported gross written premiums (GWP) for 2020 remained stable at QR12.2bn compared to QR12.06bn for 2019. QATI’s MENA direct operations reported gross written premiums of QR2.3bn compared to QR2.2bn in 2019. The board proposed the non-distribution of divided for the year 2020 taking into consideration the insignificant net profit achieved during the year. QATI's continued endeavor towards process efficiency and automation resulted in further improvement of its already exceptionally low administrative expense ratio for its core operations to 6.2%. QATI Group’s net underwriting results for the year were directly impacted by the losses arising from the reported global market events of COVID-19 pandemic losses and abnormal catastrophe losses. The Group’s net underwriting result stood at a loss of QR595mn compared to profit of QR282mn in 2019. The Group also continued to follow its prudent reserve strengthening policy across the international business. On the other hand, with the exit of several key international insurer’s from the GCC region, QATI Group's direct business in Qatar and the MENA region continued to strongly consolidate its leading position by demonstrating consistent growth across select lines of business and delivering consistent and healthy underwriting profits. Despite the exceptional volatility in global financial markets, QATI’s investment portfolio performed reasonably well. For the year 2020, the Group registered an investment and other income of QR1,366mn compared to QR1,036mn in 2019. On a YoY basis this reflects an annualized return on investment, excluding one-off gains, of 3.5%. Epicure Investment Management Limited, QATI Group’s wholly owned investment management company is the largest investment manager in Qatar with investments assets in excess of $7bn (including external AUM’s) and is also one of the largest investment manager in GCC. In a statement QATI Group said, “2020 was one of the most challenging year for the global insurance industry. The impact of COVID-19 on global insurance markets was largely felt through the deluge of insurance claims together with the impact on investment income by elevated levels of capital markets volatility. The global insurance industry has estimated that the 2020 losses arising from COVID-19 pandemic were in excess of $200bn. The global insurance industry also had to absorb one of worst catastrophe losses during the year with an estimated $83bn insured loss, the fifth costliest in history. While QATI Group’s international business was impacted by global losses arising from the COVID-19 pandemic and from catastrophe losses, MENA insurance operations once again delivered an outstanding performance during the year. The COVID-19 pandemic enforced strict lockdown measures helped to
- 4. Page 4 of 8 maintain satisfactory performance, as motor and medical lines of business saw reduced claims activity. Our successful positioning as one of the most digitally transformed insurance company in the region in the personal line segment, witnessed major growth in the B2C and B2B channels of business during the pandemic. Meanwhile our international business continued its process of de-risking non profitable business and carefully allocating risk capacity from high severity, capital intensive risks to less volatile and lower severity lines of business. The Gross Written Premiums for our international operations stood at QR9.9bn compared to QR9.8bn in 2019. Our international business now accounts for 81% of the Group’s total premium base.” (QSE, Gulf-Times.com) QLMI’s net profit rises 12.9% YoY to QR98.0mn in FY2020 – In FY2020, QLM Life & Medical Insurance Company’s (QLMI) net profit stood at QR98.0mn, which shows 12.9% YoY increase. QLMI recorded net earned premiums of QR966.3mn in FY2020 as compared to QR874.7mn (+10.5% YoY) in FY2019. QLMI’s total income rose 9.8% YoY to QR143.6mn in FY2020. The EPS amounted to QR0.28 per share in FY2020 as against QR0.25 per share in FY2019. The board proposed the non-distribution of divided for the year 2020 as per the IPO prospectus. QLMI’s CEO, Fahad Mohamed Al-Suwaidi said, “QLMI benefits from its indigenous expertise in providing end to end health and life insurance solutions with unmatched in-house capabilities and an unrivalled provider network which provides a strong base for the company to offer best in class services. QLMI is continuously innovating to leverage technology to automate processes and deliver a seamless experience to our insured members. The company is well positioned and has a robust capital base and recently has been rated A negative with stable outlook by Standard & Poor’s, based on its stand-alone financial strength. We have a well carved out strategy and are confident of exceeding the expectation of all the stakeholders.” To pursue its objectives of providing valuable and affordable insurance protection to residents and citizens as well as to generate new channels of revenue, the company has planned to enter the retail segment and shall soon be launching individual life and medical products, QLMI said. (QSE, Gulf- Times.com) BRES posts 257.0% QoQ increase in net profit in 4Q2020 – Barwa Real Estate Company's (BRES) net profit declined 29.8% YoY (but rose 257.0% on QoQ basis) to QR490.7mn in 4Q2020.The company's ‘net rental and finance lease income’ came in at QR284.2mn in 4Q2020, which represents an increase of 19.7% YoY (+7.2% QoQ). In FY2020, BRES recorded net profit of QR1,214.2mn as compared to QR1,502.8mn in FY2019. EPS amounted to QR0.31 in FY2020 as compared to QR0.39 in FY2019. BRES’ board of directors has proposed cash dividend distribution to shareholders of QR 0.125 per share. (QSE) UDCD CEO: Delivery of new projects in The Pearl-Qatar to begin by year-end – United Development Company’s (UDCD) President, CEO and member of the board, Ibrahim Jassim Al Othman has said that the reason behind high price in The Pearl-Qatar is due to the high cost of construction and services being provided there. “The Pearl-Qatar is a special place located on the sea and constructing buildings here differs from constructions on other areas in terms of cost. The Pearl Qatar offers all services including hotels, restaurants and shops. The prices suit to a certain class of buyers/tenants therefore everyone cannot buy an apartment in it. There is also a Government Services Center, in addition to a fire station, and we are currently working to build a clinic as well,” Al Othman said in a recent interview with Qatar TV. With regard to ongoing projects, he said that the volume of under construction projects implemented by the UDCD at The Pearl- Qatar is estimated at QR2.5bn, and delivery of these projects will begin at the end of this year or by the start of first or second quarter of 2022. Al Othman stressed that there is more focus on Qatari real estate developers, indicating that there are foreign developers, but now majority are Qataris, adding that the financial results of the company are good despite the COVID-19 pandemic related situation and declines in the real estate since 2015. (Peninsula Qatar)
- 5. Page 5 of 8 Qatar Stock Exchange Top Gainers Top Decliners Source: Qatar Stock Exchange (QSE) Source: Qatar Stock Exchange (QSE) Most Active Shares by Value (QR Million) Most Active Shares by Volume (Million) Source: Qatar Stock Exchange (QSE) Source: Qatar Stock Exchange (QSE) Investor Trading Percentage to Total Value Traded Net Traded Value by Nationality (QR Million) Source: Qatar Stock Exchange (QSE) Source: Qatar Stock Exchange (QSE) 9.2% 2.8% 1.8% 1.4% 1.4% 0.0% 4.0% 8.0% 12.0% Qatar Aluminium Manufacturing Company Qatar Cinema & Film Distribution Company Qatari German Company for Medical Devices Investment Holding Group Qatar Islamic Insurance Company -9.7% -6.3% -4.4% -3.9% -3.3% -12.0% -8.0% -4.0% 0.0% Ooredoo Qatar Insurance Company Gulf Warehousing Company QNB Group Qatari Investors Group 295.3 163.4 154.7 82.4 82.4 0.0 105.0 210.0 315.0 QNB Group Qatar Aluminium Manufacturing Company Qatari German Company for Medical Devices Qatar Islamic Bank Masraf Al Rayan 163.7 102.4 57.7 47.3 44.5 0.0 60.0 120.0 180.0 Qatar Aluminium Manufacturing Company Investment Holding Group Salam International Investment Limited Qatari German Company for Medical Devices Qatar First Bank 0% 20% 40% 60% 80% 100% Buy Sell 39.74% 38.59% 23.49% 18.71% 13.66% 13.04% 23.12% 29.66% Qatari Individuals Qatari Institutions Non-Qatari Individuals Non-Qatari Institutions 1,136 661 1,029 767 106 -106 -500 0 500 1,000 1,500 Qatari Non-Qatari Net Investment Total Sold Total Bought
- 6. Page 6 of 8 TECHNICAL ANALYSIS OF THE QSE INDEX Source: Reuters The QE Index closed down for the week 2.37% from the previous week and printed last at 10,273.35 points. The Index started to breach below the major uptrend channel, but that breach remains in testing phase. As a result, we continue to keep our support at the 10,200 level and the resistance at the 11,000 level. DEFINITIONS OF KEY TERMS USED IN TECHNICAL ANALYSIS RSI (Relative Strength Index) indicator – RSI is a momentum oscillator that measures the speed and change of price movements. The RSI oscillates between 0 to 100. The index is deemed to be overbought once the RSI approaches the 70 level, indicating that a correction is likely. On the other hand, if the RSI approaches 30, it is an indication that the index may be getting oversold and therefore likely to bounce back. MACD (Moving Average Convergence Divergence) indicator – The indicator consists of the MACD line and a signal line. The divergence or the convergence of the MACD line with the signal line indicates the strength in the momentum during the uptrend or downtrend, as the case may be. When the MACD crosses the signal line from below and trades above it, it gives a positive indication. The reverse is the situation for a bearish trend. Candlestick chart – A candlestick chart is a price chart that displays the high, low, open, and close for a security. The ‘body’ of the chart is portion between the open and close price, while the high and low intraday movements form the ‘shadow’. The candlestick may represent any time frame. We use a one-day candlestick chart (every candlestick represents one trading day) in our analysis. Doji candlestick pattern – A Doji candlestick is formed when a security's open and close are practically equal. The pattern indicates indecisiveness, and based on preceding price actions and future confirmation, may indicate a bullish or bearish trend reversal. Shooting Star/Inverted Hammer candlestick patterns – These candlestick patterns have a small real body (open price and close price are near to each other), and a long upper shadow (large intraday movement on the upside). The Shooting Star is a bearish reversal pattern that forms after a rally. The Inverted Hammer looks exactly like a Shooting Star, but forms after a downtrend. Inverted Hammers represent a potential bullish trend reversal.
- 7. Page 7 of 8 Source: Bloomberg Company Name Price February 18 % Change WTD % Change YTD Market Cap. QR Million TTM P/E P/B Div. Yield Qatar National Bank 16.35 (3.94) (8.02) 151,016 13.7 2.0 2.8 Qatar Islamic Bank 16.65 (1.89) (1.40) 39,343 14.0 2.2 3.2 Commercial Bank of Qatar 4.36 (1.02) (1.02) 17,626 16.1 1.0 4.6 Doha Bank 2.27 (2.96) (4.31) 7,023 13.9 0.7 N/A Al Ahli Bank 3.80 0.66 10.24 9,233 13.6 1.5 3.8 Qatar International Islamic Bank 8.70 (2.62) (3.56) 13,171 15.9 2.1 4.9 Masraf Al Rayan 4.31 (2.16) (4.83) 32,288 14.8 2.3 5.2 Al Khaliji Bank 2.07 (2.54) 14.25 7,463 12.1 1.2 3.6 Qatar First Bank 1.81 (1.63) 5.17 1,267 N/A 2.7 N/A National Leasing 1.18 (3.20) (5.07) 584 12.8 0.8 2.1 Dlala Holding 1.84 (2.39) 2.51 523 N/A 2.5 N/A Qatar & Oman Investment 0.87 1.05 (2.03) 274 21.7 0.9 2.3 Islamic Holding Group 5.30 (0.06) 3.54 300 49.6 2.1 N/A Banking and Financial Services 280,108 Zad Holding 14.41 (3.29) (3.35) 3,415 16.9 2.3 5.9 Qatar German Co. for Medical Devices 3.28 1.83 46.58 379 N/A 12.6 N/A Salam International Investment 0.63 0.16 (3.84) 716 N/A 0.5 N/A Baladna 1.74 (0.29) (2.91) 3,304 N/A 1.5 1.2 Medicare Group 8.46 (0.70) (4.30) 2,381 29.0 2.4 21.3 Qatar Cinema & Film Distribution 3.85 2.81 (3.63) 242 51.0 1.7 2.6 Qatar Fuel 17.72 (2.05) (5.14) 17,618 23.2 2.1 4.5 Qatar Meat and Livestock 6.10 (0.49) (3.51) 1,098 12.8 2.7 4.9 Mannai Corp. 2.95 (1.17) (1.80) 1,344 N/A 0.6 6.8 Al Meera Consumer Goods 19.65 (1.75) (5.12) 3,930 19.4 2.6 4.3 Consumer Goods and Services 34,426 Qatar Industrial Manufacturing 2.85 (2.90) (11.19) 1,354 16.5 0.9 5.3 Qatar National Cement 4.56 (2.31) 9.88 2,980 20.4 1.0 6.6 Industries Qatar 12.12 (0.66) 11.50 73,326 37.6 2.2 3.3 Qatari Investors Group 1.93 (3.30) 6.79 2,404 29.1 0.8 2.8 Qatar Electricity and Water 17.45 (2.30) (2.24) 19,195 16.6 2.0 4.4 Aamal 0.84 (0.35) (1.40) 5,311 34.2 0.7 4.7 Gulf International Services 1.65 (2.25) (3.73) 3,068 52.5 0.9 N/A Mesaieed Petrochemical Holding 1.96 (1.21) (4.49) 24,561 23.7 1.6 3.6 Invesment Holding Group 0.56 1.44 (5.84) 468 9.8 0.6 N/A Qatar Aluminum Manufacturing 1.03 9.21 6.72 5,759 N/A 1.0 1.0 Industrials 138,427 Qatar Insurance 2.25 (6.25) (4.74) 7,349 N/A 0.9 6.7 Doha Insurance 1.60 0.69 14.66 798 14.8 0.7 5.0 Qatar General Insurance & Reinsurance 2.53 1.32 (4.89) 2,214 N/A 0.4 N/A Al Khaleej Takaful Insurance 2.80 (0.92) 47.52 715 24.0 1.3 1.8 Qatar Islamic Insurance 7.10 1.41 2.88 1,065 14.8 2.8 5.3 Insurance 12,140 United Development 1.57 (2.48) (5.14) 5,559 24.6 0.5 3.2 Barw a Real Estate 3.28 (2.09) (3.56) 12,763 10.5 0.6 6.1 Ezdan Real Estate 1.68 (1.69) (5.18) 44,668 N/A 1.4 N/A Mazaya Qatar Real Estate Development 1.22 (2.40) (3.48) 1,411 47.2 1.1 N/A Real Estate 64,402 Ooredoo 7.71 (9.66) 2.53 24,697 22.5 1.1 3.2 Vodafone Qatar 1.50 (1.45) 11.80 6,328 34.5 1.4 3.3 Telecoms 31,024 Qatar Navigation (Milaha) 7.40 (1.33) 4.33 8,475 16.4 0.6 4.1 Gulf Warehousing 5.01 (4.42) (1.67) 294 12.5 1.5 2.0 Qatar Gas Transport (Nakilat) 3.30 (2.91) 3.77 18,283 15.8 2.6 3.0 Transportation 27,052 Qatar Exchange 591,575
- 8. Contacts Saugata Sarkar, CFA, CAIA Shahan Keushgerian Zaid al-Nafoosi , CMT, CFTe Head of Research Senior Research Analyst Senior Research Analyst Tel: (+974) 4476 6534 Tel: (+974) 4476 6509 Tel: (+974) 4476 6535 saugata.sarkar@qnbfs.com.qa shahan.keushgerian@qnbfs.com.qa zaid.alnafoosi@qnbfs.com.qa Mehmet Aksoy, PhD QNB Financial Services Co. W.L.L. Senior Research Analyst Contact Center: (+974) 4476 6666 Tel: (+974) 4476 6589 PO Box 24025 mehmet.aksoy@qnbfs.com.qa Doha, Qatar Disclaimer and Copyright Notice: This publication has been prepared by QNB Financial Services Co. W.L.L. (“QNB FS”) a wholly-owned subsidiary of Qatar National Bank (Q.P.S.C.). QNB FS is regulated by the Qatar Financial Markets Authority and the Qatar Exchange. Qatar National Bank (Q.P.S.C.) is regulated by the Qatar Central Bank. This publication expresses the views and opinions of QNB FS at a given time only. It is not an offer, promotion or recommendation to buy or sell securities or other investments, nor is it intended to constitute legal, tax, accounting, or financial advice. QNB FS accepts no liability whatsoever for any direct or indirect losses arising from use of this report. Any investment decision should depend on the individual circumstances of the investor and be based on specifically engaged investment advice. We therefore strongly advise potential investors to seek independent professional advice before making any investment decision. Although the information in this report has been obtained from sources that QNB FS believes to be reliable, we have not independently verified such information and it may not be accurate or complete. QNB FS does not make any representations or warranties as to the accuracy and completeness of the information it may contain, and declines any liability in that respect. For reports dealing with Technical Analysis, expressed opinions and/or recommendations may be different or contrary to the opinions/recommendations of QNB FS Fundamental Research as a result of depending solely on the historical technical data (price and volume). QNB FS reserves the right to amend the views and opinions expressed in this publication at any time. It may also express viewpoints or make investment decisions that differ significantly from, or even contradict, the views and opinions included in this report. This report may not be reproduced in whole or in part without permission from QNB FS COPYRIGHT: No part of this document may be reproduced without the explicit written permission of QNB FS. Page 8 of 8