QNBFS Weekly Market Report February 17, 2022
•
0 likes•129 views

- The weekly market report provides an overview of market performance in regional indices such as Qatar, Dubai, Abu Dhabi, Saudi Arabia, and others for the week ending February 17, 2022. - It also summarizes the performance of the Qatar Stock Exchange for the week, noting a 0.57% decline in the QSE Index. Trading value and volume increased week-over-week. - News briefs highlight quarterly earnings reports from Qatari companies like QLMI, QEWS, BRES, and ORDS, as well as an upcoming $500 million dairy project in the Philippines by Qatari company Baladna.

Recommended
Recommended
More Related Content
What's hot
What's hot (20)
Similar to QNBFS Weekly Market Report February 17, 2022
Similar to QNBFS Weekly Market Report February 17, 2022 (20)
More from QNB Group
More from QNB Group (20)
Recently uploaded
Recently uploaded (20)
QNBFS Weekly Market Report February 17, 2022
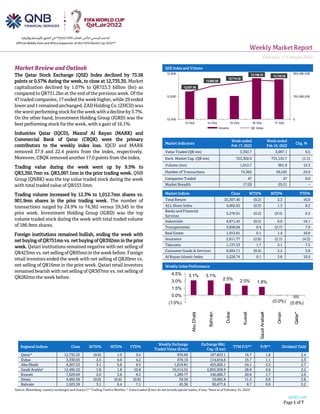
- 1. Weekly MarketReport Thursday,17February2022 qnbfs.com Page 1 of 7 Regional Indices Close WTD% MTD% YTD% Weekly Exchange Traded Value ($ mn) Exchange Mkt. Cap. ($ mn) TTM P/E** P/B** Dividend Yield Qatar* 12,735.35 (0.6) 1.9 9.5 939.60 197,823.1 16.7 1.8 2.4 Dubai 3,330.05 2.5 4.0 4.2 470.19 114,016.9 15.7 1.1 2.3 Abu Dhabi 9,207.52 3.1 5.8 8.5 1,619.81 453,026.1 24.1 2.5 2.7 Saudi Arabia# 12,495.22 1.8 1.8 10.8 10,514.52 2,855,938.9 26.4 2.6 2.2 Kuwait 7,629.09 2.0 3.8 8.3 1,289.77 146,006.7 20.8 1.7 2.0 Oman 4,092.50 (0.0) (0.6) (0.9) 59.34 19,002.8 11.3 0.8 3.8 Bahrain 1,925.59 3.1 6.4 7.1 45.36 30,477.6 8.7 0.9 3.2 Source: Bloomberg, country exchanges and Zawya (** Trailing Twelve Months; * Value traded ($ mn) do not include special trades, if any; #Data as of February 16, 2022) Market Review and Outlook QSE Index and Volume The Qatar Stock Exchange (QSE) Index declined by 73.58 points or 0.57% during the week, to close at 12,735.35. Market capitalization declined by 1.07% to QR723.3 billion (bn) as compared to QR731.2bn at the end of the previous week. Of the 47 traded companies, 17 ended the week higher, while 29 ended lowerand1remainedunchanged. ZADHolding Co. (ZHCD)was theworstperformingstock fortheweek withadeclineby3.7%. On the other hand, Investment Holding Group (IGRD) was the best performing stock for the week, with a gain of 16.1%. Industries Qatar (IQCD), Masraf Al Rayan (MARK) and Commercial Bank of Qatar (CBQK) were the primary contributors to the weekly index loss. IQCD and MARK removed 37.9 and 22.4 points from the index, respectively. Moreover, CBQK removed another 17.0 points from the index. Trading value during the week went up by 9.5% to QR3,392.7mn vs. QR3,097.1mn in the prior trading week. QNB Group (QNBK) was the top value traded stock during the week with total traded value of QR553.5mn. Trading volume increased by 12.3% to 1,012.7mn shares vs. 901.9mn shares in the prior trading week. The number of transactions surged by 24.9% to 74,362 versus 59,545 in the prior week. Investment Holding Group (IGRD) was the top volume traded stock during the week with total traded volume of 186.9mn shares. Foreign institutions remained bullish, ending the week with net buying of QR751mn vs. net buying of QR392mn in the prior week. Qatari institutions remained negative with net selling of QR423mnvs. netsellingofQR95mnintheweek before. Foreign retail investors ended the week with net selling of QR20mn vs. net selling of QR16mn in the prior week. Qatari retail investors remained bearish with net selling of QR307mn vs. net selling of QR282mn the week before. Market Indicators Week ended Feb 17, 2022 Week ended Feb 10, 2022 Chg. % Value Traded (QR mn) 3,392.7 3,097.1 9.5 Exch. Market Cap. (QR mn) 723,302.0 731,155.7 (1.1) Volume (mn) 1,012.7 901.9 12.3 Number of Transactions 74,362 59,545 24.9 Companies Traded 47 47 0.0 Market Breadth 17:29 25:21 – Market Indices Close WTD% MTD% YTD% Total Return 25,307.40 (0.2) 2.3 10.0 ALL Share Index 4,002.62 (0.3) 1.3 8.2 Banks and Financial Services 5,276.91 (0.2) (0.3) 6.3 Industrials 4,671.45 (0.5) 6.6 16.1 Transportation 3,838.04 0.4 (2.7) 7.9 Real Estate 1,913.81 0.1 1.4 10.0 Insurance 2,611.77 (2.6) (2.1) (4.2) Telecoms 1,137.53 1.7 3.1 7.5 Consumer Goods & Services 8,694.11 (0.4) 2.2 5.8 Al Rayan Islamic Index 5,228.74 0.1 3.6 10.9 Weekly Index Performance 12,637.36 12,693.09 12,714.32 12,746.10 12,735.35 0 150,000,000 300,000,000 12,400 12,600 12,800 13-Feb 14-Feb 15-Feb 16-Feb 17-Feb Volume QE Index 3.1% 3.1% 2.5% 2.0% 1.8% (0.0%) (0.6%) (1.5%) 0.0% 1.5% 3.0% 4.5% Abu Dhabi Bahrain Dubai Kuwait Saudi Arabia# Oman Qatar*
- 2. qnbfs.com Page 2 of 7 Economic, Market & Company News MSCI Quarterly Index review result – MSCI announced on 09 February 2022, the results of the Quarter Index Review. For the MSCI Qatar Indices the outcome of the review is as follows: i) addition to the MSCI Qatar Indices (none), ii) deletion from the MSCI Qatar Indices (none). The changes to the MSCI Qatar index will become effective on close of February 28, 2022. (QSE) QLMI's bottom line rises 11.5% YoY and 69.0% QoQ in 4Q2021 – QLM Life & Medical Insurance Company's (QLMI) net profit rose 11.5% YoY (+69.0% QoQ) to QR31.9mn in 4Q2021.The company's net earned premiums came in at QR225.6mn in 4Q2021, which represents a decrease of 23.4% YoY. However, on QoQ basis, net earned premiums rose 17.3%. QLMI has reported a net profit of QR106mn for the 12-month financial period ended December 31, 2021, recording an 8% increase compared to QR98mn in 2020. The Company’s net under-writing income also grew by 16% to QR119.2mn in 2021 from QR102.4mn in 2020. QLMI’s gross written premium rose by 3% to QR1.03bn last year compared to QR1bn for the same period in 2020. Earnings per share stood at QR0.30 in 2021 compared to QR0.28 per share for the same period in the previous year. Commenting on the Company’s results, Sheikh Saoud bin Khalid bin Hamad Al Thani, Chairman of the Board of Directors at QLM stated: “2021 has been a benchmark year in the Company’s journey so far, as this is the first year in which the net profits surpassed QR100mn milestone coupled with the first year of being a publicly listed company. The core operations of the Company remain strong and efficiently managed as it continues to create shareholder value through its unbridled commitment to maintain best in class quality of service and in enhancing the overall productivity of the organization. A long-term strategy is in place to grow the business which is in line with the Qatar National Vision 2030”.The Company’s board has accordingly recommended a cash dividend of 22% (QR0.22 per share) which shall be placed for approval in the forthcoming Annual General Meeting of the shareholders and shall be subject to the approval of the regulator (Qatar Central Bank) and other statutory authorities. (QSE, Peninsula Qatar) QEWS posts 136.5% YoY increase but 25.4% QoQ decline in net profit in 4Q2021, below our estimate – Qatar Electricity & Water Company's (QEWS) net profit rose 136.5% YoY (but declined 25.4% on QoQ basis) to QR291.9mn in 4Q2021, below our estimate of QR311.2mn (variation of -6.2%). The company's revenue came in at ~QR635mn in 4Q2021, which was almost flat on YoY basis (-0.7% QoQ). EPS amounted to QR1.33 in FY2021 as compared to QR1.05 in FY2020. QEWS recorded revenue of QR 2,475mn in FY2021 (decrease of 4% compared to FY2020) and net profit of QAR 1,468mn compared to a net profit of QAR 1,158mn for the same period in 2020. During the year, QEWS’ market share in Qatar in the supply of electricity was 61% and desalinated water was 70%; successful continuation to focus on the renewable energy domain in 2021 through Siraj Energy, and aiming to expand into international markets through its subsidiary Nebras Power. QEWS remains to be in an excellent financial position with a strong credit rating of ‘A1’ with stable outlook from Moody’s. The BOD has recommended a dividend per share of QAR 0.80 to be approved at the Annual Shareholders General Assembly on 14 March 2022. Total dividend payment will be QR880mn, which is 60% of the net profit of the company. Operating profits amounted to QR1,036mn compared to QAR 782mn during the same period in 2020. Cash flows from operations remain strong when compared to the same period in the previous year. QEWS recorded operational cash flows of QAR 1,235mn compared to operational cash flows of QAR 1,169mn during the same period in the previous year. (QSE) ORDS's bottom line rises 310.1% QoQ in 4Q2021 – Ooredoo (ORDS) reported net profit of QR806.5mn in 4Q2021 as compared to net loss of QR341.7mn in 4Q2020 and net profit of QR196.6mn in 3Q2021.The company's revenue came in at QR7,782.1mn in 4Q2021, which represents an increase of 4.4% YoY (+2.3% QoQ). EPS amounted to QR0.01 in FY2021 as compared to QR0.35 in FY2020. ORDS revenue for 2021 stood at QR30 billion, an increase of 4 percent compared to the same period last year. “The increase in revenue was mainly driven by growth in our home market Qatar, Indonesia, and Tunisia. Excluding FX impact, revenue increased 7 percent,” the company said in a statement. Group EBITDA for the period was QR13 billion with a corresponding EBITDA margin of 44 percent, driven by growth in Indonesia, improving macroeconomic conditions in Kuwait and increased customer confidence in Algeria. The EBITDA growth rate stood at 8 percent and at 11 percent excluding FX impact. The Group’s Free Cash Flow increased by 30 percent to reach QR8.2 billion. The Group’s net profit attributable to shareholders stood at QR47 million. The 96 percent reduction was mainly due to FX losses and impairments in Myanmar. The negative impact was partly offset by profit from the sale and leaseback of Indosat Ooredoo’s tower assets (QR1,000 million). Excluding these one- offs and FX impact, net profit had a growth of 61 percent. The consolidated customer base at the end of 2021 exceeded 121 million thanks to strong performances in Indonesia, Oman, Algeria, and Iraq. The board recommends the distribution of a cash dividend of QR0.3 per share. This recommendation is based on a healthy balance sheet, adequate liquidity, and overall solid operational performance. (QSE, Company Releases, Qatar Tribune) BRES posts 23% YoY decrease but 86.3% QoQ increase in net profit in 4Q2021 – Barwa Real Estate Company's (BRES) net profit declined 23% YoY (but rose 86.3% on QoQ basis) to QR377.9mn in 4Q2021. EPS amounted to QR0.286 in FY2021 as compared to QR0.312 in FY2020. The board of directors proposed the distribution of a cash dividend of 17.5% of the shares’ par value at the rate of QR 0.175 per share. The proposed cash dividend is subject to the approval of the shareholders’ general assembly. (QSE) QNB Group launches sustainable monetary project – QNB Group in conjunction with UK-based HSBC have launched a green energy-centered monetary tool which will aid in increasing the short term sustainable funding options for banks and companies. Considered HSBC’s first green repurchase agreement globally which are short-term money market instruments used to manage
- 3. qnbfs.com Page 3 of 7 near term liquidity and funding needs mainly by banks and major firms, these green bonds help boost demands for sustainable assets, according to Qatar News Agency. (Bloomberg) Giant Qatar firm Baladna (BLDN QD) eyes $500-M integrated dairy facility in Philippines – Baladna, the largest food and dairy producer in Qatar, plans to set up a $500-million integrated dairy facility in the Philippines, the Department of Agriculture (DA) said on Monday. In a statement, the DA said the planned large- scale and fully integrated dairy facility was expected to bolster local production and jump-start investments in the country’s dairy industry. Agriculture Secretary William Dar said the agency had identified five possible locations for the dairy facility that will be visited by the Baladna team in the next few weeks. It is designed to be climate-independent using world-class management systems. The integrated dairy facility, a partnership between Baladna, the DA and the Department of Trade and Industry (DTI), will significantly increase local milk production by 120 million liters from the current level of 26.71 million liters. “This will be bringing the Philippines’ total milk production to 146.71 million liters, thus contributing to addressing the local demand,” the DA added. In 2020, local milk production reached 26.71 million liters, up by 9.5 percent from 24.38 million liters the previous year. Baladna said that its main consideration for supporting the Philippine government was to help bolster domestic dairy production. Baladna supplies over 95 percent of Qatar’s fresh dairy products. It is into raising livestock and production of dairy products including milk, yogurt, cheese, as well as juices and animal fertilizers. Dar said in a recent presentation in Dubai, United Arab Emirates that the Philippines is a major importer of dairy products, particularly milk powder, with importers and processors supplying the majority of the country’s annual dairy requirement. Baladna owns more than 24,000 Holstein cows on its 2.6 million square-meter facility with 40 state-of-the-art barns. Every day, it produces about 450 tons of fresh milk and juice products and has more than 1,650 employees. Meanwhile, the DTI, through the Board of Investments, is supporting the project through the grant of incentives under the Corporate Recovery and Tax Incentives for Enterprises (Create) law. “The investments will be able to generate 2,000 new jobs during the initial phase of its first full year of operations, providing significant opportunities for domestic employment,” Dar said. The DA and the Department of Trade and Industry (DTI) were able to sign a memorandum of understanding (MOU) with Baladna QPSC during a business engagement held in Dubai, United Arab Emirates recently. (Philippine Daily Inquirer) Qatar Investment Authority to commit $1.5 billion to India and SEA-focused fund – Qatar’s sovereign wealth fund, the Qatar Investment Authority (QIA), will commit up to $1.5 billion to a new fund set up by media magnate James Murdoch and former Star India chief executive, Uday Shankar. Together as co-chairs, the pair will run the new venture known as Bodhi Tree, an investment platform that will pursue media and consumer technology opportunities in Southeast Asia and India. (Bloomberg) Kamco: Qatar’s projects award jumps 93% y-o-y to $25.1bn in 2021 – Qatar was the second largest projects market in the Gulf Co-operation Council (GCC) during 2021, thanks to a better-than- usual $19.4bn contract awards in the first quarter (Q1) of 2021, according to Kamco Invest, a regional financial powerhouse. Overall, the country recorded a more than 93% year-on-year surge in contract awards to $25.1bn during the fiscal year 2021, Kamco Invest said in a report. In terms of sectors, Qatar’s gas sector took the lion’s share of projects in 2021 recording a total of $19.3bn worth of contracts and representing more than 77% of total projects awarded in the country during the year. During Q1- 2021 Qatargas, a subsidiary of state-owned QatarEnergy has awarded a $13bn liquefied natural gas contract to a group of French and Japanese energy companies (Chiyoda and Technip) for the first phase expansion of the North Field. On the other hand, Qatar’s total projects awards reached $272mn during the fourth quarter (Q4) of 2021, down from $2.8bn the comparable period of 2020, Kamco said in its latest update on the GCC projects. "Qatar is set to host the FIFA World Cup during the summer of 2022. Qatar’s government has stated that the country expects the four-week football event would add about $20bn to Qatar’s economy," the report said. "Combined with the easing of Covid-19 pandemic restrictions and the normalization of ties with the Gulf sister countries, Qatar is expected to record solid economic growth," it said. Reflecting higher oil prices and a renewed confidence that the Covid-19 recovery would likely continue unabated, the GCC projects market reached heights that were last seen in 2019. (Gulf-Times.com) Over 13,000 hotel rooms expected to be added in 2022 – Qatar’s hospitality sector will be in the global spotlight with FIFA World Cup just few months away. The hospitality sector is expected to see addition of over 13,000 hotel and hotel apartments rooms with the opening of many new hotels in the current year, according to a report released by Valustrat- a real estate consultancy firm. Companies are rushing to finish the hotel projects as early as possible in order to be ready before the FIFA World Cup Qatar 2022 which is set to kick off from November 21. “As per ValuStrat research, hotel and hotel apartments stock exceeded 30,000 keys. Pipeline for 2022 was adjusted upwards to 13,300 keys,” noted the report. (Peninsula Qatar) Minister: Health sector well prepared to meet World Cup 2022 demands – Qatar’s health sector is well prepared to meet the requirements of FIFA World Cup 2022, said Minister of Public Health, H E Dr. Hanan Al Kuwari at the opening session of Qatar Health 2022 and 2nd Qatar Public Health Conference, yesterday. Organized by the Ministry of Public Health (MoPH) and Hamad Medical Corporation (HMC), the four-day virtual conference is being held as part of the healthcare sector’s preparations for the FIFA Qatar World Cup 2022.“The coming months will be an incredibly exciting period for everyone living in Qatar as preparations intensify for the FIFA World Cup 2022. Our healthcare teams have been preparing for the tournament for many years, they have been involved in large-scale tournaments hosted in Doha, including the 2019 FIFA Club World Cup and IAAF World Athletics Championships 2019, as well as the recent FIFA Arab Cup,” said Dr. Al Kuwari. (Peninsula Qatar)
- 4. qnbfs.com Page 4 of 7 Qatar Stock Exchange Top Gainers Top Decliners Source: Qatar Stock Exchange (QSE) Source: Qatar Stock Exchange (QSE) Most Active Shares by Value (QR Million) Most Active Shares by Volume (Million) Source: Qatar Stock Exchange (QSE) Source: Qatar Stock Exchange (QSE) Investor Trading Percentage to Total Value Traded Net Traded Value by Nationality (QR Million) Source: Qatar Stock Exchange (QSE) Source: Qatar Stock Exchange (QSE) 16.1% 8.0% 3.5% 3.3% 3.1% 0.0% 7.0% 14.0% 21.0% Investment Holding Group Aamal Company Gulf International Services Mannai Corporation Islamic Holding Group -3.7% -3.5% -3.4% -3.2% -2.2% -6.0% -4.0% -2.0% 0.0% Zad Holding Company Qatar General Insurance & Reinsurance Company Qatar Insurance Company QNB Group Ahli Bank 553.5 369.3 302.3 264.8 152.6 0.0 210.0 420.0 630.0 QNB Group Qatar Islamic Bank Industries Qatar Investment Holding Group Masraf Al Rayan 186.9 145.8 65.1 62.6 61.7 0.0 70.0 140.0 210.0 Investment Holding Group Salam International Investment Limited Gulf International Services Qatar Aluminium Manufacturing Company Mazaya Qatar Real Estate Development 0% 20% 40% 60% 80% 100% Buy Sell 33.65% 42.71% 17.67% 30.13% 11.30% 11.90% 37.38% 15.25% Qatari Individuals Qatari Institutions Non-Qatari Individuals Non-Qatari Institutions 1,741 1,652 2,471 921 -730 730 -1,000 0 1,000 2,000 3,000 Qatari Non-Qatari Net Investment Total Sold Total Bought
- 5. qnbfs.com Page 5 of 7 TECHNICAL ANALYSIS OF THE QSE INDEX Source: Bloomberg The QE Index stayed with momentum, but closed marginally lower at 0.6% from the previous week. The Index printed last 12,735.35. Even though we see a possible correction around here, the thesis has not changed for the Index as the trend remains up. Our expected hard resistance level at 13,000 points; our support level at 12,000 points. DEFINITIONS OF KEY TERMS USED IN TECHNICAL ANALYSIS RSI (Relative Strength Index) indicator – RSI is a momentum oscillator that measures the speedand change of price movements. The RSI oscillates between 0 to 100. The index is deemed to be overbought once the RSI approaches the 70 level, indicating that a correction is likely. On the other hand, if the RSI approaches 30, it is an indication that the index may be getting oversold and therefore likely to bounce back. MACD (Moving Average Convergence Divergence) indicator – The indicator consists of the MACD line and a signal line. The divergence or the convergence of the MACD line with the signal line indicates the strength in the momentum during the uptrend or downtrend, as the case may be. When the MACD crosses the signal line from below and trades above it, it gives a positive indication. The reverse is the situation for a bearish trend. Candlestick chart – A candlestick chart is a price chart that displays the high, low, open, and close for a security. The ‘body’ of the chart is portion between the open and close price, while the high and low intraday movements form the ‘shadow’. The candlestick may represent any time frame. We use a one-day candlestick chart (every candlestick represents one trading day) in our analysis. Doji candlestick pattern – A Doji candlestick is formed when a security's open and close are practically equal. The pattern indicates indecisiveness, and based on preceding price actions and future confirmation, may indicate a bullish or bearish trend reversal. ShootingStar/Inverted Hammer candlestick patterns – These candlestick patterns have a small real body (open price and close price are near to each other), and a long upper shadow (large intraday movement on the upside). The Shooting Star is a bearish reversal pattern that forms after a rally. The Inverted Hammer looks exactly like a Shooting Star, but forms after a downtrend. Inverted Hammers represent a potential bullish trend reversal.
- 6. qnbfs.com Page 6 of 7 Source: Bloomberg Com pan y Nam e P rice Fe bruary 17 % Ch an ge WTD % Ch an ge YTD Marke t Cap. QR Million TTM P /E P /B Div. Yie ld Qatar National Bank 20.85 (3.25) 3.27 192,580 15.8 2.4 2.6 Qatar Islamic Bank 20.49 1.54 11.78 48,416 14.4 2.3 2.0 Commercial Bank of Qatar 6.82 (1.66) 0.98 27,582 13.4 1.5 1.5 Doha Bank 2.80 2.34 (12.47) 8,684 12.2 0.8 2.7 Al Ahli Bank 4.40 (2.22) 14.88 10,691 15.0 1.6 3.4 Qatar International Islamic Bank 10.53 2.33 14.33 15,939 17.7 2.4 3.1 Masraf Al Rayan 4.96 (1.49) 6.79 46,082 22.2 1.9 3.4 Qatar First Bank 1.80 (0.72) 0.34 1,257 10.6 2.3 N/A National Leasing 0.90 (1.42) (4.15) 446 N/A 0.7 2.8 Dlala Holding 1.44 1.41 16.69 409 26.5 1.8 N/A Qatar & Oman Investment 0.86 (1.15) 5.65 271 48.0 0.9 N/A Islamic Holding Group 5.00 3.09 26.74 283 46.4 2.0 1.0 Ban kin g an d Fin an cial Se rvice s 352,640 Zad Holding 16.30 (3.72) (2.40) 4,249 22.0 2.9 3.9 Qatar German Co. for Medical Devices 2.67 (1.11) (16.04) 308 101.2 9.3 N/A Salam International Investment 0.95 (0.11) 16.00 1,086 N/A 0.7 N/A Baladna 1.50 (0.20) 3.46 2,842 N/A 1.3 3.5 Medicare Group 8.40 (1.03) (1.15) 2,364 26.2 2.3 21.4 Qatar Cinema & Film Distribution 3.68 (1.68) 3.66 231 75.2 1.7 2.7 Qatar Fuel 19.80 0.25 8.32 19,686 20.3 2.2 2.3 Qatar Meat and Livestock 3.45 (1.17) (3.90) 622 N/A 2.0 2.9 Mannai Corp. 8.35 3.33 75.84 3,809 9.5 1.8 0.1 Al Meera Consumer Goods 20.25 (0.25) 3.32 4,050 22.5 2.7 4.4 Con sum e r Goods an d Se rvice s 39,248 Qatar Industrial Manufacturing 3.21 0.56 4.53 1,525 11.1 0.9 3.1 Qatar National Cement 6.40 0.00 25.49 4,183 18.5 1.4 3.1 Industries Qatar 17.96 (1.86) 15.95 108,658 13.5 2.8 1.8 Qatari Investors Group 2.27 (0.96) 2.16 2,820 20.5 1.0 2.6 Qatar Electricity and Water 17.99 (0.06) 8.37 19,789 13.4 1.7 3.5 Aamal 1.18 7.98 8.58 7,415 30.9 1.0 3.4 Gulf International Services 1.79 3.47 4.25 3,325 N/A 1.0 N/A Mesaieed Petrochemical Holding 2.76 1.03 31.82 34,612 21.1 2.1 1.5 Invesment Holding Group 1.52 16.11 23.76 1,262 63.5 1.5 N/A Qatar Aluminum Manufacturing 2.08 (0.95) 15.49 11,607 13.9 1.8 1.7 In dustrials 195,195 Qatar Insurance 2.53 (3.40) (8.00) 8,263 15.6 1.0 N/A QLM Life & Medical Insurance 5.09 (2.06) 0.81 1,782 16.9 3.0 N/A Doha Insurance 1.90 (0.78) (0.99) 951 13.5 0.8 5.3 Qatar General Insurance & Reinsurance 1.95 (3.47) (2.50) 1,706 13.2 0.3 N/A Al Khaleej Takaful Insurance 3.80 (0.86) 5.56 970 20.0 1.9 1.3 Qatar Islamic Insurance 8.72 1.95 8.96 1,308 16.1 3.2 3.7 In suran ce 14,980 United Development 1.67 (0.36) 8.44 5,913 16.6 0.5 3.0 Barwa Real Estate 3.50 0.92 14.44 13,627 12.2 0.7 3.6 Ezdan Real Estate 1.40 (1.41) 4.40 37,135 96.6 1.1 N/A Mazaya Qatar Real Estate Development 0.91 (0.22) (1.41) 1,050 34.2 0.8 3.3 Re al Estate 57,725 Ooredoo 7.56 2.25 7.62 24,200 641.9 1.1 3.3 Vodafone Qatar 1.79 0.34 7.38 7,566 23.0 1.6 2.8 Te le com s 31,767 Qatar Navigation (Milaha) 8.47 0.85 10.91 9,624 13.3 0.7 3.5 Gulf Warehousing 4.57 (1.27) 0.68 268 11.9 1.3 2.2 Qatar Gas Transport (Nakilat) 3.51 (0.03) 6.36 19,446 14.2 2.2 3.1 Tran sportation 29,339 Qatar Exch an ge 723,302
- 7. qnbfs.com Contacts QNB Financial Services Co. W.L.L. Contact Center: (+974) 4476 6666 info@qnbfs.com.qa Doha, Qatar Saugata Sarkar, CFA, CAIA Head of Research saugata.sarkar@qnbfs.com.qa Shahan Keushgerian Senior Research Analyst shahan.keushgerian@qnbfs.com.qa . Disclaimer and Copyright Notice: This publication has been prepared by QNB Financial Services Co. W.L.L. (“QNBFS”) a wholly-owned subsidiary of Qatar National Bank (Q.P.S.C.). QNB FS is regulated by the Qatar Financial Markets Authority and the Qatar Exchange. Qatar National Bank (Q.P.S.C.) is regulated by the Qatar Central Bank. This publication expresses the views and opinions of QNBFS at a given time only. It is not an offer, promotion or recommendation to buy or sell securities or other investments, nor is it intended to constitute legal, tax, accounting, or financial advice. QNBFS accepts no liability whatsoever for any direct or indirect losses arising from use of this report. Any investment decision should depend on the individual circumstances of the investor and be based on specifically engaged investment advice. We therefore strongly advise potential investors to seek independent professional advice before making any investment decision. Although the information in this report has been obtained from sources that QNBFS believes to be reliable, we have not independently verified such information and it may not be accurate or complete. QNBFS does not make any representations or warranties as to the accuracy and completeness of the information it may contain, and declines any liability in that respect. For reports dealing with Technical Analysis, expressed opinions and/or recommendations may be different or contrary to the opinions/recommendations of QNBFS Fundamental Research as a result of depending solely on the historical technical data (price and volume). QNBFS reserves the right to amend the views and opinions expressed in this publication at any time. It may also express viewpoints or make investment decisions that differ significantly from, or even contradict, the views and opinions included in this report. This report may not be reproduced in whole or in part without permission from QNBFS. COPYRIGHT: No part of this document may be reproduced without the explicit written permission of QNBFS. Page 7 of 7