QNBFS Weekly Market Report August 06, 2020
•
0 likes•117 views

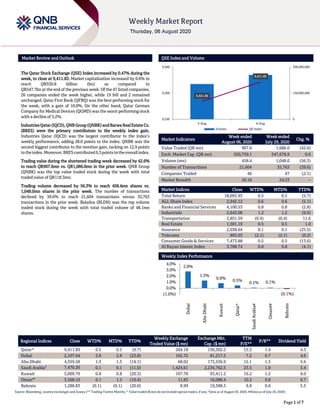
The Qatar Stock Exchange (QSE) Index increased by 0.47% during the week, to close at 9,411.83

Recommended
More Related Content
What's hot
What's hot (20)
Similar to QNBFS Weekly Market Report August 06, 2020
Similar to QNBFS Weekly Market Report August 06, 2020 (20)
More from QNB Group
More from QNB Group (20)
Recently uploaded
Recently uploaded (20)
QNBFS Weekly Market Report August 06, 2020
- 1. ````` Page 1 of 7 Market Review and Outlook QSE Index and Volume The Qatar Stock Exchange (QSE) Index increased by 0.47% during the week, to close at 9,411.83. Market capitalization increased by 0.6% to reach QR550.8 billion (bn) as compared to QR547.7bn at the end of the previous week. Of the 47 listed companies, 26 companies ended the week higher, while 19 fell and 2 remained unchanged. Qatar First Bank (QFBQ) was the best performing stock for the week, with a gain of 10.0%. On the other hand, Qatar German Company for Medical Devices (QGMD) was the worst performing stock with a decline of 5.2%. Industries Qatar(IQCD), QNBGroup(QNBK) andBarwa RealEstate Co. (BRES) were the primary contributors to the weekly index gain. Industries Qatar (IQCD) was the largest contributor to the index’s weekly performance, adding 28.0 points to the index. QNBK was the second biggest contributor to the mention gain, tacking on 12.9 points totheindex.Moreover,BREScontributed6.5pointstotheoverallindex. Trading value during the shortened trading week decreased by 42.6% to reach QR967.6mn vs. QR1,686.0mn in the prior week. QNB Group (QNBK) was the top value traded stock during the week with total traded value of QR118.3mn. Trading volume decreased by 56.3% to reach 458.4mn shares vs. 1,048.0mn shares in the prior week. The number of transactions declined by 39.6% to reach 21,604 transactions versus 35,763 transactions in the prior week. Baladna (BLDN) was the top volume traded stock during the week with total traded volume of 48.1mn shares. Market Indicators Week ended August 06, 2020 Week ended July 29, 2020 Chg. % Value Traded (QR mn) 967.6 1,686.0 (42.6) Exch. Market Cap. (QR mn) 550,759.1 547,678.9 0.6 Volume (mn) 458.4 1,048.0 (56.3) Number of Transactions 21,604 35,763 (39.6) Companies Traded 46 47 (2.1) Market Breadth 26:16 24:23 – Market Indices Close WTD% MTD% YTD% Total Return 18,093.93 0.5 0.5 (5.7) ALL Share Index 2,942.12 0.6 0.6 (5.1) Banks and Financial Services 4,100.53 0.8 0.8 (2.8) Industrials 2,643.08 1.2 1.2 (9.9) Transportation 2,851.59 (0.4) (0.4) 11.6 Real Estate 1,581.19 0.5 0.5 1.0 Insurance 2,038.64 0.1 0.1 (25.5) Telecoms 893.03 (2.1) (2.1) (0.2) Consumer Goods & Services 7,473.88 0.5 0.5 (13.6) Al Rayan Islamic Index 3,788.74 0.8 0.8 (4.1) Weekly Index Performance Regional Indices Close WTD% MTD% YTD% Weekly Exchange Traded Value ($ mn) Exchange Mkt. Cap. ($ mn) TTM P/E** P/B** Dividend Yield Qatar* 9,411.83 0.5 0.5 (9.7) 264.18 150,302.2 15.3 1.4 4.3 Dubai 2,107.64 2.8 2.8 (23.8) 162.72 81,217.5 7.2 0.7 4.6 Abu Dhabi 4,359.58 1.3 1.3 (14.1) 68.02 173,536.9 15.1 1.3 5.6 Saudi Arabia# 7,470.26 0.1 0.1 (11.0) 1,424.61 2,236,762.5 23.5 1.8 3.4 Kuwait 5,009.79 0.8 0.8 (20.3) 167.78 93,411.2 16.2 1.2 4.0 Oman## 3,568.10 0.1 1.5 (10.4) 11.83 16,088.4 10.2 0.8 6.7 Bahrain 1,288.83 (0.1) (0.1) (20.0) 8.99 19,588.5 9.8 0.8 5.5 Source: Bloomberg, country exchanges and Zawya (** Trailing Twelve Months; * Value traded ($ mn) do not include special trades, if any; #Data as of August 05, 2020, ##Data as of July 29, 2020) 9,321.96 9,411.83 0 150,000,000 300,000,000 9,240 9,360 9,480 5-Aug 6-Aug Volume QE Index 2.8% 1.3% 0.8% 0.5% 0.1% 0.1% (0.1%)(1.0%) 0.0% 1.0% 2.0% 3.0% 4.0% Dubai AbuDhabi Kuwait Qatar* SaudiArabia# Oman## Bahrain
- 2. Page 2 of 7 News Economic /Corporate News BLDN records net profit of QR44.2mn corresponding to 22% of revenue in 2Q2020 – Baladna (BLDN) disclosed its interim reviewed financial statements for the period from December 2, 2019, the establishment date, to June 30, 2020 (approximately 7 months). The statements showed a net profit of QR83.9mn, equivalent to 19% of revenue (7 month revenue: QR441.9mn). Earnings per Share (weighted average) amounted to QR0.046. Retained earnings balance on June 30, 2020 is QR74.2mn after distributing the first interim dividend of QR40.0mn in April 2020. These figures confirm the strong financial and commercial performance of the company. In terms of 2Q2020, BLDN recorded net profit of QR44.2mn corresponding to 22% of revenue (2Q2020 revenue: QR205.0mn). Second quarter’s results strengthen by 55% versus first quarter. Despite the challenging external environment, BLDN’s revenue growth is up 13% versus the first quarter. In 2Q2020, EPS stood at QR0.023. BLDN will hold a conference on Investor Relations by telephone to discuss the financial results of the first half 2020, on August 10, 2020 at 12:00pm. (QSE, Peninsula Qatar) AKHI posts 22.1% YoY increase but 67.7% QoQ decline in net profit in 2Q2020 – Al Khaleej Takaful Insurance Company's (AKHI) net profit rose 22.1% YoY (but declined 67.7% on QoQ basis) to QR5.2mn in 2Q2020.The company's ‘Total investment and other income’ came in at QR13.7mn in 2Q2020, which represents a decrease of 10.7% YoY (-45.4% QoQ). EPS amounted to QR0.020 in 2Q2020 as compared to QR0.017 in 2Q2019 (1Q2020: QR0.063). In 1H2020, AKHI posted net profit of QR21.41mn compared to QR18.67mn for the same period of the previous year. EPS amounted to QR0.084 for the period ended June 30, 2020 as compared to QR0.073 for the same period of the previous year. The company has decided to hold the Investor Relations Phone Conference to disclose the financial statements for the period ended on June 30, 2020 on August 12, 2020 at 11:00 pm. (QSE) Brisk activities at Qatari ports point to buoyant maritime sector – Hamad, Doha and Al Ruwais ports have reported brisk activities in July compared to June, indicating normalcy being restored in Qatar’s maritime sector despite COVID-19 challenges. More ships called on these ports and there was a robust month-on-month expansion in the handling of building materials, livestock and automobiles (RORO), while general cargo movement saw a healthy double-digit yearly expansion; indicating the smooth flow of trade, according to performance statistics by Mwani Qatar, which is responsible for managing the nation's sea-ports and shipping terminals. The number of ships calling on these ports stood at 276 in July this year, representing a 15.97% growth on a monthly basis, while it declined 26.79% on a yearly basis. As many as 1,785 ships called on the ports during the first seven months of this year against 2,308 the year-ago period. Hamad Port’s strategic geographical location offers opportunities to create cargo movement towards the upper Gulf, supporting countries such as Kuwait and Iraq, and south towards Oman, QTerminals’ Chief Executive, Neville Bissett had earlier said. A dozen mobile cranes are expected to reach Hamad Port later this month, which comes as part of operationalizing the 403,500 square meters container terminal 2 (CT2) by 4Q2020. The three ports handled 28,980 livestock in July this year, which witnessed a stupendous 46.27% surge on a monthly basis. Nevertheless, it fell 50.27% year-on-year. The three ports had seen a cumulative figure of 334,484 heads during January-July 2020 compared to 483,251 in the corresponding period of 2019. (Gulf-Times.com) AHCS reports net loss of QR62.2mn in 2Q2020, misses our estimates – Aamal Company (AHCS) reported net loss of QR62.2mn in 2Q2020 as compared to net profit of QR85.3mn in 2Q2019 and net profit of QR82.5mn in 1Q2020, missed our QR48.8mn net income estimate. The company's Revenue came in at QR260.0mn in 2Q2020, which represents a decrease of 17.3% YoY (-30.5% QoQ). In 1H2020, AHCS reported net profit of QR20.3mn as compared to QR181.9mn in 1H2019. EPS amounted to QR0.003 in 1H2020 as compared to QR0.03 in 1H2019. In 1H2020, AHCS’ total revenue down 0.3% to QR634.0mn (1H2019: QR636.1mn). Gross profit down 31.6% to QR154.8mn (1H2019: QR226.2mn). Net Profit before fair value loss and share in results of associates and joint ventures accounted for using the equity method amounted to QR65.6mn (1H2019: QR141.2mn). Net loss before share in results of associates and joint ventures accounted for using the equity method (net underlying profit) amounted to QR8.8mn (1H2019: QR141.2mn profit). Net underlying profit margin decreased to - 1.4% (1H2019: 22.2%). Share in results of associates and joint ventures accounted for using the equity method decreased 32.0% to QR28.5mn (1H2019: QR41.9mn). Net capital expenditure up 21.8% to QR25.5mn (1H2019: QR20.9mn). Gearing remains low at 3.4%. AHCS’ Chairman, HE Sheikh Faisal bin Qassim Al Thani said, “To support our valued retail tenants during these hugely challenging times, Aamal approved the waiver of rents for our retail units during the second quarter of 2020. While this decision negatively impacted Aamal’s financial results for the period, we believe that supporting our tenants in this way is the rightthing to do. As we reported in the first quarter, companies in the Trading and Distribution segment have acted swiftly and effectively to support Qatar’s communities during the pandemic, including launching services for the home delivery of medicines. As the pandemic peaked in Qatar during the second quarter, Ebn Sina Medical and Aamal Medical in particular continued to work tirelessly to ensure that customers continued to receive a reliable supply of critical medicines and medical equipment. In addition to enduring the enforced operational suspension of a number of our Managed Services and Trading and Distribution businesses, the impact of the pandemic has exacerbated the intense competition and major project postponements experienced across the Industrial Manufacturing segments in which we operate. In response to these, we have instigated a wide-ranging review of these operations that will better ensure that they perform as efficiently, as effectively and as competitively as possible going forward.” (QNB FS Research, QSE, Company Press Release)
- 3. Page 3 of 7 UDCD's net profit declines 30.1% YoY and 23.2% QoQ in 2Q2020 – United Development Company's (UDCD) net profit declined 30.1% YoY (-23.2% QoQ) to QR37.8mn in 2Q2020.The company's Revenue came in at QR267.4mn in 2Q2020, which represents a decrease of 30.0% YoY (-9.7% QoQ). In 1H2020, UDCD posted net profit of QR86.9mn compared to QR224.6mn for the same period of the previous year. EPS amounted to QR0.025 for the period ended June 30, 2020 to QR0.063 for the same period of the previous year. In spite of the current difficult circumstances, UDCD was able to maintain residential and commercial occupancy rates on The Pearl-Qatar, while carrying out construction works safely at The Pearl-Qatar and Gewan Island and achieving development milestones according to the company’s business plan. UDCD’s strategy was therefore proven effective in weathering the economic repercussions of the pandemic and will ensure its sustainable growth and the creation of new opportunities and revenue sources over the long term. In this context, UDCD continued executing the construction activities in Gewan Island, following the awarding of contracts worth QR1.5bn for the island’s mixed-use buildings, landscape, and infrastructure works. UDCD is with a mission to identify and invest in long-term projects contributing to Qatar’s growth and providing shareholder value. It has an authorized share capital of QR3.5bn and total assets of QR18.4bn as of June 30, 2020. (QSE, Gulf-Times.com)
- 4. Page 4 of 7 Qatar Stock Exchange Top Gainers Top Decliners Source: Qatar Stock Exchange (QSE) Source: Qatar Stock Exchange (QSE) Most Active Shares by Value (QR Million) Most Active Shares by Volume (Million) Source: Qatar Stock Exchange (QSE) Source: Qatar Stock Exchange (QSE) Investor Trading Percentage to Total Value Traded Net Traded Value by Nationality (QR Million) Source: Qatar Stock Exchange (QSE) Source: Qatar Stock Exchange (QSE) 10.0% 9.3% 8.4% 4.5% 3.4% 0.0% 4.0% 8.0% 12.0% Qatar First Bank Baladna Qatari Investors Group Qatar Oman Investment Company Al Khalij Commercial Bank -5.2% -3.9% -2.7% -1.9% -1.7% -7.5% -5.0% -2.5% 0.0% Qatari German Company for Medical Devices Aamal Company Ooredoo Qatar Electricity & Water Company Gulf Warehousing Company 118.3 87.8 64.8 56.2 46.3 0.0 50.0 100.0 150.0 QNB Group Baladna Masraf Al Rayan Qatar First Bank Qatar Navigation 48.1 44.4 38.2 33.4 25.9 0.0 20.0 40.0 60.0 Baladna Qatar Oman Investment Company Qatar First Bank Investment Holding Group Qatar Aluminium Manufacturing Company 0% 20% 40% 60% 80% 100% Buy Sell 37.13% 38.56% 25.41% 16.34% 13.47% 12.93% 23.98% 32.17% Qatari Individuals Qatari Institutions Non-Qatari Individuals Non-Qatari Institutions 605 362 531 436 74 -74 -200 0 200 400 600 800 Qatari Non-Qatari Net Investment Total Sold Total Bought
- 5. Page 5 of 7 TECHNICAL ANALYSIS OF THE QSE INDEX Source: Bloomberg The QSE Index closed flattish, but in the green, gaining only 0.47% from the week before and finished at the 9,411.83 level. The Index bounced off the corrective uptrend channel, but it remains below its 200-day moving average; it should move above that level before the index becomes positive in the medium term. The general index needs to remain above the 9,000 to hold its ground. DEFINITIONS OF KEY TERMS USED IN TECHNICAL ANALYSIS RSI (Relative Strength Index) indicator – RSI is a momentum oscillator that measures the speedand change of price movements. The RSI oscillates between 0 to 100. The index is deemed to be overbought once the RSI approaches the 70 level, indicating that a correction is likely. On the other hand, if the RSI approaches 30, it is an indication that the index may be getting oversold and therefore likely to bounce back. MACD (Moving Average Convergence Divergence) indicator – The indicator consists of the MACD line and a signal line. The divergence or the convergence of the MACD line with the signal line indicates the strength in the momentum during the uptrend or downtrend, as the case may be. When the MACD crosses the signal line from below and trades above it, it gives a positive indication. The reverse is the situation for a bearish trend. Candlestick chart – A candlestick chart is a price chart that displays the high, low, open, and close for a security. The ‘body’ of the chart is portion between the open and close price, while the high and low intraday movements form the ‘shadow’. The candlestick may represent any time frame. We use a one-day candlestick chart (every candlestick represents one trading day) in our analysis. Doji candlestick pattern – A Doji candlestick is formed when a security's open and close are practically equal. The pattern indicates indecisiveness, and based on preceding price actions and future confirmation, may indicate a bullish or bearish trend reversal. ShootingStar/Inverted Hammer candlestick patterns – These candlestick patterns have a small real body (open price and close price are near to each other), and a long upper shadow (large intraday movement on the upside). The Shooting Star is a bearish reversal pattern that forms after a rally. The Inverted Hammer looks exactly like a Shooting Star, but forms after a downtrend. Inverted Hammers represent a potential bullish trend reversal.
- 6. Page 6 of 7 Source: Bloomberg Company Name Price August 06 % Change WTD % Change YTD Market Cap. QR Million TTM P/E P/B Div. Yield Qatar National Bank 18.18 1.00 (11.70) 167,918 14.4 2.4 3.3 Qatar Islamic Bank 16.17 0.43 5.48 38,209 13.5 2.3 3.2 Commercial Bank of Qatar 4.12 (0.19) (12.30) 16,683 9.4 0.9 4.9 Doha Bank 2.43 2.53 (3.95) 7,534 14.4 0.8 N/A Al Ahli Bank 3.30 0.00 (1.00) 8,018 13.1 1.4 4.3 Qatar International Islamic Bank 8.30 1.10 (14.26) 12,564 14.2 2.1 5.1 Masraf Al Rayan 3.94 0.00 (0.56) 29,535 13.5 2.2 5.7 Al Khaliji Bank 1.60 3.35 22.29 5,767 9.6 1.0 4.7 Qatar First Bank 1.48 10.04 80.93 1,036 N/A 2.1 N/A National Leasing 0.91 (0.11) 28.37 448 16.7 0.7 5.5 Dlala Holding 1.97 2.93 221.93 559 N/A 3.0 N/A Qatar & Oman Investment 0.88 4.53 30.94 276 38.7 1.0 2.3 Islamic Holding Group 3.96 2.51 108.58 224 73.2 1.6 N/A Banking and Financial Services 288,771 Zad Holding 15.10 0.67 9.26 3,579 17.4 2.3 5.6 Qatar German Co. for Medical Devices 2.25 (5.19) 285.74 259 N/A 9.2 N/A Salam International Investment 0.46 0.66 (11.41) 524 N/A 0.5 N/A Baladna 1.88 9.30 88.00 3,574 N/A 1.6 1.1 Medicare Group 7.56 3.01 (10.53) 2,128 29.3 2.2 23.8 Qatar Cinema & Film Distribution 3.31 0.00 50.45 208 46.2 0.2 3.0 Qatar Fuel 16.10 0.00 (29.69) 16,008 17.0 2.0 5.0 Qatar Meat and Livestock 6.75 (0.30) (0.15) 1,215 14.2 3.5 4.4 Mannai Corp. 2.86 1.78 (7.14) 1,305 10.0 0.5 7.0 Al Meera Consumer Goods 19.48 1.72 27.32 3,896 20.3 3.1 4.4 Consumer Goods and Services 32,694 Qatar Industrial Manufacturing 2.72 0.63 (23.78) 1,293 13.8 0.8 5.5 Qatar National Cement 3.73 1.52 (33.96) 2,438 17.7 0.8 8.0 Industries Qatar 8.05 2.94 (21.69) 48,703 30.9 1.5 5.0 Qatari Investors Group 2.38 8.45 32.68 2,953 29.2 1.1 2.3 Qatar Electricity and Water 16.58 (1.89) 3.05 18,238 12.5 2.1 4.7 Aamal 0.74 (3.90) (9.10) 4,656 29.1 0.6 5.4 Gulf International Services 1.69 0.00 (2.03) 3,131 113.0 0.9 N/A Mesaieed Petrochemical Holding 2.08 (0.24) (17.13) 26,131 26.9 1.8 3.4 Invesment Holding Group 0.52 1.77 (8.33) 429 8.7 0.5 N/A Qatar Aluminum Manufacturing 0.86 2.25 10.63 4,821 N/A 0.8 1.2 Industrials 112,793 Qatar Insurance 2.01 (0.10) (36.39) 6,565 N/A 0.9 7.5 Doha Insurance 1.05 1.84 (12.17) 527 11.3 0.5 7.6 Qatar General Insurance & Reinsurance 2.20 (0.81) (10.57) 1,925 N/A 0.4 N/A Al Khaleej Takaful Insurance 1.88 2.45 (6.05) 480 14.8 1.0 2.7 Qatar Islamic Insurance 6.30 1.55 (5.73) 945 13.9 2.6 6.0 Insurance 10,441 United Development 1.16 (1.03) (23.95) 4,093 18.2 0.4 4.3 Barw a Real Estate 3.24 2.27 (8.56) 12,596 7.9 0.6 6.2 Ezdan Real Estate 1.40 (1.41) 127.64 37,135 3899.7 1.2 N/A Mazaya Qatar Real Estate Development 0.86 (1.60) 19.89 998 35.2 0.8 N/A Real Estate 54,822 Ooredoo 6.52 (2.67) (7.90) 20,888 12.5 0.9 3.8 Vodafone Qatar 1.25 (0.40) 7.76 5,284 36.4 1.2 4.0 Telecoms 26,172 Qatar Navigation (Milaha) 5.81 (0.87) (4.77) 6,653 12.4 0.5 5.2 Gulf Warehousing 4.95 (1.67) (9.69) 290 12.2 1.6 4.0 Qatar Gas Transport (Nakilat) 2.80 0.04 17.15 15,513 14.5 2.6 3.6 Transportation 22,456 Qatar Exchange 550,759
- 7. Contacts Saugata Sarkar, CFA, CAIA Shahan Keushgerian Zaid al-Nafoosi , CMT, CFTe Head of Research Senior Research Analyst Senior Research Analyst Tel: (+974) 4476 6534 Tel: (+974) 4476 6509 Tel: (+974) 4476 6535 saugata.sarkar@qnbfs.com.qa shahan.keushgerian@qnbfs.com.qa zaid.alnafoosi@qnbfs.com.qa Mehmet Aksoy, PhD QNB Financial Services Co. W.L.L. Senior Research Analyst Contact Center: (+974) 4476 6666 Tel: (+974) 4476 6589 PO Box 24025 mehmet.aksoy@qnbfs.com.qa Doha, Qatar Disclaimer and Copyright Notice: This publication has been prepared by QNB Financial Services Co. W.L.L. (“QNB FS”) a wholly-owned subsidiary of Qatar National Bank (Q.P.S.C.). QNB FS is regulated by the Qatar Financial Markets Authority and the Qatar Exchange. Qatar National Bank (Q.P.S.C.) is regulated by the Qatar Central Bank. This publication expresses the views and opinions of QNB FS at a given time only. It is not an offer, promotion or recommendation to buy or sell securities or other investments, nor is it intended to constitute legal, tax, accounting, or financial advice. QNB FS accepts no liability whatsoever for any direct or indirect losses arising from use of this report. Any investment decision should depend on the individual circumstances of the investor and be based on specifically engaged investment advice. We therefore strongly advise potential investors to seek independent professional advice before making any investment decision. Although the information in this report has been obtained from sources that QNB FS believes to be reliable, we have not independently verified such information and it may not be accurate or complete. QNB FS does not make any representations or warranties as to the accuracy and completeness of the information it may contain, and declines any liability in that respect. For reports dealing with Technical Analysis, expressed opinions and/or recommendations may be different or contrary to the opinions/recommendations of QNB FS Fundamental Research as a result of depending solely on the historical technical data (price and volume). QNB FS reserves the right to amend the views and opinions expressed in this publication at any time. It may also express viewpoints or make investment decisions that differ significantly from, or even contradict, the views and opinions included in this report. This report may not be reproduced in whole or in part without permission from QNB FS COPYRIGHT: No part of this document may be reproduced without the explicit written permission of QNB FS. Page 7 of 7