SlideShare a Scribd company logo
1 of 8
Download to read offline
qnbfs.com
Page 1 of 8
Weekly MarketReport
Thursday,10 August 2023
Regional Indices Close WTD% MTD% YTD%
Weekly Exchange
Traded Value ($ mn)
Exchange Mkt.
Cap. ($ mn)
TTM P/E** P/B** Dividend Yield
Qatar* 10,735.63 (0.6) (2.1) 0.5 486.10 172,804.0 13.4 1.4 4.6
Dubai 4,048.85 (0.1) (0.3) 21.4 449.21 187,245.4 9.3 1.3 4.4
Abu Dhabi 9,904.25 1.2 1.2 (3.0) 1,428.71 754,704.3 33.0 3.1 1.7
Saudi Arabia# 11,286.21 (0.8) (3.5) 7.7 7,453.00 2,945,907.8 17.9 2.2 3.2
Kuwait 7,147.93 0.0 (1.5) (2.0) 676.98 149,106.1 17.6 1.5 3.7
Oman 4,757.21 (0.5) (0.4) (2.1) 25.48 23,246.6 13.0 0.9 4.6
Bahrain 1,972.27 (0.5) (1.0) 4.1 27.79 57,156.6 8.0 0.7 7.7
Source: Bloomberg, country exchanges and Zawya (** Trailing Twelve Months; * Value traded ($ mn) do not include special trades, if any; #Data as of August 09, 2023)
Market Review and Outlook QSE Index and Volume
The Qatar Stock Exchange (QSE) Index edged lower by 63.35
points or 0.6% during the week to close at 10,735.63. Market
capitalization declined 1.1% to QR630.2 billion (bn) compared
with QR637.4bn at the end of the previous trading week. Of the
50 traded companies, 32 ended the week lower and 17 ended
higher, while one was unchanged. Qatar Cinema & Film
Distributing (QCFS) was the worst performing stock for the
week,dipping 5.9%. Meanwhile,DlalaBrokerage& Investment
Holding (DBIS) was the best performing stock for the week, up
14.8%.
QNB Group (QNBK), Industries Qatar (IQCD) and Qatar Gas
Transport Company Ltd (QGTS) were the primary contributors
to the weekly index loss. QNBK and IQCD removed 41.68 and
21.22 points from the index, respectively. Further, QGTS
subtracted another 9.51 points.
Traded value during the week declined 24.1% to QR1,761.2mn
from QR2,319.2mn in the prior trading week. Industries Qatar
(IQCD) was the top value traded stock during the week with
total traded value of QR194.3mn.
Traded volume dropped 28.0% to 652.9mn shares compared
with 906.5mn shares in the prior trading week. The number of
transactions moved lower by 13.1% to 70,680 vs 81,347 in the
prior week. Qatar Aluminum Manufacturing Company (QAMC)
was the top volume traded stock during the week with total
traded volume of 99.8mn shares.
Foreign institutions turned bearish, ending the week with net
selling of QR20.3mn vs. net buying of QR215.5mn in the prior
week. Qatari institutions turned bullish with net buying of
QR30.3mn vs. net selling of QR92.5mn in the week before.
Foreign retail investors ended the week with net selling of
QR18.2mn vs. net selling of QR36.5mn in the prior week. Qatari
retail investors recorded net buying of QR8.2mn vs. net selling
of QR86.4mn the week before. YTD (as of Today’s closing),
global foreign institutions were net short $73.3mn, while GCC
institutions were net buyers of Qatari stocks by $683.6mn.
Market Indicators
Week ended.
August 10, 2023
Week ended.
August 03, 2023
Chg. %
Value Traded (QR mn) 1,761.2 2,319.2 (24.1)
Exch. Market Cap. (QR mn) 630,211.7 637,421.2 (1.1)
Volume (mn) 652.9 906.5 (28.0)
Number of Transactions 70,680 81,347 (13.1)
Companies Traded 50 50 0.0
Market Breadth 17:32 10:35 –
Market Indices Close WTD% MTD% YTD%
Total Return 23,040.16 (0.6) (2.1) 5.3
ALL Share Index 3,605.57 (0.8) (2.1) 5.6
Banks and Financial
Services
4,492.08 (0.5) (2.5) 2.4
Industrials 4,130.13 (1.0) 0.3 9.2
Transportation 4,630.18 (1.7) (5.5) 6.8
Real Estate 1,583.59 (1.9) (2.9) 1.5
Insurance 2,322.74 (1.3) (2.3) 6.2
Telecoms 1,666.57 (2.1) (2.9) 26.4
Consumer Goods & Services 7,829.02 (0.3) (1.7) (1.1)
Al Rayan Islamic Index 4,729.71 (0.5) (1.9) 3.0
Weekly Index Performance
10,820.82
10,803.54
10,686.03
10,716.45
10,735.63
0
100,000,000
200,000,000
10,500
10,750
11,000
6-Aug 7-Aug 8-Aug 9-Aug 10-Aug
Volume QE Index
1.2%
0.0%
(0.1%)
(0.5%) (0.5%) (0.6%) (0.8%)
(1.0%)
0.0%
1.0%
2.0%
Abu
Dhabi
Kuwait
Dubai
Bahrain
Oman
Qatar*
Saudi
Arabia#
qnbfs.com
Page 2 of 8
Economic, Market & Company News
 QFC PMI: Qatar’s non-energy sector witnesses a rosy start in second
half - Qatar’s non-energy sector witnessed a rosy start in the second
half of 2023 with output, new orders, employment and purchasing
witnessing expansion, according to Qatar Financial Centre (QFC).
The latest Purchasing Managers’ Index (PMI) survey data from the
QFC said backlogged work continued to fall, albeit less so than in the
first half of the year, while inflationary pressures eased. The Qatar
PMI indices are compiled from survey responses from a panel of
around 450 private sector companies. The panel covers the
manufacturing, construction, wholesale, retail, and services sectors,
and reflects the structure of the non-energy economy according to
official national accounts data. The headline PMI – a composite
single-figure indicator of non-energy private sector performance
that is derived from indicators for new orders, output, employment,
suppliers’ delivery times and stocks of purchases – posted 54 in July,
up slightly from 53.8 in June, indicating another strong improvement
in business conditions. The latest figure was a superior outcome
relative to the first half of 2023 (52.5) and remained well above the
long-run trend of 52.3. “Qatar PMI data continued to point to an
expansion of the non-energy private sector as we enter the second
half of 2023. The latest headline figure of 54.0 is well above the long-
run survey average as total business activity and demand both rose
strongly in July," said Yousuf Mohamed al-Jaida, chief executive
officer, QFC Authority. Companies also stepped up hiring as a slower
fall in outstanding work hinted at returning pressure on business
capacity, according to him. Total business activity among Qatari
non-energy private sector firms rose further in July. Output has risen
every month for more than three years, except for a brief correction
in January following the conclusion of the FIFA World Cup Qatar
2022. The rate of expansion accelerated since June and was the
second strongest of 2023 so far. "The 12-month outlook for the non-
energy private sector remained optimistic in July. Higher expected
business volumes were linked to new sales strategies, new hires,
tourism and new products," it said, adding positive expectations
remained broad-based by sector with service providers being the
most optimistic, followed by goods producers. July data signaled
another increase in non-oil private sector employment and at the
fastest rate since July 2022. Recruitment was aimed both at new
workloads and efforts to clear backlogs, which were reduced for the
twelfth successive month. Supply chains continued to improve as
average lead times fell for the fifteenth successive month, a series-
record sequence. Input inventories rose only slightly, suggesting
companies managed stock levels well during the month. Price
pressures eased in July, as the overall input prices index fell since
June and was at a level indicative of a marginal rate of inflation.
Meanwhile, output prices fell for the third month running, albeit only
marginally. Qatar's financial services sector continued to expand
markedly at the start of the second half of 2023. Growth in new
business remained sharp, leading to another strong rise in total
activity. The outlook brightened since June and employment in the
sector rose at the strongest rate in over a year. "Financial services
remains a strong point for the economy, with the key indices for
activity and new business both remaining elevated in July, while
employment in the sector rose at the strongest rate in over a year,"
al-Jaida said. (Gulf Times)
 IQCD's net profit declines 66.2% YoY and 20.9% QoQ in 2Q2023,
misses our estimate - Industries Qatar's (IQCD) net profit declined
66.2% YoY (-20.9% QoQ) to QR922.2mn in 2Q2023, missing our
estimate of QR987.5mn (variation of -6.6%). The company's revenue
came in at QR2,634.6mn in 2Q2023, which represents a decrease of
48.7% YoY (-24.0% QoQ). EPS amounted to QR0.35 in 6M2023 as
compared to QR0.90 in 6M2022. (QNBFS, QSE)
 QEWS posts 24.3% YoY increase but 8.2% QoQ decline in net profit
in 2Q2023, misses our estimate - Qatar Electricity & Water
Company's (QEWS) net profit rose 24.3% YoY (but declined 8.2% on
QoQ basis) to QR367.9mn in 2Q2023, missing our estimate of
QR414.9mn (variation of -11.3%). The company's revenue came in at
QR702.0mn in 2Q2023, which represents an increase of 13.6% YoY
(+9.9% QoQ). EPS amounted to QR0.33 in 2Q2023 as compared to
QR0.27 in 2Q2022. (QNBFS, QSE)
 QNNS posts 1.4% YoY increase but 21.7% QoQ decline in net profit
in 2Q2023, beating our estimate - Qatar Navigation's (QNNS) net
profit rose 1.4% YoY (but declined 21.7% on QoQ basis) to
QR284.4mn in 2Q2023, beating our estimate of QR263.7mn
(variation of +7.8%). The company's operating revenue came in at
QR744.6mn in 2Q2023, which represents a decrease of 13.5% YoY (-
2.8% QoQ). EPS amounted to QR0.57 in 6M2023 as compared to
QR0.56 in 6M2022. (QNBFS, QSE)
 IGRD's net profit declines 2.3% YoY and 2.8% QoQ in 2Q2023,
beating our estimate - Estithmar Holding's (IGRD) net profit declined
2.3% YoY (-2.8% QoQ) to QR98.4mn in 2Q2023, beating our estimate
of QR45.1mn. The company's revenue came in at QR717.4mn in
2Q2023, which represents a decrease of 28.7% YoY (-6.4% QoQ). EPS
amounted to QR0.029 in 2Q2023 as compared to QR0.034 in 2Q2022.
(QNBFS, QSE)
 BLDN's bottom line rises 2.7% YoY and 11.3% QoQ in 2Q2023 -
Baladna's (BLDN) net profit rose 2.7% YoY (+11.3% QoQ) to
QR22.3mn in 2Q2023. The company's revenue came in at QR262.2mn
in 2Q2023, which represents an increase of 7.2% YoY (+3.1% QoQ).
EPS amounted to QR0.012 in 2Q2023 as compared to QR0.011 in
2Q2022. (QSE)
 MPHC posts 46.9% YoY decrease but 17.7% QoQ increase in net
profit in 2Q2023 - Mesaieed Petrochemical Holding Company's
(MPHC) net profit declined 46.9% YoY (but rose 17.7% on QoQ basis)
to QR316.2mn in 2Q2023. The company's share of results from joint
ventures came in at QR291.1mn in 2Q2023, which represents a
decrease of 50.3% YoY. However, on QoQ basis Share of results from
joint ventures rose 20.3%. EPS amounted to QR0.047 in 6M2023 as
compared to QR0.083 in 6M2023. (QSE)
 QFBQ's bottom line rises 7.5% YoY and 2.2% QoQ in 2Q2023 - Qatar
First Bank's (QFBQ) net profit rose 7.5% YoY (+2.2% QoQ) to
QR22.6mn in 2Q2023. Total Income increased 108.0% YoY in 2Q2023
to QR40.7mn. However, on QoQ basis total income declined 19.3%.
The bank's total assets stood at QR5.1bn at the end of June 30, 2023,
up 13.6% YoY (+1.9% QoQ). Financing Assets were QR0.1bn,
registering a 73.8% decline YoY (-60.7% QoQ) at the end of June 30,
2023. Financing liabilities rose 33.9% YoY to reach QR0.6bn at the
end of June 30, 2023. However, on QoQ basis financing liabilities fell
1.5%. EPS amounted to QR0.020 in 2Q2023 as compared to QR0.021
in 2Q2023. (QNBFS, QSE)
 SIIS reports net loss of QR2.4mn in 2Q2023 - Salam International
Investment Limited (SIIS) reported net loss of QR2.4mn in 2Q2023 as
compared to net profit of QR15.9mn in 2Q2022 and net profit of
qnbfs.com
Page 3 of 8
QR6.9mn in 1Q2023. EPS amounted to QR0.004 in 6M2023 as
compared to QR0.022 in 6M2022. (QSE)
 QE Index ETF discloses its financial statements as at and for the
period from 01 January 2023 to 30 June 2023 - QE Index ETF disclosed
its financial statements as at and for the period ending 30 June 2023.
The statements show that the net asset value as of 30 June 2023
amounted to QR397,858,970 representing QR9.772 per unit. In
addition, QE Index ETF distributed dividends during the second
quarter of 2023. (QSE)
 QIGD posts 25.3% YoY increase but 13.5% QoQ decline in net profit
in 2Q2023 - Qatari Investors Group 's (QIGD) net profit rose 25.3%
YoY (but declined 13.5% on QoQ basis) to QR47.1mn in 2Q2023. The
company's revenue came in at QR132.9mn in 2Q2023, which
represents a decrease of 26.1% YoY (-1.3% QoQ). EPS amounted to
QR0.08 in 6M2023 as compared to QR0.10 in 6M2022. (QSE)
 QISI's bottom line rises 36.3% YoY and 19.2% QoQ in 2Q2023 - Qatar
Islamic Insurance Company's (QISI) net profit rose 36.3% YoY
(+19.2% QoQ) to QR34.9mn in 2Q2023. The company's total
revenues came in at QR51.4mn in 2Q2023, which represents an
increase of 28.8% YoY (+1.1% QoQ). EPS amounted to QR0.23 in
2Q2023 as compared to QR0.17 in 2Q2022. (QSE)
 BEMA's bottom line rises 7.3% YoY and 43.9% QoQ in 2Q2023 -
Damaan Islamic Insurance Company's (BEMA) net profit rose 7.3%
YoY (+43.9% QoQ) to QR19.7mn in 2Q2023. The company's total
income came in at QR33.5mn in 2Q2023, which represents an
increase of 13.3% YoY (+21.8% QoQ). EPS amounted to QR 0.167 in
6M2023 as compared to QR0.160 in 6M2022. (QSE)
 DBIS reports net loss of QR0.5mn in 2Q2023 - Dlala Brokerage and
Investments Holding Co. (DBIS) reported net loss of QR0.5mn in
2Q2023 as compared to net loss of QR13.3mn in 2Q2022 and
QR2.4mn in 1Q2023. The company's net brokerage commission
income came in at QR2.3mn in 2Q2023, which represents a decrease
of 36.6% YoY (-5.3% QoQ). The loss per share amounted to QR0.015
in 6M2023 as compared to 0.018 in 6M2022. (QSE)
 Mekdam Holding Group: Successful Subscription rate that exceeded
97.85% - Mekdam Holding Group announced the end of the
subscription period, which extended from Tuesday 25-07-2023 to
Monday 07-08-2023. The subscription rate at Arab Bank exceeded
97.85% of the offered shares. The Board of Directors expressed their
thanks and appreciation to the honorable shareholders for their
confidence in Mekdam Holding Group. Mekdam Holding Group shall
take the necessary procedures to complete the subscription process
of unsubscribed shares in accordance with the mechanism approved
by the Qatar Financial Markets Authority (QFMA) and as per the
authority provided to the Board of Directors by the EGM on 11 June
2023. (QSE)
 Mekdam Holding Group: Sale of unsubscribed shares - In connection
with rights issue process, where the number of subscribed shares
amounted to 29,357,101 while the number of unsubscribed shares
amounted to 642,899 shares; Mekdam Holding Group hereby
announces that it will commence the sale of unsubscribed shares
through the Qatar Stock Exchange from 14-08-2023 to 27-08-2023.
(QSE)
 Oxford Economics: Qatar’s current account surplus to remain in
double digits this year and next - Qatar’s current account surplus will
remain in double digits this year and in 2024, Oxford Economics said
in its latest country update. The surplus widened to over 26% of GDP
in 2022, Oxford Economics noted. Oxford Economics expects Qatar's
overall GDP to grow by 2.6% this year and next. Non-oil activity is
continuing to rise according to the purchasing managers' index (PMI)
survey, ending the second quarter (Q2) strongly at 53.8 in June.
Robust demand has been a key driver of the recovery in output and
employment and has kept businesses optimistic, particularly in the
manufacturing and services sectors. “We expect non-oil GDP growth
to soften somewhat, slowing from 3.3% this year to 3.2% in 2024,”
Oxford Economics said. The latest industrial output data show the
mining sector's performance continues to improve, albeit at a slower
pace of just 0.8% year-on-year (y-o-y) in May. The trend is
“consistent” with Oxford Economics’ energy GDP growth outlook,
which the researcher thinks will ease to 1.3% this year, from 1.7% in
2022. “Still, the North Field gas expansion project is driving a more
positive medium-term outlook for the sector,” Oxford Economics
noted. Budget data for the first quarter (Q1) showed revenues rose
5.5% compared to the same quarter last year, driven by energy
income. Meanwhile, spending fell 4.9% y-o-y amid reduced capital
and project spending, which widened the quarterly budget surplus to
QR19.7bn. Notwithstanding lower global commodity prices, Oxford
Economics anticipates a full year budget surplus of 9.2% of GDP this
year, before it narrows to 8.4% in 2024. Inflation moderated to a two-
year low of 2.5% y-o-y in June, dragging down the Q2 average to 3%,
from 4.2% in Q1. Disinflation continued across most categories, but
food and recreation and culture prices climbed, driving a 0.1%
month-on-month (m-o-m) increase in the headline rate. “We expect
inflation to ease further in the next few months and briefly turn
negative in Q4. We have hardly changed our 2023 forecast, now at
2.2%, and expect inflation to average 1.9% next year,” Oxford
Economics said. Qatar's central bank raised interest rates by 25bps in
July, mirroring the move by the US Fed. This, it said, is likely to be
the final hike of this cycle given that both inflation and demand are
cooling, though further tightening is still a potential. Moreover, the
shift to rate cuts will likely be delayed well into 2024, with policy
easing only gradually, Oxford Economics added. (Gulf Times)
 Qatar Investment Authority picks up 2.7% in Adani Green - Qatar
Investment Authority (QIA) on Monday picked up a 2.7% stake in
Adani Green Energy (AGEL) in a block deal worth Rs3,920 crore
($474mn), nearly a month after the renewable energy firm raised
funds from GQG Partners and other investors. The move is a sign of
investor confidence in Adani Group companies, after a report by
Hindenburg Research in January resulted in the conglomerate losing
nearly half of its market capitalization. QIA, a sovereign wealth fund
of Qatar, bought 42.6mn shares in a bulk deal at an average of Rs920
a share. The shares were acquired through its wholly owned
subsidiary INQ Holding, while Infinite Trade and Investment, a
promoter entity of AGEL, was the seller, according to stock exchange
data. AGEL's promoter entity sold 44.88mn shares, amounting to a
2.83% stake, at Rs920.43 a share. This amounted to Rs4,131 crore
($500mn). After the bulk deal, Infinite Trade and Investment's
holding fell to 0.57% from 3.37%. As of June 30, the total promoter
holding in AGEL was at 56.27%. Shares of Adani Green fell 12.5%
during intra-day trade on Monday and closed down 4.69% at
Rs965.05 on the BSE. AGEL, the renewable energy arm of Adani
Group, had an operational capacity of 8,316 MW as of June-end. This
was following the addition of 1,750 MW solar-wind hybrid, 212 MW
solar and 554 MW wind power plants over the last one year. The
company aims to build 45 GW (45,000 MW) of capacity by FY30. This
is the second investment by QIA in an Adani Group company. In
2020, Adani Transmission (now Adani Energy Solutions) raised
Rs3,220 crore in lieu of a 25.10% stake in Adani Electricity Mumbai.
In July, the Adani family raised $1.38bn (Rs11,330 crore) through
stake sales in three portfolio companies: AGEL, Adani Enterprises
qnbfs.com
Page 4 of 8
and Adani Transmission. The fundraise was to ensure higher capital
availability at the group level, which was to be used for growth and
near-term commitments, including debt, over the next 12-18
months. In June, US investment firm GQG Partners and other
investors bought shares worth Rs11,000 crore in the three companies
through block deals, mainly from Adani group family firms. Prior to
that, in March, GQG acquired stakes worth Rs15,446 crore in four
Adani group companies, and later in May it purchased further shares
worth $400-500mn. (Bloomberg)
 Qatar's single window committee for capital market to ease and
streamline listings - The proposed single window committee is
expected to ease and streamline the listing process in the Qatar’s
capital market, leading the country’s bourse to see brisk activities on
an expected faster approval of listings and instruments in the future,
according to experts. "As the name suggests, there is no need to apply
in various authorities. This, in itself, will cut down the time taken for
the approval. The (opportunity) cost (towards listing) also comes
down in the process," an analystwith a leading brokerage house said.
Early last month, the Qatar Financial Markets Authority (QFMA)
issued a resolution to establish a "Single Window Committee for the
Capital Market" with the goal of reducing time and effort and
significantly simplifying procedures for companies whose activities
are related to the financial markets in the country. “The move makes
it easier for the issuers to process their applications,” he said, adding
the stage is set for smooth and speedier initial public offerings (IPOs)
and follow-on issues as well as other instruments such as exchange
traded funds and derivatives. According to Dr Tami bin Ahmed al-
Binali, QFMA chief executive officer, the establishment of a "Single
Window Committee for the Capital Market" represents an important
step forward as it will facilitate and simplify procedures for
companies active in the country's financial market. The 11-member
Committee will have five members from the QFMA, four from the
Qatar Stock Exchange (QSE), and each from the Ministry of
Commerce and Industry and Edaa (formerly Qatar Central Securities
Depository Company). Among the other advantages provided by the
'one-stop-shop window for the capital market' for these companies is
having streamlined and smooth processes for the public offering and
listing of securities on QSE, whether upon their incorporation,
conversion to a joint stock company, direct listing, or entry into any
acquisitions or mergers. The listing process would speed up because
the due diligence and other legwork start at least a year before the
(actual) listing, market sources said. Since (multiple) authorities
concerned are in the committee, the chance of delay at each step
comes down as the new single window system will be the nodal
point, which will vet the applications based on the broad guidelines
set by the QFMA, according to the sources. The proposed single
window committee comes amid reports of more listings expected,
considering that the procedural reforms as direct listing and book-
building mechanism ought to attract more companies. Having put in
place a new trading mechanism, the Qatari bourse is all set to move
into a T+2 settlement cycle compared to T+3. The initiative is in line
with international best practices in regional and international
markets, to achieve efficiency, and reduce the risks of a long
settlement period. (Gulf Times)
 QSE witnesses best monthly returns in GCC during July - GCC equity
markets reported growth for the second consecutive month during
July 2023 in line with the growthin most other global equity markets.
The aggregate MSCI GCC index was up 3.3% during the month
reflecting positive performance in all the GCC equity markets in July
2023. According to GCC markets monthly report by Kamco Invest,
Qatar was the best performing market during the month registering
a gain of 8.8% followed by Dubai and Kuwait benchmarks with
monthly gains of 7% and 3.2% respectively. Qatar Stock Exchange
(QSE) witnessed the best monthly returns in the GCC during July
2023 with the QE 20 index gaining 8.8% during the month. Notably,
these gains came after five consecutive months of declines this year.
The Qatar All Share Index witnessed a gain of 8.4% during the month
indicating investor interest across the market segments. With the
gains in July 2023 the YTD-2023 growth for the QE 20 index reached
2.6% while the Qatar All Share Index registered a higher growth
6.7% at the end of July, 2023. The sector performance chart also
reflected solid gains with all the sectors in the green. The industrials
index topped during the month with a gain of 11.7% closely followed
by banks and financials services and real estate indices with gains of
10.1% and 8.4% respectively. The report noted that the gains for
industrial index was mainly led by the shares of Industries Qatar
which was up 18.7% followed by 14% gain in shares of Gulf
International Services. Most of the constituents in the banks and
financial services sector witnessed gains with shares of Qatar
Islamic Bank up by 19.4% followed by Doha Bank with a gain of 12.
4%. In the real estate sector shares of Mazaya Real Estate
Development gained 11.6% during the month. In first half (H1), 2023
earning releases, QNB reported net profit of QR7.6bn in the H1, 2023
up from QR7bn in H1, 2022, driven by higher net interest income.
Qatar Islamic Bank (QIBK) posted a net profit of QR1.95bn for H1,
2023, representing a growth of 7.7% over the same period in 2022.
The banks’s income from financing and investing activities
registered a growth of 26.3% to reach QR4.75bn for the first half of
2023 compared to QR3.76bn for the same period of 2022. Similarly,
the Commercial Bank of Qatar reported a net profit of QR1.55bn for
H1, 2023 compared to a net profit of QR1.43bn in H1, 2022 up by
8.5%. The monthly stock performance chart was topped with Widam
Food Company with a gain of 34. 4% followed by the Qatar Oman for
Investment and Qatar Islamic Bank with gains of 24.7% and 19.4%
respectively. On the decliners side, Qatar General and Reinsurance
topped with a decline of 12.3% followed by Zad Holding and Dlala
Brokerage and Investment Holding with declines of 2.9% and 2.7%
respectively, the report added. In terms of the trading activity, the
report further stated that the total volume of shares traded during
the month increased by 20.7% to 4.1bn shares. Value traded also
increased by 7.5% to reach QR9.9bn during July, 2023. Mazaya Real
Estate Development topped the monthly volume traded chart with
517.1mn traded shares followed by Qatar Aluminum Manufacturing
Company and Salam Inter-national Investment at 394.6mn shares
and 287.1mn shares, respectively. On the value traded chart, Qatar
National Bank topped with QR1.11bn worth of trades during the
month followed by Industries Qatar and Masraf Al Rayan at QR683m
and QR651.4m respectively. (Peninsula Qatar)
qnbfs.com
Page 5 of 8
Qatar Stock Exchange
Top Gainers Top Decliners
Source: Qatar Stock Exchange (QSE) Source: Qatar Stock Exchange (QSE)
Most Active Shares by Value (QR Million) Most Active Shares by Volume (Million)
Source: Qatar Stock Exchange (QSE) Source: Qatar Stock Exchange (QSE)
Investor Trading Percentage to Total Value Traded Net Traded Value by Nationality (QR Million)
Source: Qatar Stock Exchange (QSE) Source: Qatar Stock Exchange (QSE)
14.8%
4.1%
2.8% 2.4% 2.4%
0.0%
6.0%
12.0%
18.0%
Dlala
Brokerage &
Investment
Holding
Company
Damaan
Islamic
Insurance
Company
Qatar Islamic
Bank
Qatar Industrial
Manufacturing
Company
Inma Holding
-5.9%
-4.5%
-4.2% -3.9% -3.8%
-9.0%
-6.0%
-3.0%
0.0%
Qatar Cinema
& Film
Distribution
Company
QLM Life &
Medical
Insurance
Company
Salam
International
Investment
Limited
Qatar
Aluminium
Manufacturing
Company
Barwa Real
Estate
Company
194.3 192.3 188.0
133.0
110.8
0.0
80.0
160.0
240.0
Industries
Qatar
Dukhan Bank QNB Group Qatar
Aluminium
Manufacturing
Company
Masraf Al
Rayan
99.8
58.4
45.8 44.3 42.3
0.0
40.0
80.0
120.0
Qatar
Aluminium
Manufacturing
Company
Mazaya Qatar
Real Estate
Development
Dukhan Bank Masraf Al
Rayan
Dlala
Brokerage &
Investment
Holding
Company
0%
20%
40%
60%
80%
100%
Buy Sell
32.22% 31.63%
29.75% 28.03%
13.00% 14.16%
25.02% 26.17%
Qatari Individuals Qatari Institutions
Non-Qatari Individuals Non-Qatari Institutions
1,091
670
1,051
710
41
-41
-500 0 500 1,000 1,500
Qatari
Non-Qatari
Net Investment Total Sold Total Bought
qnbfs.com
Page 6 of 8
TECHNICAL ANALYSIS OF THE QSE INDEX
Source: Bloomberg
The QE index closed mostly flat for the week (-0.59% from the week before); it closed at 10,735.6 points. Our thesis has not changed, the
recent double-bottom formation (a bullish-reversal price pattern) being tested and we expect the Index to be hovering around the
formation’s neckline (around the current levels). A bounce from the current levels means an uptrend will most likely unfold. Our weekly
levels of resistance are around the 11,750 level and the support at the 10,000 level.
DEFINITIONS OF KEY TERMS USED IN TECHNICAL ANALYSIS
RSI (Relative Strength Index) indicator – RSI is a momentum oscillator that measures the speedand change of price movements. The RSI oscillates between
0 to 100. The index is deemed to be overbought once the RSI approaches the 70 level, indicating that a correction is likely. On the other hand, if the RSI
approaches 30, it is an indication that the index may be getting oversold and therefore likely to bounce back.
MACD (Moving Average Convergence Divergence) indicator – The indicator consists of the MACD line and a signal line. The divergence or the convergence
of the MACD line with the signal line indicates the strength in the momentum during the uptrend or downtrend, as the case may be. When the MACD
crosses the signal line from below and trades above it, it gives a positive indication. The reverse is the situation for a bearish trend.
Candlestick chart – A candlestick chart is a price chart that displays the high, low, open, and close for a security. The ‘body’ of the chart is portion between
the open and close price, while the high and low intraday movements form the ‘shadow’. The candlestick may represent any time frame. We use a one-day
candlestick chart (every candlestick represents one trading day) in our analysis.
Doji candlestick pattern – A Doji candlestick is formed when a security's open and close are practically equal. The pattern indicates indecisiveness, and
based on preceding price actions and future confirmation, may indicate a bullish or bearish trend reversal.
ShootingStar/Inverted Hammer candlestick patterns – These candlestick patterns have a small real body (open price and close price are near to each other),
and a long upper shadow (large intraday movement on the upside). The Shooting Star is a bearish reversal pattern that forms after a rally. The Inverted
Hammer looks exactly like a Shooting Star, but forms after a downtrend. Inverted Hammers represent a potential bullish trend reversal.
qnbfs.com
Page 7 of 8
Source: Bloomberg
Company Name
Price
August 10
% Change
Weekly
% Change
YTD
Market Cap.
QR Million
TTM
P/E
P/B
Div.
Yield
Qatar National Bank 16.56 (2.59) (8.00) 152,955 11.1 1.8 3.6
Qatar Islamic Bank 20.25 2.79 9.11 47,849 12.1 2.0 3.1
Commercial Bank of Qatar 6.15 (0.81) 23.00 24,891 9.4 1.3 4.1
Doha Bank 1.72 (0.23) (12.14) 5,320 16.5 0.5 4.4
Al Ahli Bank 3.92 (2.03) (2.29) 9,995 13.2 1.5 5.1
Qatar International Islamic Bank 10.23 2.10 (1.63) 15,485 15.3 2.2 3.9
Masraf Al Rayan 2.49 (0.28) (21.38) 23,185 22.4 1.0 4.0
Lesha Bank 1.52 (3.74) 32.75 1,702 23.4 1.5 N/A
National Leasing 0.88 0.34 25.00 435 20.8 0.7 3.4
Dlala Holding 1.63 14.79 42.73 310 N/A 1.7 N/A
Qatar & Oman Investment 0.87 0.12 57.82 273 N/A 1.1 N/A
Islamic Holding Group 5.12 2.40 24.55 290 48.9 1.9 1.0
Dukhan Bank 4.21 (0.47) N/A 22,036 1.9 0.2 3.8
Banking and Financial Services 304,728
Zad Holding 13.65 (2.36) (1.83) 3,923 20.8 2.9 4.3
Qatar German Co. for Medical Devices 2.40 (0.04) 90.93 277 281.4 8.0 N/A
Salam International Investment 0.74 (4.15) 20.36 845 25.3 0.6 N/A
Baladna 1.53 0.92 (0.07) 2,909 38.1 1.3 N/A
Medicare Group 6.15 (0.93) (0.93) 1,731 21.6 1.7 29.3
Qatar Cinema & Film Distribution 3.11 (5.90) (0.13) 195 76.2 1.5 1.9
Qatar Fuel 16.43 0.49 (8.47) 16,336 16.3 1.9 5.5
Widam Food 2.35 (1.71) 15.65 423 N/A 2.5 N/A
Mannai Corp. 5.53 (2.30) (27.12) 2,523 N/A 2.6 58.8
Al Meera Consumer Goods 14.10 (0.49) (7.97) 2,905 14.7 1.8 3.1
Consumer Goods and Services 32,066
Qatar Industrial Manufacturing 3.02 2.41 (5.92) 1,435 8.2 0.8 4.3
Qatar National Cement 3.94 (1.01) (18.60) 2,575 11.8 0.9 7.6
Industries Qatar 13.50 (1.32) 5.39 81,675 15.7 2.2 8.1
Qatari Investors Group 1.73 (0.86) 2.49 2,148 12.7 0.7 8.7
Qatar Electricity and Water 18.18 0.78 2.71 19,998 11.3 1.4 5.2
Aamal 0.86 0.47 (11.79) 5,418 15.1 0.7 5.8
Gulf International Services 2.11 1.69 44.41 3,916 13.4 1.1 4.7
Mesaieed Petrochemical Holding 1.93 (2.08) (9.31) 24,234 18.5 1.5 5.7
Estithmar Holding 2.13 (1.84) 18.33 7,251 20.9 1.6 N/A
Qatar Aluminum Manufacturing 1.30 (3.91) (14.41) 7,260 9.4 1.1 6.9
Mekdam Holding Group 5.00 0.81 (13.24) 405 12.3 3.9 5.3
Industrials 156,315
Qatar Insurance 2.15 (2.31) 11.96 7,032 N/A 1.3 N/A
QLM Life & Medical Insurance 2.71 (4.50) (43.45) 950 12.6 1.7 4.6
Doha Insurance 2.30 1.59 16.22 1,150 9.7 1.0 6.5
Qatar General Insurance & Reinsurance 1.31 0.46 (11.04) 1,143 N/A 0.2 N/A
Al Khaleej Takaful Insurance 2.80 (0.04) 21.69 715 11.9 1.3 3.6
Qatar Islamic Insurance 8.90 2.33 2.33 1,335 11.6 3.2 5.1
Damaan Islamic Insurance Company 3.85 4.05 N/A 770 N/A 1.7 4.2
Insurance 13,095
United Development 1.19 0.00 (8.46) 4,214 10.3 0.4 4.6
Barwa Real Estate 2.71 (3.83) (5.60) 10,553 9.1 0.5 6.5
Ezdan Real Estate 1.12 (0.62) 11.49 29,602 1271.1 0.9 N/A
Mazaya Qatar Real Estate Development 0.82 (1.09) 17.53 947 23.0 0.9 N/A
Real Estate 45,315
Ooredoo 11.15 (1.76) 21.20 35,716 13.3 1.4 3.9
Vodafone Qatar 1.86 (2.98) 17.22 7,854 14.3 1.7 5.4
Telecoms 43,569
Qatar Navigation (Milaha) 10.10 (1.75) (0.49) 11,475 11.3 0.7 3.5
Gulf Warehousing 3.35 (1.18) (17.14) 197 8.2 0.9 3.0
Qatar Gas Transport (Nakilat) 3.92 (1.66) 7.02 21,712 14.7 1.9 3.3
Transportation 33,384
Qatar Exchange 630,212
qnbfs.com
Contacts
QNB Financial Services Co. W.L.L. Contact
Center: (+974) 4476 6666
info@qnbfs.com.qa
Doha, Qatar
Saugata Sarkar, CFA, CAIA
Head of Research
saugata.sarkar@qnbfs.com.qa
Shahan Keushgerian
Senior Research Analyst
shahan.keushgerian@qnbfs.com.qa
Phibion Makuwerere, CFA
Senior Research Analyst
phibion.makuwerere@qnbfs.com.qa
Roy Thomas
Senior Research Analyst
roy.thomas@qnbfs.com.qa
Dana Saif Al Sowaidi
Research Analyst
dana.alsowaidi@qnbfs.com.qa
Disclaimer and Copyright Notice: This publication has been prepared by QNB Financial Services Co. W.L.L. (“QNBFS”) a wholly-owned subsidiary of Qatar National Bank (Q.P.S.C.). QNB FS is
regulated by the Qatar Financial Markets Authority and the Qatar Exchange. Qatar National Bank (Q.P.S.C.) is regulated by the Qatar Central Bank. This publication expresses the views and
opinions of QNBFS at a given time only. It is not an offer, promotion or recommendation to buy or sell securities or other investments, nor is it intended to constitute legal, tax, accounting, or
financial advice. QNBFS accepts no liability whatsoever for any direct or indirect losses arising from use of this report. Any investment decision should depend on the individual circumstances of
the investor and be based on specifically engaged investment advice. We therefore strongly advise potential investors to seek independent professional advice before making any investment
decision. Although the information in this report has been obtained from sources that QNBFS believes to be reliable, we have not independently verified such information and it may not be
accurate or complete. QNBFS does not make any representations or warranties as to the accuracy and completeness of the information it may contain, and declines any liability in that respect.
For reports dealing with Technical Analysis, expressed opinions and/or recommendations may be different or contrary to the opinions/recommendations of QNBFS Fundamental Research as a
result of depending solely on the historical technical data (price and volume). QNBFS reserves the right to amend the views and opinions expressed in this publication at any time. It may also
express viewpoints or make investment decisions that differ significantly from, or even contradict, the views and opinions included in this report. This report may not be reproduced in whole or in
part without permission from QNBFS.
COPYRIGHT: No part of this document may be reproduced without the explicit written permission of QNBFS.
Page 8 of 8

More Related Content

Similar to QNBFS Weekly Market Report August 10, 2023

QNBFS Weekly Market Report July 14, 2022
QNBFS Weekly Market Report July 14, 2022QNBFS Weekly Market Report July 14, 2022
QNBFS Weekly Market Report July 14, 2022QNB Group
 
QNBFS Weekly Market Report September 07, 2023
QNBFS Weekly Market Report September 07, 2023QNBFS Weekly Market Report September 07, 2023
QNBFS Weekly Market Report September 07, 2023QNB Group
 
QNBFS Weekly Market Report July 21, 2022
QNBFS Weekly Market Report July 21, 2022QNBFS Weekly Market Report July 21, 2022
QNBFS Weekly Market Report July 21, 2022QNB Group
 
QNBFS Weekly Market Report November 16, 2017
QNBFS Weekly Market Report November 16, 2017QNBFS Weekly Market Report November 16, 2017
QNBFS Weekly Market Report November 16, 2017QNB Group
 
Weekly market report
Weekly market report Weekly market report
Weekly market report QNB Group
 
QNBFS Weekly Market Report August 09, 2018
QNBFS Weekly Market Report August 09, 2018QNBFS Weekly Market Report August 09, 2018
QNBFS Weekly Market Report August 09, 2018QNB Group
 
QNBFS Daily Market Report September 02, 2019
QNBFS Daily Market Report September 02, 2019QNBFS Daily Market Report September 02, 2019
QNBFS Daily Market Report September 02, 2019QNB Group
 
Weekly market report
Weekly market reportWeekly market report
Weekly market reportQNB Group
 
QNBFS Weekly Market Report February 24, 2022
QNBFS Weekly Market Report February 24, 2022QNBFS Weekly Market Report February 24, 2022
QNBFS Weekly Market Report February 24, 2022QNB Group
 
QNBFS Weekly Market Report February 24, 2022
QNBFS Weekly Market Report February 24, 2022QNBFS Weekly Market Report February 24, 2022
QNBFS Weekly Market Report February 24, 2022QNB Group
 
QNBFS Weekly Market Report August 13, 2020
QNBFS Weekly Market Report August 13, 2020QNBFS Weekly Market Report August 13, 2020
QNBFS Weekly Market Report August 13, 2020QNB Group
 
QNBFS Weekly Market Report June 18, 2020
QNBFS Weekly Market Report June 18, 2020QNBFS Weekly Market Report June 18, 2020
QNBFS Weekly Market Report June 18, 2020QNB Group
 
6 June Technical Market Report
6 June Technical Market Report6 June Technical Market Report
6 June Technical Market ReportQNB Group
 
QNBFS Weekly Market Report May 12, 2022
QNBFS Weekly Market Report May 12, 2022QNBFS Weekly Market Report May 12, 2022
QNBFS Weekly Market Report May 12, 2022QNB Group
 
QNBFS Daily Market Report November 01, 2020
QNBFS Daily Market Report November 01, 2020QNBFS Daily Market Report November 01, 2020
QNBFS Daily Market Report November 01, 2020QNB Group
 
QNBFS Daily Market Report July 18, 2022
QNBFS Daily Market Report July 18, 2022QNBFS Daily Market Report July 18, 2022
QNBFS Daily Market Report July 18, 2022QNB Group
 
QNBFS Weekly Market Report July 29, 2020
QNBFS Weekly Market Report July 29, 2020QNBFS Weekly Market Report July 29, 2020
QNBFS Weekly Market Report July 29, 2020QNB Group
 
QNBFS Weekly Market Report February 23, 2023
QNBFS Weekly Market Report February 23, 2023QNBFS Weekly Market Report February 23, 2023
QNBFS Weekly Market Report February 23, 2023QNB Group
 
QNBFS Weekly Market Report May 06, 2021
QNBFS Weekly Market Report May 06, 2021QNBFS Weekly Market Report May 06, 2021
QNBFS Weekly Market Report May 06, 2021QNB Group
 
Weekly market report
Weekly market reportWeekly market report
Weekly market reportQNB Group
 

Similar to QNBFS Weekly Market Report August 10, 2023 (20)

QNBFS Weekly Market Report July 14, 2022
QNBFS Weekly Market Report July 14, 2022QNBFS Weekly Market Report July 14, 2022
QNBFS Weekly Market Report July 14, 2022
 
QNBFS Weekly Market Report September 07, 2023
QNBFS Weekly Market Report September 07, 2023QNBFS Weekly Market Report September 07, 2023
QNBFS Weekly Market Report September 07, 2023
 
QNBFS Weekly Market Report July 21, 2022
QNBFS Weekly Market Report July 21, 2022QNBFS Weekly Market Report July 21, 2022
QNBFS Weekly Market Report July 21, 2022
 
QNBFS Weekly Market Report November 16, 2017
QNBFS Weekly Market Report November 16, 2017QNBFS Weekly Market Report November 16, 2017
QNBFS Weekly Market Report November 16, 2017
 
Weekly market report
Weekly market report Weekly market report
Weekly market report
 
QNBFS Weekly Market Report August 09, 2018
QNBFS Weekly Market Report August 09, 2018QNBFS Weekly Market Report August 09, 2018
QNBFS Weekly Market Report August 09, 2018
 
QNBFS Daily Market Report September 02, 2019
QNBFS Daily Market Report September 02, 2019QNBFS Daily Market Report September 02, 2019
QNBFS Daily Market Report September 02, 2019
 
Weekly market report
Weekly market reportWeekly market report
Weekly market report
 
QNBFS Weekly Market Report February 24, 2022
QNBFS Weekly Market Report February 24, 2022QNBFS Weekly Market Report February 24, 2022
QNBFS Weekly Market Report February 24, 2022
 
QNBFS Weekly Market Report February 24, 2022
QNBFS Weekly Market Report February 24, 2022QNBFS Weekly Market Report February 24, 2022
QNBFS Weekly Market Report February 24, 2022
 
QNBFS Weekly Market Report August 13, 2020
QNBFS Weekly Market Report August 13, 2020QNBFS Weekly Market Report August 13, 2020
QNBFS Weekly Market Report August 13, 2020
 
QNBFS Weekly Market Report June 18, 2020
QNBFS Weekly Market Report June 18, 2020QNBFS Weekly Market Report June 18, 2020
QNBFS Weekly Market Report June 18, 2020
 
6 June Technical Market Report
6 June Technical Market Report6 June Technical Market Report
6 June Technical Market Report
 
QNBFS Weekly Market Report May 12, 2022
QNBFS Weekly Market Report May 12, 2022QNBFS Weekly Market Report May 12, 2022
QNBFS Weekly Market Report May 12, 2022
 
QNBFS Daily Market Report November 01, 2020
QNBFS Daily Market Report November 01, 2020QNBFS Daily Market Report November 01, 2020
QNBFS Daily Market Report November 01, 2020
 
QNBFS Daily Market Report July 18, 2022
QNBFS Daily Market Report July 18, 2022QNBFS Daily Market Report July 18, 2022
QNBFS Daily Market Report July 18, 2022
 
QNBFS Weekly Market Report July 29, 2020
QNBFS Weekly Market Report July 29, 2020QNBFS Weekly Market Report July 29, 2020
QNBFS Weekly Market Report July 29, 2020
 
QNBFS Weekly Market Report February 23, 2023
QNBFS Weekly Market Report February 23, 2023QNBFS Weekly Market Report February 23, 2023
QNBFS Weekly Market Report February 23, 2023
 
QNBFS Weekly Market Report May 06, 2021
QNBFS Weekly Market Report May 06, 2021QNBFS Weekly Market Report May 06, 2021
QNBFS Weekly Market Report May 06, 2021
 
Weekly market report
Weekly market reportWeekly market report
Weekly market report
 

More from QNB Group

QNBFS Daily Market Report December 24, 2023
QNBFS Daily Market Report December 24, 2023QNBFS Daily Market Report December 24, 2023
QNBFS Daily Market Report December 24, 2023QNB Group
 
QNBFS Daily Market Report November 29, 2023
QNBFS Daily Market Report November 29, 2023QNBFS Daily Market Report November 29, 2023
QNBFS Daily Market Report November 29, 2023QNB Group
 
QNBFS Weekly Market Report November 23, 2023
QNBFS Weekly Market Report November 23, 2023QNBFS Weekly Market Report November 23, 2023
QNBFS Weekly Market Report November 23, 2023QNB Group
 
QNBFS Weekly Market Report November 16, 2023
QNBFS Weekly Market Report November 16, 2023QNBFS Weekly Market Report November 16, 2023
QNBFS Weekly Market Report November 16, 2023QNB Group
 
QNBFS Daily Technical Trader Qatar - November 14, 2023 التحليل الفني اليومي ل...
QNBFS Daily Technical Trader Qatar - November 14, 2023 التحليل الفني اليومي ل...QNBFS Daily Technical Trader Qatar - November 14, 2023 التحليل الفني اليومي ل...
QNBFS Daily Technical Trader Qatar - November 14, 2023 التحليل الفني اليومي ل...QNB Group
 
QNBFS Daily Technical Trader Qatar - November 06, 2023 التحليل الفني اليومي ل...
QNBFS Daily Technical Trader Qatar - November 06, 2023 التحليل الفني اليومي ل...QNBFS Daily Technical Trader Qatar - November 06, 2023 التحليل الفني اليومي ل...
QNBFS Daily Technical Trader Qatar - November 06, 2023 التحليل الفني اليومي ل...QNB Group
 
QNBFS Daily Market Report October 30, 2023
QNBFS Daily Market Report October 30, 2023QNBFS Daily Market Report October 30, 2023
QNBFS Daily Market Report October 30, 2023QNB Group
 
QNBFS Daily Technical Trader Qatar - October 25, 2023 التحليل الفني اليومي لب...
QNBFS Daily Technical Trader Qatar - October 25, 2023 التحليل الفني اليومي لب...QNBFS Daily Technical Trader Qatar - October 25, 2023 التحليل الفني اليومي لب...
QNBFS Daily Technical Trader Qatar - October 25, 2023 التحليل الفني اليومي لب...QNB Group
 
QNBFS Daily Technical Trader Qatar - October 10, 2023 التحليل الفني اليومي لب...
QNBFS Daily Technical Trader Qatar - October 10, 2023 التحليل الفني اليومي لب...QNBFS Daily Technical Trader Qatar - October 10, 2023 التحليل الفني اليومي لب...
QNBFS Daily Technical Trader Qatar - October 10, 2023 التحليل الفني اليومي لب...QNB Group
 
QNBFS Daily Technical Trader Qatar - October 11, 2023 التحليل الفني اليومي لب...
QNBFS Daily Technical Trader Qatar - October 11, 2023 التحليل الفني اليومي لب...QNBFS Daily Technical Trader Qatar - October 11, 2023 التحليل الفني اليومي لب...
QNBFS Daily Technical Trader Qatar - October 11, 2023 التحليل الفني اليومي لب...QNB Group
 
QNBFS Daily Technical Trader Qatar - October 10, 2023 التحليل الفني اليومي لب...
QNBFS Daily Technical Trader Qatar - October 10, 2023 التحليل الفني اليومي لب...QNBFS Daily Technical Trader Qatar - October 10, 2023 التحليل الفني اليومي لب...
QNBFS Daily Technical Trader Qatar - October 10, 2023 التحليل الفني اليومي لب...QNB Group
 
QNBFS Daily Market Report October 04, 2023
QNBFS Daily Market Report October 04, 2023QNBFS Daily Market Report October 04, 2023
QNBFS Daily Market Report October 04, 2023QNB Group
 
QNBFS Daily Technical Trader Qatar - October 04, 2023 التحليل الفني اليومي لب...
QNBFS Daily Technical Trader Qatar - October 04, 2023 التحليل الفني اليومي لب...QNBFS Daily Technical Trader Qatar - October 04, 2023 التحليل الفني اليومي لب...
QNBFS Daily Technical Trader Qatar - October 04, 2023 التحليل الفني اليومي لب...QNB Group
 
QNBFS Daily Technical Trader Qatar - September 28, 2023 التحليل الفني اليومي ...
QNBFS Daily Technical Trader Qatar - September 28, 2023 التحليل الفني اليومي ...QNBFS Daily Technical Trader Qatar - September 28, 2023 التحليل الفني اليومي ...
QNBFS Daily Technical Trader Qatar - September 28, 2023 التحليل الفني اليومي ...QNB Group
 
QNBFS Daily Market Report September 24, 2023
QNBFS Daily Market Report September 24, 2023QNBFS Daily Market Report September 24, 2023
QNBFS Daily Market Report September 24, 2023QNB Group
 
QNBFS Daily Technical Trader Qatar - September 24, 2023 التحليل الفني اليومي ...
QNBFS Daily Technical Trader Qatar - September 24, 2023 التحليل الفني اليومي ...QNBFS Daily Technical Trader Qatar - September 24, 2023 التحليل الفني اليومي ...
QNBFS Daily Technical Trader Qatar - September 24, 2023 التحليل الفني اليومي ...QNB Group
 
QNBFS Daily Technical Trader Qatar - September 19, 2023 التحليل الفني اليومي ...
QNBFS Daily Technical Trader Qatar - September 19, 2023 التحليل الفني اليومي ...QNBFS Daily Technical Trader Qatar - September 19, 2023 التحليل الفني اليومي ...
QNBFS Daily Technical Trader Qatar - September 19, 2023 التحليل الفني اليومي ...QNB Group
 
QNBFS Daily Market Report September 17, 2023
QNBFS Daily Market Report September 17, 2023QNBFS Daily Market Report September 17, 2023
QNBFS Daily Market Report September 17, 2023QNB Group
 
QNBFS Daily Technical Trader Qatar - September 07, 2023 التحليل الفني اليومي ...
QNBFS Daily Technical Trader Qatar - September 07, 2023 التحليل الفني اليومي ...QNBFS Daily Technical Trader Qatar - September 07, 2023 التحليل الفني اليومي ...
QNBFS Daily Technical Trader Qatar - September 07, 2023 التحليل الفني اليومي ...QNB Group
 
QNBFS Daily Technical Trader Qatar - September 06, 2023 التحليل الفني اليومي ...
QNBFS Daily Technical Trader Qatar - September 06, 2023 التحليل الفني اليومي ...QNBFS Daily Technical Trader Qatar - September 06, 2023 التحليل الفني اليومي ...
QNBFS Daily Technical Trader Qatar - September 06, 2023 التحليل الفني اليومي ...QNB Group
 

More from QNB Group (20)

QNBFS Daily Market Report December 24, 2023
QNBFS Daily Market Report December 24, 2023QNBFS Daily Market Report December 24, 2023
QNBFS Daily Market Report December 24, 2023
 
QNBFS Daily Market Report November 29, 2023
QNBFS Daily Market Report November 29, 2023QNBFS Daily Market Report November 29, 2023
QNBFS Daily Market Report November 29, 2023
 
QNBFS Weekly Market Report November 23, 2023
QNBFS Weekly Market Report November 23, 2023QNBFS Weekly Market Report November 23, 2023
QNBFS Weekly Market Report November 23, 2023
 
QNBFS Weekly Market Report November 16, 2023
QNBFS Weekly Market Report November 16, 2023QNBFS Weekly Market Report November 16, 2023
QNBFS Weekly Market Report November 16, 2023
 
QNBFS Daily Technical Trader Qatar - November 14, 2023 التحليل الفني اليومي ل...
QNBFS Daily Technical Trader Qatar - November 14, 2023 التحليل الفني اليومي ل...QNBFS Daily Technical Trader Qatar - November 14, 2023 التحليل الفني اليومي ل...
QNBFS Daily Technical Trader Qatar - November 14, 2023 التحليل الفني اليومي ل...
 
QNBFS Daily Technical Trader Qatar - November 06, 2023 التحليل الفني اليومي ل...
QNBFS Daily Technical Trader Qatar - November 06, 2023 التحليل الفني اليومي ل...QNBFS Daily Technical Trader Qatar - November 06, 2023 التحليل الفني اليومي ل...
QNBFS Daily Technical Trader Qatar - November 06, 2023 التحليل الفني اليومي ل...
 
QNBFS Daily Market Report October 30, 2023
QNBFS Daily Market Report October 30, 2023QNBFS Daily Market Report October 30, 2023
QNBFS Daily Market Report October 30, 2023
 
QNBFS Daily Technical Trader Qatar - October 25, 2023 التحليل الفني اليومي لب...
QNBFS Daily Technical Trader Qatar - October 25, 2023 التحليل الفني اليومي لب...QNBFS Daily Technical Trader Qatar - October 25, 2023 التحليل الفني اليومي لب...
QNBFS Daily Technical Trader Qatar - October 25, 2023 التحليل الفني اليومي لب...
 
QNBFS Daily Technical Trader Qatar - October 10, 2023 التحليل الفني اليومي لب...
QNBFS Daily Technical Trader Qatar - October 10, 2023 التحليل الفني اليومي لب...QNBFS Daily Technical Trader Qatar - October 10, 2023 التحليل الفني اليومي لب...
QNBFS Daily Technical Trader Qatar - October 10, 2023 التحليل الفني اليومي لب...
 
QNBFS Daily Technical Trader Qatar - October 11, 2023 التحليل الفني اليومي لب...
QNBFS Daily Technical Trader Qatar - October 11, 2023 التحليل الفني اليومي لب...QNBFS Daily Technical Trader Qatar - October 11, 2023 التحليل الفني اليومي لب...
QNBFS Daily Technical Trader Qatar - October 11, 2023 التحليل الفني اليومي لب...
 
QNBFS Daily Technical Trader Qatar - October 10, 2023 التحليل الفني اليومي لب...
QNBFS Daily Technical Trader Qatar - October 10, 2023 التحليل الفني اليومي لب...QNBFS Daily Technical Trader Qatar - October 10, 2023 التحليل الفني اليومي لب...
QNBFS Daily Technical Trader Qatar - October 10, 2023 التحليل الفني اليومي لب...
 
QNBFS Daily Market Report October 04, 2023
QNBFS Daily Market Report October 04, 2023QNBFS Daily Market Report October 04, 2023
QNBFS Daily Market Report October 04, 2023
 
QNBFS Daily Technical Trader Qatar - October 04, 2023 التحليل الفني اليومي لب...
QNBFS Daily Technical Trader Qatar - October 04, 2023 التحليل الفني اليومي لب...QNBFS Daily Technical Trader Qatar - October 04, 2023 التحليل الفني اليومي لب...
QNBFS Daily Technical Trader Qatar - October 04, 2023 التحليل الفني اليومي لب...
 
QNBFS Daily Technical Trader Qatar - September 28, 2023 التحليل الفني اليومي ...
QNBFS Daily Technical Trader Qatar - September 28, 2023 التحليل الفني اليومي ...QNBFS Daily Technical Trader Qatar - September 28, 2023 التحليل الفني اليومي ...
QNBFS Daily Technical Trader Qatar - September 28, 2023 التحليل الفني اليومي ...
 
QNBFS Daily Market Report September 24, 2023
QNBFS Daily Market Report September 24, 2023QNBFS Daily Market Report September 24, 2023
QNBFS Daily Market Report September 24, 2023
 
QNBFS Daily Technical Trader Qatar - September 24, 2023 التحليل الفني اليومي ...
QNBFS Daily Technical Trader Qatar - September 24, 2023 التحليل الفني اليومي ...QNBFS Daily Technical Trader Qatar - September 24, 2023 التحليل الفني اليومي ...
QNBFS Daily Technical Trader Qatar - September 24, 2023 التحليل الفني اليومي ...
 
QNBFS Daily Technical Trader Qatar - September 19, 2023 التحليل الفني اليومي ...
QNBFS Daily Technical Trader Qatar - September 19, 2023 التحليل الفني اليومي ...QNBFS Daily Technical Trader Qatar - September 19, 2023 التحليل الفني اليومي ...
QNBFS Daily Technical Trader Qatar - September 19, 2023 التحليل الفني اليومي ...
 
QNBFS Daily Market Report September 17, 2023
QNBFS Daily Market Report September 17, 2023QNBFS Daily Market Report September 17, 2023
QNBFS Daily Market Report September 17, 2023
 
QNBFS Daily Technical Trader Qatar - September 07, 2023 التحليل الفني اليومي ...
QNBFS Daily Technical Trader Qatar - September 07, 2023 التحليل الفني اليومي ...QNBFS Daily Technical Trader Qatar - September 07, 2023 التحليل الفني اليومي ...
QNBFS Daily Technical Trader Qatar - September 07, 2023 التحليل الفني اليومي ...
 
QNBFS Daily Technical Trader Qatar - September 06, 2023 التحليل الفني اليومي ...
QNBFS Daily Technical Trader Qatar - September 06, 2023 التحليل الفني اليومي ...QNBFS Daily Technical Trader Qatar - September 06, 2023 التحليل الفني اليومي ...
QNBFS Daily Technical Trader Qatar - September 06, 2023 التحليل الفني اليومي ...
 

Recently uploaded

Independent Lucknow Call Girls 8923113531WhatsApp Lucknow Call Girls make you...
Independent Lucknow Call Girls 8923113531WhatsApp Lucknow Call Girls make you...Independent Lucknow Call Girls 8923113531WhatsApp Lucknow Call Girls make you...
Independent Lucknow Call Girls 8923113531WhatsApp Lucknow Call Girls make you...makika9823
 
原版1:1复刻温哥华岛大学毕业证Vancouver毕业证留信学历认证
原版1:1复刻温哥华岛大学毕业证Vancouver毕业证留信学历认证原版1:1复刻温哥华岛大学毕业证Vancouver毕业证留信学历认证
原版1:1复刻温哥华岛大学毕业证Vancouver毕业证留信学历认证rjrjkk
 
Unveiling the Top Chartered Accountants in India and Their Staggering Net Worth
Unveiling the Top Chartered Accountants in India and Their Staggering Net WorthUnveiling the Top Chartered Accountants in India and Their Staggering Net Worth
Unveiling the Top Chartered Accountants in India and Their Staggering Net WorthShaheen Kumar
 
Call Girls In Yusuf Sarai Women Seeking Men 9654467111
Call Girls In Yusuf Sarai Women Seeking Men 9654467111Call Girls In Yusuf Sarai Women Seeking Men 9654467111
Call Girls In Yusuf Sarai Women Seeking Men 9654467111Sapana Sha
 
BPPG response - Options for Defined Benefit schemes - 19Apr24.pdf
BPPG response - Options for Defined Benefit schemes - 19Apr24.pdfBPPG response - Options for Defined Benefit schemes - 19Apr24.pdf
BPPG response - Options for Defined Benefit schemes - 19Apr24.pdfHenry Tapper
 
Q3 2024 Earnings Conference Call and Webcast Slides
Q3 2024 Earnings Conference Call and Webcast SlidesQ3 2024 Earnings Conference Call and Webcast Slides
Q3 2024 Earnings Conference Call and Webcast SlidesMarketing847413
 
Lundin Gold April 2024 Corporate Presentation v4.pdf
Lundin Gold April 2024 Corporate Presentation v4.pdfLundin Gold April 2024 Corporate Presentation v4.pdf
Lundin Gold April 2024 Corporate Presentation v4.pdfAdnet Communications
 
How Automation is Driving Efficiency Through the Last Mile of Reporting
How Automation is Driving Efficiency Through the Last Mile of ReportingHow Automation is Driving Efficiency Through the Last Mile of Reporting
How Automation is Driving Efficiency Through the Last Mile of ReportingAggregage
 
Call Girls Near Delhi Pride Hotel, New Delhi|9873777170
Call Girls Near Delhi Pride Hotel, New Delhi|9873777170Call Girls Near Delhi Pride Hotel, New Delhi|9873777170
Call Girls Near Delhi Pride Hotel, New Delhi|9873777170Sonam Pathan
 
magnetic-pensions-a-new-blueprint-for-the-dc-landscape.pdf
magnetic-pensions-a-new-blueprint-for-the-dc-landscape.pdfmagnetic-pensions-a-new-blueprint-for-the-dc-landscape.pdf
magnetic-pensions-a-new-blueprint-for-the-dc-landscape.pdfHenry Tapper
 
Tenets of Physiocracy History of Economic
Tenets of Physiocracy History of EconomicTenets of Physiocracy History of Economic
Tenets of Physiocracy History of Economiccinemoviesu
 
OAT_RI_Ep19 WeighingTheRisks_Apr24_TheYellowMetal.pptx
OAT_RI_Ep19 WeighingTheRisks_Apr24_TheYellowMetal.pptxOAT_RI_Ep19 WeighingTheRisks_Apr24_TheYellowMetal.pptx
OAT_RI_Ep19 WeighingTheRisks_Apr24_TheYellowMetal.pptxhiddenlevers
 
government_intervention_in_business_ownership[1].pdf
government_intervention_in_business_ownership[1].pdfgovernment_intervention_in_business_ownership[1].pdf
government_intervention_in_business_ownership[1].pdfshaunmashale756
 
VIP Kolkata Call Girl Jodhpur Park 👉 8250192130 Available With Room
VIP Kolkata Call Girl Jodhpur Park 👉 8250192130  Available With RoomVIP Kolkata Call Girl Jodhpur Park 👉 8250192130  Available With Room
VIP Kolkata Call Girl Jodhpur Park 👉 8250192130 Available With Roomdivyansh0kumar0
 
Authentic No 1 Amil Baba In Pakistan Authentic No 1 Amil Baba In Karachi No 1...
Authentic No 1 Amil Baba In Pakistan Authentic No 1 Amil Baba In Karachi No 1...Authentic No 1 Amil Baba In Pakistan Authentic No 1 Amil Baba In Karachi No 1...
Authentic No 1 Amil Baba In Pakistan Authentic No 1 Amil Baba In Karachi No 1...First NO1 World Amil baba in Faisalabad
 
Interimreport1 January–31 March2024 Elo Mutual Pension Insurance Company
Interimreport1 January–31 March2024 Elo Mutual Pension Insurance CompanyInterimreport1 January–31 March2024 Elo Mutual Pension Insurance Company
Interimreport1 January–31 March2024 Elo Mutual Pension Insurance CompanyTyöeläkeyhtiö Elo
 
The Triple Threat | Article on Global Resession | Harsh Kumar
The Triple Threat | Article on Global Resession | Harsh KumarThe Triple Threat | Article on Global Resession | Harsh Kumar
The Triple Threat | Article on Global Resession | Harsh KumarHarsh Kumar
 
chapter_2.ppt The labour market definitions and trends
chapter_2.ppt The labour market definitions and trendschapter_2.ppt The labour market definitions and trends
chapter_2.ppt The labour market definitions and trendslemlemtesfaye192
 
原版1:1复刻堪萨斯大学毕业证KU毕业证留信学历认证
原版1:1复刻堪萨斯大学毕业证KU毕业证留信学历认证原版1:1复刻堪萨斯大学毕业证KU毕业证留信学历认证
原版1:1复刻堪萨斯大学毕业证KU毕业证留信学历认证jdkhjh
 
call girls in Nand Nagri (DELHI) 🔝 >༒9953330565🔝 genuine Escort Service 🔝✔️✔️
call girls in  Nand Nagri (DELHI) 🔝 >༒9953330565🔝 genuine Escort Service 🔝✔️✔️call girls in  Nand Nagri (DELHI) 🔝 >༒9953330565🔝 genuine Escort Service 🔝✔️✔️
call girls in Nand Nagri (DELHI) 🔝 >༒9953330565🔝 genuine Escort Service 🔝✔️✔️9953056974 Low Rate Call Girls In Saket, Delhi NCR
 

Recently uploaded (20)

Independent Lucknow Call Girls 8923113531WhatsApp Lucknow Call Girls make you...
Independent Lucknow Call Girls 8923113531WhatsApp Lucknow Call Girls make you...Independent Lucknow Call Girls 8923113531WhatsApp Lucknow Call Girls make you...
Independent Lucknow Call Girls 8923113531WhatsApp Lucknow Call Girls make you...
 
原版1:1复刻温哥华岛大学毕业证Vancouver毕业证留信学历认证
原版1:1复刻温哥华岛大学毕业证Vancouver毕业证留信学历认证原版1:1复刻温哥华岛大学毕业证Vancouver毕业证留信学历认证
原版1:1复刻温哥华岛大学毕业证Vancouver毕业证留信学历认证
 
Unveiling the Top Chartered Accountants in India and Their Staggering Net Worth
Unveiling the Top Chartered Accountants in India and Their Staggering Net WorthUnveiling the Top Chartered Accountants in India and Their Staggering Net Worth
Unveiling the Top Chartered Accountants in India and Their Staggering Net Worth
 
Call Girls In Yusuf Sarai Women Seeking Men 9654467111
Call Girls In Yusuf Sarai Women Seeking Men 9654467111Call Girls In Yusuf Sarai Women Seeking Men 9654467111
Call Girls In Yusuf Sarai Women Seeking Men 9654467111
 
BPPG response - Options for Defined Benefit schemes - 19Apr24.pdf
BPPG response - Options for Defined Benefit schemes - 19Apr24.pdfBPPG response - Options for Defined Benefit schemes - 19Apr24.pdf
BPPG response - Options for Defined Benefit schemes - 19Apr24.pdf
 
Q3 2024 Earnings Conference Call and Webcast Slides
Q3 2024 Earnings Conference Call and Webcast SlidesQ3 2024 Earnings Conference Call and Webcast Slides
Q3 2024 Earnings Conference Call and Webcast Slides
 
Lundin Gold April 2024 Corporate Presentation v4.pdf
Lundin Gold April 2024 Corporate Presentation v4.pdfLundin Gold April 2024 Corporate Presentation v4.pdf
Lundin Gold April 2024 Corporate Presentation v4.pdf
 
How Automation is Driving Efficiency Through the Last Mile of Reporting
How Automation is Driving Efficiency Through the Last Mile of ReportingHow Automation is Driving Efficiency Through the Last Mile of Reporting
How Automation is Driving Efficiency Through the Last Mile of Reporting
 
Call Girls Near Delhi Pride Hotel, New Delhi|9873777170
Call Girls Near Delhi Pride Hotel, New Delhi|9873777170Call Girls Near Delhi Pride Hotel, New Delhi|9873777170
Call Girls Near Delhi Pride Hotel, New Delhi|9873777170
 
magnetic-pensions-a-new-blueprint-for-the-dc-landscape.pdf
magnetic-pensions-a-new-blueprint-for-the-dc-landscape.pdfmagnetic-pensions-a-new-blueprint-for-the-dc-landscape.pdf
magnetic-pensions-a-new-blueprint-for-the-dc-landscape.pdf
 
Tenets of Physiocracy History of Economic
Tenets of Physiocracy History of EconomicTenets of Physiocracy History of Economic
Tenets of Physiocracy History of Economic
 
OAT_RI_Ep19 WeighingTheRisks_Apr24_TheYellowMetal.pptx
OAT_RI_Ep19 WeighingTheRisks_Apr24_TheYellowMetal.pptxOAT_RI_Ep19 WeighingTheRisks_Apr24_TheYellowMetal.pptx
OAT_RI_Ep19 WeighingTheRisks_Apr24_TheYellowMetal.pptx
 
government_intervention_in_business_ownership[1].pdf
government_intervention_in_business_ownership[1].pdfgovernment_intervention_in_business_ownership[1].pdf
government_intervention_in_business_ownership[1].pdf
 
VIP Kolkata Call Girl Jodhpur Park 👉 8250192130 Available With Room
VIP Kolkata Call Girl Jodhpur Park 👉 8250192130  Available With RoomVIP Kolkata Call Girl Jodhpur Park 👉 8250192130  Available With Room
VIP Kolkata Call Girl Jodhpur Park 👉 8250192130 Available With Room
 
Authentic No 1 Amil Baba In Pakistan Authentic No 1 Amil Baba In Karachi No 1...
Authentic No 1 Amil Baba In Pakistan Authentic No 1 Amil Baba In Karachi No 1...Authentic No 1 Amil Baba In Pakistan Authentic No 1 Amil Baba In Karachi No 1...
Authentic No 1 Amil Baba In Pakistan Authentic No 1 Amil Baba In Karachi No 1...
 
Interimreport1 January–31 March2024 Elo Mutual Pension Insurance Company
Interimreport1 January–31 March2024 Elo Mutual Pension Insurance CompanyInterimreport1 January–31 March2024 Elo Mutual Pension Insurance Company
Interimreport1 January–31 March2024 Elo Mutual Pension Insurance Company
 
The Triple Threat | Article on Global Resession | Harsh Kumar
The Triple Threat | Article on Global Resession | Harsh KumarThe Triple Threat | Article on Global Resession | Harsh Kumar
The Triple Threat | Article on Global Resession | Harsh Kumar
 
chapter_2.ppt The labour market definitions and trends
chapter_2.ppt The labour market definitions and trendschapter_2.ppt The labour market definitions and trends
chapter_2.ppt The labour market definitions and trends
 
原版1:1复刻堪萨斯大学毕业证KU毕业证留信学历认证
原版1:1复刻堪萨斯大学毕业证KU毕业证留信学历认证原版1:1复刻堪萨斯大学毕业证KU毕业证留信学历认证
原版1:1复刻堪萨斯大学毕业证KU毕业证留信学历认证
 
call girls in Nand Nagri (DELHI) 🔝 >༒9953330565🔝 genuine Escort Service 🔝✔️✔️
call girls in  Nand Nagri (DELHI) 🔝 >༒9953330565🔝 genuine Escort Service 🔝✔️✔️call girls in  Nand Nagri (DELHI) 🔝 >༒9953330565🔝 genuine Escort Service 🔝✔️✔️
call girls in Nand Nagri (DELHI) 🔝 >༒9953330565🔝 genuine Escort Service 🔝✔️✔️
 

QNBFS Weekly Market Report August 10, 2023

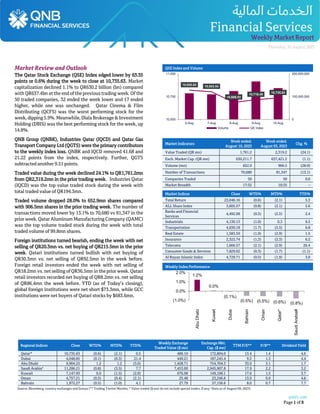
  • 1. qnbfs.com Page 1 of 8 Weekly MarketReport Thursday,10 August 2023 Regional Indices Close WTD% MTD% YTD% Weekly Exchange Traded Value ($ mn) Exchange Mkt. Cap. ($ mn) TTM P/E** P/B** Dividend Yield Qatar* 10,735.63 (0.6) (2.1) 0.5 486.10 172,804.0 13.4 1.4 4.6 Dubai 4,048.85 (0.1) (0.3) 21.4 449.21 187,245.4 9.3 1.3 4.4 Abu Dhabi 9,904.25 1.2 1.2 (3.0) 1,428.71 754,704.3 33.0 3.1 1.7 Saudi Arabia# 11,286.21 (0.8) (3.5) 7.7 7,453.00 2,945,907.8 17.9 2.2 3.2 Kuwait 7,147.93 0.0 (1.5) (2.0) 676.98 149,106.1 17.6 1.5 3.7 Oman 4,757.21 (0.5) (0.4) (2.1) 25.48 23,246.6 13.0 0.9 4.6 Bahrain 1,972.27 (0.5) (1.0) 4.1 27.79 57,156.6 8.0 0.7 7.7 Source: Bloomberg, country exchanges and Zawya (** Trailing Twelve Months; * Value traded ($ mn) do not include special trades, if any; #Data as of August 09, 2023) Market Review and Outlook QSE Index and Volume The Qatar Stock Exchange (QSE) Index edged lower by 63.35 points or 0.6% during the week to close at 10,735.63. Market capitalization declined 1.1% to QR630.2 billion (bn) compared with QR637.4bn at the end of the previous trading week. Of the 50 traded companies, 32 ended the week lower and 17 ended higher, while one was unchanged. Qatar Cinema & Film Distributing (QCFS) was the worst performing stock for the week,dipping 5.9%. Meanwhile,DlalaBrokerage& Investment Holding (DBIS) was the best performing stock for the week, up 14.8%. QNB Group (QNBK), Industries Qatar (IQCD) and Qatar Gas Transport Company Ltd (QGTS) were the primary contributors to the weekly index loss. QNBK and IQCD removed 41.68 and 21.22 points from the index, respectively. Further, QGTS subtracted another 9.51 points. Traded value during the week declined 24.1% to QR1,761.2mn from QR2,319.2mn in the prior trading week. Industries Qatar (IQCD) was the top value traded stock during the week with total traded value of QR194.3mn. Traded volume dropped 28.0% to 652.9mn shares compared with 906.5mn shares in the prior trading week. The number of transactions moved lower by 13.1% to 70,680 vs 81,347 in the prior week. Qatar Aluminum Manufacturing Company (QAMC) was the top volume traded stock during the week with total traded volume of 99.8mn shares. Foreign institutions turned bearish, ending the week with net selling of QR20.3mn vs. net buying of QR215.5mn in the prior week. Qatari institutions turned bullish with net buying of QR30.3mn vs. net selling of QR92.5mn in the week before. Foreign retail investors ended the week with net selling of QR18.2mn vs. net selling of QR36.5mn in the prior week. Qatari retail investors recorded net buying of QR8.2mn vs. net selling of QR86.4mn the week before. YTD (as of Today’s closing), global foreign institutions were net short $73.3mn, while GCC institutions were net buyers of Qatari stocks by $683.6mn. Market Indicators Week ended. August 10, 2023 Week ended. August 03, 2023 Chg. % Value Traded (QR mn) 1,761.2 2,319.2 (24.1) Exch. Market Cap. (QR mn) 630,211.7 637,421.2 (1.1) Volume (mn) 652.9 906.5 (28.0) Number of Transactions 70,680 81,347 (13.1) Companies Traded 50 50 0.0 Market Breadth 17:32 10:35 – Market Indices Close WTD% MTD% YTD% Total Return 23,040.16 (0.6) (2.1) 5.3 ALL Share Index 3,605.57 (0.8) (2.1) 5.6 Banks and Financial Services 4,492.08 (0.5) (2.5) 2.4 Industrials 4,130.13 (1.0) 0.3 9.2 Transportation 4,630.18 (1.7) (5.5) 6.8 Real Estate 1,583.59 (1.9) (2.9) 1.5 Insurance 2,322.74 (1.3) (2.3) 6.2 Telecoms 1,666.57 (2.1) (2.9) 26.4 Consumer Goods & Services 7,829.02 (0.3) (1.7) (1.1) Al Rayan Islamic Index 4,729.71 (0.5) (1.9) 3.0 Weekly Index Performance 10,820.82 10,803.54 10,686.03 10,716.45 10,735.63 0 100,000,000 200,000,000 10,500 10,750 11,000 6-Aug 7-Aug 8-Aug 9-Aug 10-Aug Volume QE Index 1.2% 0.0% (0.1%) (0.5%) (0.5%) (0.6%) (0.8%) (1.0%) 0.0% 1.0% 2.0% Abu Dhabi Kuwait Dubai Bahrain Oman Qatar* Saudi Arabia#
  • 2. qnbfs.com Page 2 of 8 Economic, Market & Company News  QFC PMI: Qatar’s non-energy sector witnesses a rosy start in second half - Qatar’s non-energy sector witnessed a rosy start in the second half of 2023 with output, new orders, employment and purchasing witnessing expansion, according to Qatar Financial Centre (QFC). The latest Purchasing Managers’ Index (PMI) survey data from the QFC said backlogged work continued to fall, albeit less so than in the first half of the year, while inflationary pressures eased. The Qatar PMI indices are compiled from survey responses from a panel of around 450 private sector companies. The panel covers the manufacturing, construction, wholesale, retail, and services sectors, and reflects the structure of the non-energy economy according to official national accounts data. The headline PMI – a composite single-figure indicator of non-energy private sector performance that is derived from indicators for new orders, output, employment, suppliers’ delivery times and stocks of purchases – posted 54 in July, up slightly from 53.8 in June, indicating another strong improvement in business conditions. The latest figure was a superior outcome relative to the first half of 2023 (52.5) and remained well above the long-run trend of 52.3. “Qatar PMI data continued to point to an expansion of the non-energy private sector as we enter the second half of 2023. The latest headline figure of 54.0 is well above the long- run survey average as total business activity and demand both rose strongly in July," said Yousuf Mohamed al-Jaida, chief executive officer, QFC Authority. Companies also stepped up hiring as a slower fall in outstanding work hinted at returning pressure on business capacity, according to him. Total business activity among Qatari non-energy private sector firms rose further in July. Output has risen every month for more than three years, except for a brief correction in January following the conclusion of the FIFA World Cup Qatar 2022. The rate of expansion accelerated since June and was the second strongest of 2023 so far. "The 12-month outlook for the non- energy private sector remained optimistic in July. Higher expected business volumes were linked to new sales strategies, new hires, tourism and new products," it said, adding positive expectations remained broad-based by sector with service providers being the most optimistic, followed by goods producers. July data signaled another increase in non-oil private sector employment and at the fastest rate since July 2022. Recruitment was aimed both at new workloads and efforts to clear backlogs, which were reduced for the twelfth successive month. Supply chains continued to improve as average lead times fell for the fifteenth successive month, a series- record sequence. Input inventories rose only slightly, suggesting companies managed stock levels well during the month. Price pressures eased in July, as the overall input prices index fell since June and was at a level indicative of a marginal rate of inflation. Meanwhile, output prices fell for the third month running, albeit only marginally. Qatar's financial services sector continued to expand markedly at the start of the second half of 2023. Growth in new business remained sharp, leading to another strong rise in total activity. The outlook brightened since June and employment in the sector rose at the strongest rate in over a year. "Financial services remains a strong point for the economy, with the key indices for activity and new business both remaining elevated in July, while employment in the sector rose at the strongest rate in over a year," al-Jaida said. (Gulf Times)  IQCD's net profit declines 66.2% YoY and 20.9% QoQ in 2Q2023, misses our estimate - Industries Qatar's (IQCD) net profit declined 66.2% YoY (-20.9% QoQ) to QR922.2mn in 2Q2023, missing our estimate of QR987.5mn (variation of -6.6%). The company's revenue came in at QR2,634.6mn in 2Q2023, which represents a decrease of 48.7% YoY (-24.0% QoQ). EPS amounted to QR0.35 in 6M2023 as compared to QR0.90 in 6M2022. (QNBFS, QSE)  QEWS posts 24.3% YoY increase but 8.2% QoQ decline in net profit in 2Q2023, misses our estimate - Qatar Electricity & Water Company's (QEWS) net profit rose 24.3% YoY (but declined 8.2% on QoQ basis) to QR367.9mn in 2Q2023, missing our estimate of QR414.9mn (variation of -11.3%). The company's revenue came in at QR702.0mn in 2Q2023, which represents an increase of 13.6% YoY (+9.9% QoQ). EPS amounted to QR0.33 in 2Q2023 as compared to QR0.27 in 2Q2022. (QNBFS, QSE)  QNNS posts 1.4% YoY increase but 21.7% QoQ decline in net profit in 2Q2023, beating our estimate - Qatar Navigation's (QNNS) net profit rose 1.4% YoY (but declined 21.7% on QoQ basis) to QR284.4mn in 2Q2023, beating our estimate of QR263.7mn (variation of +7.8%). The company's operating revenue came in at QR744.6mn in 2Q2023, which represents a decrease of 13.5% YoY (- 2.8% QoQ). EPS amounted to QR0.57 in 6M2023 as compared to QR0.56 in 6M2022. (QNBFS, QSE)  IGRD's net profit declines 2.3% YoY and 2.8% QoQ in 2Q2023, beating our estimate - Estithmar Holding's (IGRD) net profit declined 2.3% YoY (-2.8% QoQ) to QR98.4mn in 2Q2023, beating our estimate of QR45.1mn. The company's revenue came in at QR717.4mn in 2Q2023, which represents a decrease of 28.7% YoY (-6.4% QoQ). EPS amounted to QR0.029 in 2Q2023 as compared to QR0.034 in 2Q2022. (QNBFS, QSE)  BLDN's bottom line rises 2.7% YoY and 11.3% QoQ in 2Q2023 - Baladna's (BLDN) net profit rose 2.7% YoY (+11.3% QoQ) to QR22.3mn in 2Q2023. The company's revenue came in at QR262.2mn in 2Q2023, which represents an increase of 7.2% YoY (+3.1% QoQ). EPS amounted to QR0.012 in 2Q2023 as compared to QR0.011 in 2Q2022. (QSE)  MPHC posts 46.9% YoY decrease but 17.7% QoQ increase in net profit in 2Q2023 - Mesaieed Petrochemical Holding Company's (MPHC) net profit declined 46.9% YoY (but rose 17.7% on QoQ basis) to QR316.2mn in 2Q2023. The company's share of results from joint ventures came in at QR291.1mn in 2Q2023, which represents a decrease of 50.3% YoY. However, on QoQ basis Share of results from joint ventures rose 20.3%. EPS amounted to QR0.047 in 6M2023 as compared to QR0.083 in 6M2023. (QSE)  QFBQ's bottom line rises 7.5% YoY and 2.2% QoQ in 2Q2023 - Qatar First Bank's (QFBQ) net profit rose 7.5% YoY (+2.2% QoQ) to QR22.6mn in 2Q2023. Total Income increased 108.0% YoY in 2Q2023 to QR40.7mn. However, on QoQ basis total income declined 19.3%. The bank's total assets stood at QR5.1bn at the end of June 30, 2023, up 13.6% YoY (+1.9% QoQ). Financing Assets were QR0.1bn, registering a 73.8% decline YoY (-60.7% QoQ) at the end of June 30, 2023. Financing liabilities rose 33.9% YoY to reach QR0.6bn at the end of June 30, 2023. However, on QoQ basis financing liabilities fell 1.5%. EPS amounted to QR0.020 in 2Q2023 as compared to QR0.021 in 2Q2023. (QNBFS, QSE)  SIIS reports net loss of QR2.4mn in 2Q2023 - Salam International Investment Limited (SIIS) reported net loss of QR2.4mn in 2Q2023 as compared to net profit of QR15.9mn in 2Q2022 and net profit of
  • 3. qnbfs.com Page 3 of 8 QR6.9mn in 1Q2023. EPS amounted to QR0.004 in 6M2023 as compared to QR0.022 in 6M2022. (QSE)  QE Index ETF discloses its financial statements as at and for the period from 01 January 2023 to 30 June 2023 - QE Index ETF disclosed its financial statements as at and for the period ending 30 June 2023. The statements show that the net asset value as of 30 June 2023 amounted to QR397,858,970 representing QR9.772 per unit. In addition, QE Index ETF distributed dividends during the second quarter of 2023. (QSE)  QIGD posts 25.3% YoY increase but 13.5% QoQ decline in net profit in 2Q2023 - Qatari Investors Group 's (QIGD) net profit rose 25.3% YoY (but declined 13.5% on QoQ basis) to QR47.1mn in 2Q2023. The company's revenue came in at QR132.9mn in 2Q2023, which represents a decrease of 26.1% YoY (-1.3% QoQ). EPS amounted to QR0.08 in 6M2023 as compared to QR0.10 in 6M2022. (QSE)  QISI's bottom line rises 36.3% YoY and 19.2% QoQ in 2Q2023 - Qatar Islamic Insurance Company's (QISI) net profit rose 36.3% YoY (+19.2% QoQ) to QR34.9mn in 2Q2023. The company's total revenues came in at QR51.4mn in 2Q2023, which represents an increase of 28.8% YoY (+1.1% QoQ). EPS amounted to QR0.23 in 2Q2023 as compared to QR0.17 in 2Q2022. (QSE)  BEMA's bottom line rises 7.3% YoY and 43.9% QoQ in 2Q2023 - Damaan Islamic Insurance Company's (BEMA) net profit rose 7.3% YoY (+43.9% QoQ) to QR19.7mn in 2Q2023. The company's total income came in at QR33.5mn in 2Q2023, which represents an increase of 13.3% YoY (+21.8% QoQ). EPS amounted to QR 0.167 in 6M2023 as compared to QR0.160 in 6M2022. (QSE)  DBIS reports net loss of QR0.5mn in 2Q2023 - Dlala Brokerage and Investments Holding Co. (DBIS) reported net loss of QR0.5mn in 2Q2023 as compared to net loss of QR13.3mn in 2Q2022 and QR2.4mn in 1Q2023. The company's net brokerage commission income came in at QR2.3mn in 2Q2023, which represents a decrease of 36.6% YoY (-5.3% QoQ). The loss per share amounted to QR0.015 in 6M2023 as compared to 0.018 in 6M2022. (QSE)  Mekdam Holding Group: Successful Subscription rate that exceeded 97.85% - Mekdam Holding Group announced the end of the subscription period, which extended from Tuesday 25-07-2023 to Monday 07-08-2023. The subscription rate at Arab Bank exceeded 97.85% of the offered shares. The Board of Directors expressed their thanks and appreciation to the honorable shareholders for their confidence in Mekdam Holding Group. Mekdam Holding Group shall take the necessary procedures to complete the subscription process of unsubscribed shares in accordance with the mechanism approved by the Qatar Financial Markets Authority (QFMA) and as per the authority provided to the Board of Directors by the EGM on 11 June 2023. (QSE)  Mekdam Holding Group: Sale of unsubscribed shares - In connection with rights issue process, where the number of subscribed shares amounted to 29,357,101 while the number of unsubscribed shares amounted to 642,899 shares; Mekdam Holding Group hereby announces that it will commence the sale of unsubscribed shares through the Qatar Stock Exchange from 14-08-2023 to 27-08-2023. (QSE)  Oxford Economics: Qatar’s current account surplus to remain in double digits this year and next - Qatar’s current account surplus will remain in double digits this year and in 2024, Oxford Economics said in its latest country update. The surplus widened to over 26% of GDP in 2022, Oxford Economics noted. Oxford Economics expects Qatar's overall GDP to grow by 2.6% this year and next. Non-oil activity is continuing to rise according to the purchasing managers' index (PMI) survey, ending the second quarter (Q2) strongly at 53.8 in June. Robust demand has been a key driver of the recovery in output and employment and has kept businesses optimistic, particularly in the manufacturing and services sectors. “We expect non-oil GDP growth to soften somewhat, slowing from 3.3% this year to 3.2% in 2024,” Oxford Economics said. The latest industrial output data show the mining sector's performance continues to improve, albeit at a slower pace of just 0.8% year-on-year (y-o-y) in May. The trend is “consistent” with Oxford Economics’ energy GDP growth outlook, which the researcher thinks will ease to 1.3% this year, from 1.7% in 2022. “Still, the North Field gas expansion project is driving a more positive medium-term outlook for the sector,” Oxford Economics noted. Budget data for the first quarter (Q1) showed revenues rose 5.5% compared to the same quarter last year, driven by energy income. Meanwhile, spending fell 4.9% y-o-y amid reduced capital and project spending, which widened the quarterly budget surplus to QR19.7bn. Notwithstanding lower global commodity prices, Oxford Economics anticipates a full year budget surplus of 9.2% of GDP this year, before it narrows to 8.4% in 2024. Inflation moderated to a two- year low of 2.5% y-o-y in June, dragging down the Q2 average to 3%, from 4.2% in Q1. Disinflation continued across most categories, but food and recreation and culture prices climbed, driving a 0.1% month-on-month (m-o-m) increase in the headline rate. “We expect inflation to ease further in the next few months and briefly turn negative in Q4. We have hardly changed our 2023 forecast, now at 2.2%, and expect inflation to average 1.9% next year,” Oxford Economics said. Qatar's central bank raised interest rates by 25bps in July, mirroring the move by the US Fed. This, it said, is likely to be the final hike of this cycle given that both inflation and demand are cooling, though further tightening is still a potential. Moreover, the shift to rate cuts will likely be delayed well into 2024, with policy easing only gradually, Oxford Economics added. (Gulf Times)  Qatar Investment Authority picks up 2.7% in Adani Green - Qatar Investment Authority (QIA) on Monday picked up a 2.7% stake in Adani Green Energy (AGEL) in a block deal worth Rs3,920 crore ($474mn), nearly a month after the renewable energy firm raised funds from GQG Partners and other investors. The move is a sign of investor confidence in Adani Group companies, after a report by Hindenburg Research in January resulted in the conglomerate losing nearly half of its market capitalization. QIA, a sovereign wealth fund of Qatar, bought 42.6mn shares in a bulk deal at an average of Rs920 a share. The shares were acquired through its wholly owned subsidiary INQ Holding, while Infinite Trade and Investment, a promoter entity of AGEL, was the seller, according to stock exchange data. AGEL's promoter entity sold 44.88mn shares, amounting to a 2.83% stake, at Rs920.43 a share. This amounted to Rs4,131 crore ($500mn). After the bulk deal, Infinite Trade and Investment's holding fell to 0.57% from 3.37%. As of June 30, the total promoter holding in AGEL was at 56.27%. Shares of Adani Green fell 12.5% during intra-day trade on Monday and closed down 4.69% at Rs965.05 on the BSE. AGEL, the renewable energy arm of Adani Group, had an operational capacity of 8,316 MW as of June-end. This was following the addition of 1,750 MW solar-wind hybrid, 212 MW solar and 554 MW wind power plants over the last one year. The company aims to build 45 GW (45,000 MW) of capacity by FY30. This is the second investment by QIA in an Adani Group company. In 2020, Adani Transmission (now Adani Energy Solutions) raised Rs3,220 crore in lieu of a 25.10% stake in Adani Electricity Mumbai. In July, the Adani family raised $1.38bn (Rs11,330 crore) through stake sales in three portfolio companies: AGEL, Adani Enterprises
  • 4. qnbfs.com Page 4 of 8 and Adani Transmission. The fundraise was to ensure higher capital availability at the group level, which was to be used for growth and near-term commitments, including debt, over the next 12-18 months. In June, US investment firm GQG Partners and other investors bought shares worth Rs11,000 crore in the three companies through block deals, mainly from Adani group family firms. Prior to that, in March, GQG acquired stakes worth Rs15,446 crore in four Adani group companies, and later in May it purchased further shares worth $400-500mn. (Bloomberg)  Qatar's single window committee for capital market to ease and streamline listings - The proposed single window committee is expected to ease and streamline the listing process in the Qatar’s capital market, leading the country’s bourse to see brisk activities on an expected faster approval of listings and instruments in the future, according to experts. "As the name suggests, there is no need to apply in various authorities. This, in itself, will cut down the time taken for the approval. The (opportunity) cost (towards listing) also comes down in the process," an analystwith a leading brokerage house said. Early last month, the Qatar Financial Markets Authority (QFMA) issued a resolution to establish a "Single Window Committee for the Capital Market" with the goal of reducing time and effort and significantly simplifying procedures for companies whose activities are related to the financial markets in the country. “The move makes it easier for the issuers to process their applications,” he said, adding the stage is set for smooth and speedier initial public offerings (IPOs) and follow-on issues as well as other instruments such as exchange traded funds and derivatives. According to Dr Tami bin Ahmed al- Binali, QFMA chief executive officer, the establishment of a "Single Window Committee for the Capital Market" represents an important step forward as it will facilitate and simplify procedures for companies active in the country's financial market. The 11-member Committee will have five members from the QFMA, four from the Qatar Stock Exchange (QSE), and each from the Ministry of Commerce and Industry and Edaa (formerly Qatar Central Securities Depository Company). Among the other advantages provided by the 'one-stop-shop window for the capital market' for these companies is having streamlined and smooth processes for the public offering and listing of securities on QSE, whether upon their incorporation, conversion to a joint stock company, direct listing, or entry into any acquisitions or mergers. The listing process would speed up because the due diligence and other legwork start at least a year before the (actual) listing, market sources said. Since (multiple) authorities concerned are in the committee, the chance of delay at each step comes down as the new single window system will be the nodal point, which will vet the applications based on the broad guidelines set by the QFMA, according to the sources. The proposed single window committee comes amid reports of more listings expected, considering that the procedural reforms as direct listing and book- building mechanism ought to attract more companies. Having put in place a new trading mechanism, the Qatari bourse is all set to move into a T+2 settlement cycle compared to T+3. The initiative is in line with international best practices in regional and international markets, to achieve efficiency, and reduce the risks of a long settlement period. (Gulf Times)  QSE witnesses best monthly returns in GCC during July - GCC equity markets reported growth for the second consecutive month during July 2023 in line with the growthin most other global equity markets. The aggregate MSCI GCC index was up 3.3% during the month reflecting positive performance in all the GCC equity markets in July 2023. According to GCC markets monthly report by Kamco Invest, Qatar was the best performing market during the month registering a gain of 8.8% followed by Dubai and Kuwait benchmarks with monthly gains of 7% and 3.2% respectively. Qatar Stock Exchange (QSE) witnessed the best monthly returns in the GCC during July 2023 with the QE 20 index gaining 8.8% during the month. Notably, these gains came after five consecutive months of declines this year. The Qatar All Share Index witnessed a gain of 8.4% during the month indicating investor interest across the market segments. With the gains in July 2023 the YTD-2023 growth for the QE 20 index reached 2.6% while the Qatar All Share Index registered a higher growth 6.7% at the end of July, 2023. The sector performance chart also reflected solid gains with all the sectors in the green. The industrials index topped during the month with a gain of 11.7% closely followed by banks and financials services and real estate indices with gains of 10.1% and 8.4% respectively. The report noted that the gains for industrial index was mainly led by the shares of Industries Qatar which was up 18.7% followed by 14% gain in shares of Gulf International Services. Most of the constituents in the banks and financial services sector witnessed gains with shares of Qatar Islamic Bank up by 19.4% followed by Doha Bank with a gain of 12. 4%. In the real estate sector shares of Mazaya Real Estate Development gained 11.6% during the month. In first half (H1), 2023 earning releases, QNB reported net profit of QR7.6bn in the H1, 2023 up from QR7bn in H1, 2022, driven by higher net interest income. Qatar Islamic Bank (QIBK) posted a net profit of QR1.95bn for H1, 2023, representing a growth of 7.7% over the same period in 2022. The banks’s income from financing and investing activities registered a growth of 26.3% to reach QR4.75bn for the first half of 2023 compared to QR3.76bn for the same period of 2022. Similarly, the Commercial Bank of Qatar reported a net profit of QR1.55bn for H1, 2023 compared to a net profit of QR1.43bn in H1, 2022 up by 8.5%. The monthly stock performance chart was topped with Widam Food Company with a gain of 34. 4% followed by the Qatar Oman for Investment and Qatar Islamic Bank with gains of 24.7% and 19.4% respectively. On the decliners side, Qatar General and Reinsurance topped with a decline of 12.3% followed by Zad Holding and Dlala Brokerage and Investment Holding with declines of 2.9% and 2.7% respectively, the report added. In terms of the trading activity, the report further stated that the total volume of shares traded during the month increased by 20.7% to 4.1bn shares. Value traded also increased by 7.5% to reach QR9.9bn during July, 2023. Mazaya Real Estate Development topped the monthly volume traded chart with 517.1mn traded shares followed by Qatar Aluminum Manufacturing Company and Salam Inter-national Investment at 394.6mn shares and 287.1mn shares, respectively. On the value traded chart, Qatar National Bank topped with QR1.11bn worth of trades during the month followed by Industries Qatar and Masraf Al Rayan at QR683m and QR651.4m respectively. (Peninsula Qatar)
  • 5. qnbfs.com Page 5 of 8 Qatar Stock Exchange Top Gainers Top Decliners Source: Qatar Stock Exchange (QSE) Source: Qatar Stock Exchange (QSE) Most Active Shares by Value (QR Million) Most Active Shares by Volume (Million) Source: Qatar Stock Exchange (QSE) Source: Qatar Stock Exchange (QSE) Investor Trading Percentage to Total Value Traded Net Traded Value by Nationality (QR Million) Source: Qatar Stock Exchange (QSE) Source: Qatar Stock Exchange (QSE) 14.8% 4.1% 2.8% 2.4% 2.4% 0.0% 6.0% 12.0% 18.0% Dlala Brokerage & Investment Holding Company Damaan Islamic Insurance Company Qatar Islamic Bank Qatar Industrial Manufacturing Company Inma Holding -5.9% -4.5% -4.2% -3.9% -3.8% -9.0% -6.0% -3.0% 0.0% Qatar Cinema & Film Distribution Company QLM Life & Medical Insurance Company Salam International Investment Limited Qatar Aluminium Manufacturing Company Barwa Real Estate Company 194.3 192.3 188.0 133.0 110.8 0.0 80.0 160.0 240.0 Industries Qatar Dukhan Bank QNB Group Qatar Aluminium Manufacturing Company Masraf Al Rayan 99.8 58.4 45.8 44.3 42.3 0.0 40.0 80.0 120.0 Qatar Aluminium Manufacturing Company Mazaya Qatar Real Estate Development Dukhan Bank Masraf Al Rayan Dlala Brokerage & Investment Holding Company 0% 20% 40% 60% 80% 100% Buy Sell 32.22% 31.63% 29.75% 28.03% 13.00% 14.16% 25.02% 26.17% Qatari Individuals Qatari Institutions Non-Qatari Individuals Non-Qatari Institutions 1,091 670 1,051 710 41 -41 -500 0 500 1,000 1,500 Qatari Non-Qatari Net Investment Total Sold Total Bought
  • 6. qnbfs.com Page 6 of 8 TECHNICAL ANALYSIS OF THE QSE INDEX Source: Bloomberg The QE index closed mostly flat for the week (-0.59% from the week before); it closed at 10,735.6 points. Our thesis has not changed, the recent double-bottom formation (a bullish-reversal price pattern) being tested and we expect the Index to be hovering around the formation’s neckline (around the current levels). A bounce from the current levels means an uptrend will most likely unfold. Our weekly levels of resistance are around the 11,750 level and the support at the 10,000 level. DEFINITIONS OF KEY TERMS USED IN TECHNICAL ANALYSIS RSI (Relative Strength Index) indicator – RSI is a momentum oscillator that measures the speedand change of price movements. The RSI oscillates between 0 to 100. The index is deemed to be overbought once the RSI approaches the 70 level, indicating that a correction is likely. On the other hand, if the RSI approaches 30, it is an indication that the index may be getting oversold and therefore likely to bounce back. MACD (Moving Average Convergence Divergence) indicator – The indicator consists of the MACD line and a signal line. The divergence or the convergence of the MACD line with the signal line indicates the strength in the momentum during the uptrend or downtrend, as the case may be. When the MACD crosses the signal line from below and trades above it, it gives a positive indication. The reverse is the situation for a bearish trend. Candlestick chart – A candlestick chart is a price chart that displays the high, low, open, and close for a security. The ‘body’ of the chart is portion between the open and close price, while the high and low intraday movements form the ‘shadow’. The candlestick may represent any time frame. We use a one-day candlestick chart (every candlestick represents one trading day) in our analysis. Doji candlestick pattern – A Doji candlestick is formed when a security's open and close are practically equal. The pattern indicates indecisiveness, and based on preceding price actions and future confirmation, may indicate a bullish or bearish trend reversal. ShootingStar/Inverted Hammer candlestick patterns – These candlestick patterns have a small real body (open price and close price are near to each other), and a long upper shadow (large intraday movement on the upside). The Shooting Star is a bearish reversal pattern that forms after a rally. The Inverted Hammer looks exactly like a Shooting Star, but forms after a downtrend. Inverted Hammers represent a potential bullish trend reversal.
  • 7. qnbfs.com Page 7 of 8 Source: Bloomberg Company Name Price August 10 % Change Weekly % Change YTD Market Cap. QR Million TTM P/E P/B Div. Yield Qatar National Bank 16.56 (2.59) (8.00) 152,955 11.1 1.8 3.6 Qatar Islamic Bank 20.25 2.79 9.11 47,849 12.1 2.0 3.1 Commercial Bank of Qatar 6.15 (0.81) 23.00 24,891 9.4 1.3 4.1 Doha Bank 1.72 (0.23) (12.14) 5,320 16.5 0.5 4.4 Al Ahli Bank 3.92 (2.03) (2.29) 9,995 13.2 1.5 5.1 Qatar International Islamic Bank 10.23 2.10 (1.63) 15,485 15.3 2.2 3.9 Masraf Al Rayan 2.49 (0.28) (21.38) 23,185 22.4 1.0 4.0 Lesha Bank 1.52 (3.74) 32.75 1,702 23.4 1.5 N/A National Leasing 0.88 0.34 25.00 435 20.8 0.7 3.4 Dlala Holding 1.63 14.79 42.73 310 N/A 1.7 N/A Qatar & Oman Investment 0.87 0.12 57.82 273 N/A 1.1 N/A Islamic Holding Group 5.12 2.40 24.55 290 48.9 1.9 1.0 Dukhan Bank 4.21 (0.47) N/A 22,036 1.9 0.2 3.8 Banking and Financial Services 304,728 Zad Holding 13.65 (2.36) (1.83) 3,923 20.8 2.9 4.3 Qatar German Co. for Medical Devices 2.40 (0.04) 90.93 277 281.4 8.0 N/A Salam International Investment 0.74 (4.15) 20.36 845 25.3 0.6 N/A Baladna 1.53 0.92 (0.07) 2,909 38.1 1.3 N/A Medicare Group 6.15 (0.93) (0.93) 1,731 21.6 1.7 29.3 Qatar Cinema & Film Distribution 3.11 (5.90) (0.13) 195 76.2 1.5 1.9 Qatar Fuel 16.43 0.49 (8.47) 16,336 16.3 1.9 5.5 Widam Food 2.35 (1.71) 15.65 423 N/A 2.5 N/A Mannai Corp. 5.53 (2.30) (27.12) 2,523 N/A 2.6 58.8 Al Meera Consumer Goods 14.10 (0.49) (7.97) 2,905 14.7 1.8 3.1 Consumer Goods and Services 32,066 Qatar Industrial Manufacturing 3.02 2.41 (5.92) 1,435 8.2 0.8 4.3 Qatar National Cement 3.94 (1.01) (18.60) 2,575 11.8 0.9 7.6 Industries Qatar 13.50 (1.32) 5.39 81,675 15.7 2.2 8.1 Qatari Investors Group 1.73 (0.86) 2.49 2,148 12.7 0.7 8.7 Qatar Electricity and Water 18.18 0.78 2.71 19,998 11.3 1.4 5.2 Aamal 0.86 0.47 (11.79) 5,418 15.1 0.7 5.8 Gulf International Services 2.11 1.69 44.41 3,916 13.4 1.1 4.7 Mesaieed Petrochemical Holding 1.93 (2.08) (9.31) 24,234 18.5 1.5 5.7 Estithmar Holding 2.13 (1.84) 18.33 7,251 20.9 1.6 N/A Qatar Aluminum Manufacturing 1.30 (3.91) (14.41) 7,260 9.4 1.1 6.9 Mekdam Holding Group 5.00 0.81 (13.24) 405 12.3 3.9 5.3 Industrials 156,315 Qatar Insurance 2.15 (2.31) 11.96 7,032 N/A 1.3 N/A QLM Life & Medical Insurance 2.71 (4.50) (43.45) 950 12.6 1.7 4.6 Doha Insurance 2.30 1.59 16.22 1,150 9.7 1.0 6.5 Qatar General Insurance & Reinsurance 1.31 0.46 (11.04) 1,143 N/A 0.2 N/A Al Khaleej Takaful Insurance 2.80 (0.04) 21.69 715 11.9 1.3 3.6 Qatar Islamic Insurance 8.90 2.33 2.33 1,335 11.6 3.2 5.1 Damaan Islamic Insurance Company 3.85 4.05 N/A 770 N/A 1.7 4.2 Insurance 13,095 United Development 1.19 0.00 (8.46) 4,214 10.3 0.4 4.6 Barwa Real Estate 2.71 (3.83) (5.60) 10,553 9.1 0.5 6.5 Ezdan Real Estate 1.12 (0.62) 11.49 29,602 1271.1 0.9 N/A Mazaya Qatar Real Estate Development 0.82 (1.09) 17.53 947 23.0 0.9 N/A Real Estate 45,315 Ooredoo 11.15 (1.76) 21.20 35,716 13.3 1.4 3.9 Vodafone Qatar 1.86 (2.98) 17.22 7,854 14.3 1.7 5.4 Telecoms 43,569 Qatar Navigation (Milaha) 10.10 (1.75) (0.49) 11,475 11.3 0.7 3.5 Gulf Warehousing 3.35 (1.18) (17.14) 197 8.2 0.9 3.0 Qatar Gas Transport (Nakilat) 3.92 (1.66) 7.02 21,712 14.7 1.9 3.3 Transportation 33,384 Qatar Exchange 630,212
  • 8. qnbfs.com Contacts QNB Financial Services Co. W.L.L. Contact Center: (+974) 4476 6666 info@qnbfs.com.qa Doha, Qatar Saugata Sarkar, CFA, CAIA Head of Research saugata.sarkar@qnbfs.com.qa Shahan Keushgerian Senior Research Analyst shahan.keushgerian@qnbfs.com.qa Phibion Makuwerere, CFA Senior Research Analyst phibion.makuwerere@qnbfs.com.qa Roy Thomas Senior Research Analyst roy.thomas@qnbfs.com.qa Dana Saif Al Sowaidi Research Analyst dana.alsowaidi@qnbfs.com.qa Disclaimer and Copyright Notice: This publication has been prepared by QNB Financial Services Co. W.L.L. (“QNBFS”) a wholly-owned subsidiary of Qatar National Bank (Q.P.S.C.). QNB FS is regulated by the Qatar Financial Markets Authority and the Qatar Exchange. Qatar National Bank (Q.P.S.C.) is regulated by the Qatar Central Bank. This publication expresses the views and opinions of QNBFS at a given time only. It is not an offer, promotion or recommendation to buy or sell securities or other investments, nor is it intended to constitute legal, tax, accounting, or financial advice. QNBFS accepts no liability whatsoever for any direct or indirect losses arising from use of this report. Any investment decision should depend on the individual circumstances of the investor and be based on specifically engaged investment advice. We therefore strongly advise potential investors to seek independent professional advice before making any investment decision. Although the information in this report has been obtained from sources that QNBFS believes to be reliable, we have not independently verified such information and it may not be accurate or complete. QNBFS does not make any representations or warranties as to the accuracy and completeness of the information it may contain, and declines any liability in that respect. For reports dealing with Technical Analysis, expressed opinions and/or recommendations may be different or contrary to the opinions/recommendations of QNBFS Fundamental Research as a result of depending solely on the historical technical data (price and volume). QNBFS reserves the right to amend the views and opinions expressed in this publication at any time. It may also express viewpoints or make investment decisions that differ significantly from, or even contradict, the views and opinions included in this report. This report may not be reproduced in whole or in part without permission from QNBFS. COPYRIGHT: No part of this document may be reproduced without the explicit written permission of QNBFS. Page 8 of 8