QNBFS Weekly Market Report July 16, 2020
•
0 likes•134 views

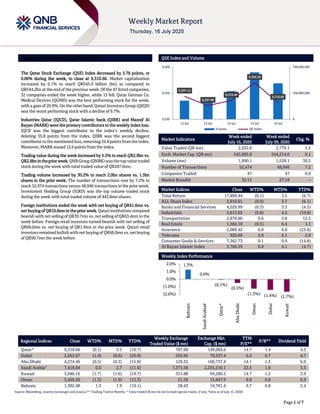
The Qatar Stock Exchange (QSE) Index decreased by 5.78 points, or 0.06% during the week, to close at 9,310.66

Recommended
More Related Content
What's hot
What's hot (20)
Similar to QNBFS Weekly Market Report July 16, 2020
Similar to QNBFS Weekly Market Report July 16, 2020 (20)
More from QNB Group
More from QNB Group (20)
Recently uploaded
Recently uploaded (20)
QNBFS Weekly Market Report July 16, 2020
- 1. ```` Page 1 of 7 Market Review and Outlook QSE Index and Volume The Qatar Stock Exchange (QSE) Index decreased by 5.78 points, or 0.06% during the week, to close at 9,310.66. Market capitalization increased by 0.1% to reach QR545.0 billion (bn) as compared to QR544.2bn at the end of the previous week. Of the 47 listed companies, 32 companies ended the week higher, while 15 fell. Qatar German Co. Medical Devices (QGMD) was the best performing stock for the week, with a gain of 29.9%. On the otherhand, Qatari Investors Group (QIGD) was the worst performing stock with a decline of 9.7%. Industries Qatar (IQCD), Qatar Islamic bank (QIBK) and Masraf Al Rayan (MARK) were the primary contributors to the weekly index loss. IQCD was the biggest contributor to the index’s weekly decline, deleting 35.8 points from the index. QIBK was the second biggest contributor to the mentioned loss, removing 34.8 points from the index. Moreover, MARK erased 12.6 points from the index. Trading value during the week increased by 5.5% to reach QR2.9bn vs. QR2.8bninthepriorweek. QNBGroup(QNBK)wasthetopvaluetraded stock during the week with total traded value of QR287.6mn. Trading volume increased by 30.2% to reach 2.0bn shares vs. 1.5bn shares in the prior week. The number of transactions rose by 7.2% to reach 52,474 transactions versus 48,946 transactions in the prior week. Investment Holding Group (IGRD) was the top volume traded stock during the week with total traded volume of 443.8mn shares. Foreign institutions ended the week with net buying of QR41.6mn vs. net buying of QR10.8mn in the prior week. Qatari institutions remained bearish with net selling of QR39.7mn vs. net selling of QR63.4mn in the week before. Foreign retail investors turned bearish with net selling of QR68.0mn vs. net buying of QR1.9mn in the prior week. Qatari retail investors remainedbullishwithnet buyingof QR66.0mnvs. net buying of QR50.7mn the week before. Market Indicators Week ended July 16, 2020 Week ended July 09, 2020 Chg. % Value Traded (QR mn) 2,932.6 2,779.1 5.5 Exch. Market Cap. (QR mn) 545,005.8 544,214.0 0.1 Volume (mn) 1,990.1 1,528.1 30.2 Number of Transactions 52,474 48,946 7.2 Companies Traded 47 47 0.0 Market Breadth 32:15 27:18 – Market Indices Close WTD% MTD% YTD% Total Return 17,899.44 (0.1) 3.5 (6.7) ALL Share Index 2,910.61 (0.0) 3.7 (6.1) Banks and Financial Services 4,029.99 (0.3) 3.3 (4.5) Industrials 2,613.92 (0.8) 4.2 (10.8) Transportation 2,870.60 0.6 5.8 12.3 Real Estate 1,582.10 (0.5) 6.4 1.1 Insurance 2,089.42 6.0 6.0 (23.6) Telecoms 920.69 2.8 6.1 2.9 Consumer Goods & Services 7,362.73 0.1 0.9 (14.8) Al Rayan Islamic Index 3,766.59 0.9 4.1 (4.7) Weekly Index Performance Regional Indices Close WTD% MTD% YTD% Weekly Exchange Traded Value ($ mn) Exchange Mkt. Cap. ($ mn) TTM P/E** P/B** Dividend Yield Qatar* 9,310.66 (0.1) 3.5 (10.7) 787.68 149,004.6 14.7 1.4 4.3 Dubai 2,052.67 (1.4) (0.6) (25.8) 255.95 79,537.4 6.2 0.7 4.7 Abu Dhabi 4,274.46 (0.5) (0.3) (15.8) 129.32 160,737.4 14.1 1.3 6.0 Saudi Arabia# 7,418.04 0.0 2.7 (11.6) 7,371.56 2,255,210.1 22.5 1.8 3.5 Kuwait 5,046.16 (1.7) (1.6) (19.7) 551.88 94,280.5 14.7 1.2 3.9 Oman 3,450.20 (1.3) (1.9) (13.3) 21.58 15,847.9 9.8 0.8 6.9 Bahrain 1,302.48 1.3 1.9 (19.1) 28.43 19,781.4 9.7 0.8 5.4 Source: Bloomberg, country exchanges and Zawya (** Trailing Twelve Months; * Value traded ($ mn) do not include special trades, if any; #Data as of July 15, 2020) 9,337.12 9,297.80 9,319.40 9,394.59 9,310.66 0 350,000,000 700,000,000 9,240 9,350 9,460 12-Jul 13-Jul 14-Jul 15-Jul 16-Jul Volume QE Index 1.3% 0.0% (0.1%) (0.5%) (1.3%) (1.4%) (1.7%) (2.0%) (1.0%) 0.0% 1.0% 2.0% Bahrain SaudiArabia# Qatar* AbuDhabi Oman Dubai Kuwait
- 2. Page 2 of 7 News Economic /Corporate News Qatar wins air blockade case at top UN court – The UN's highest court for disputes between countries sided with Qatar Tuesday in its legal fight with several Gulf states that imposed an air blockade against Doha. The International Court of Justice's 16- judge panel ruled that appeals filed by Qatar's neighbors against several decisions of the International Civil Aviation Organization (ICAO) should be dismissed. The court also confirmed that it was the ICAO that has jurisdiction in the airspace row. Qatar objected to the closing of the airspace in a complaint to the ICAO, and that case continues. Qatar has limited airspace and has had to rely on that of Iran. (Gulf- Times.com) Cabinet: ICJ verdict reaffirms integrity of Qatar’s legal stance – The Cabinet has welcomed the ruling by the International Court of Justice (ICJ) rejecting two appeals by Saudi Arabia, the UAE, Bahrain and Egypt on the jurisdiction of the International Civil Aviation Organization (ICAO) over Qatari claims. The Cabinet, chaired by Prime Minister and Minister of Interior HE Sheikh Khalid bin Khalifa bin Abdulaziz Al Thani on Wednesday via video conference, said the ICJ ruling reaffirms the integrity of the legal position of Qatar on the issue of the unjust blockade imposed by the four countries in clear violation of international law, international agreements and the foundations and rules of solidarity and regional cooperation. The Cabinet also praised the achievement of Qatar, as it continued to lead the list of the safest and most crime-free countries in the world, according to Numbeo during the first half of this year. The Cabinet said this important global achievement, which builds on the high rankings achieved by the country from 2015 to 2019, was due to the directives of HH The Amir of State of Qatar Sheikh Tamim bin Hamad Al Thani and his wise policy. The achievement is also a result of the comprehensive security strategy of the Ministry of Interior based on the Qatar National Vision 2030. (Qatar Tribune) Qatar’s CPI inflation falls 3.41% YoY in June – Qatar's cost of living, based on consumer price index (CPI), fell 3.41% YoY this June; reflecting the weakened demand, especially for recreation, transport and clothing, owing to the pandemic, according to the Planning and Statistics Authority (PSA). Nevertheless, the country's CPI inflation rose by a marginal 0.26% in the review period MoM, mainly on account of higher prices for food and beverages. The index of recreation and culture, which has a 11.13% weight in the CPI basket, plunged 16.17% and 6.06% YoY and MoM respectively in June this year. The index of transport, which has a 14.59% weight, tanked 4.56% on a yearly basis; even as it grew 3.22% on a monthly basis this June. The sector has the direct linkage to the dismantling of administered prices in petrol and diesel. In June 2020, the price of super, premium gasoline and diesel witnessed a YoY 40%, 41% and 43% plunge respectively; even as they remained unchanged MoM. The index of housing, water, electricity and other fuels – with a weight of 21.17% in the CPI basket – saw a 3.62% contraction on a yearly basis; whereas it treaded a flat path MoM this June. The CPI of June 2020 excluding “housing, water, electricity, gas and other fuels, fell 3.26% YoY; while it rose 0.33% on monthly basis. Communication, which carries a 5.23% weight, saw its group index shrank 3.26% on yearly basis, but treaded a flat course on monthly basis in June 2020. (Gulf-Times.com) FocusEconomics: Qatar’s economy likely to grow 3.4% in 2021 – Qatar’s economy is expected to grow 3.4% in 2021 as a strong fiscal stimulus package to support the non-oil private sector should cushion the downturn being witnessed due to the COVID-19 pandemic, FocusEconomics has said in its latest report. The report noted that solid external buffers and favorable debt dynamics allow for a robust response to limit the fiscal impact of the pandemic. The FocusEconomics Consensus Forecast-Middle East & North Africa for July report, however, said that that the country’s economy is expected to contract in 2020, which is up 0.1 percentage points from last month’s forecast, before growth of 3.4% in 2021. FocusEconomics panelists see a 2.8% contraction in GDP in 2020, which is up 0.1 percentage points from last month’s forecast. “The economy likely remained depressed in the second quarter, as the full effects of the lockdown and travel restrictions were felt. Since May, containment measures have been gradually eased, but international travel is expected to remain restricted until at least August 1 that does not bode well for the tourism and retail sectors. The lockdown will cripple the tourism sector for the most of the year, while depressed energy prices will weigh heavily on government finances and the external sector. Nevertheless, a strong fiscal stimulus package to support the non-oil private sector should cushion the downturn,” the report said. Consumer prices fell 3.1% in annual terms in May, matching April’s fall, as COVID-19 dragged on. “Consumer prices should drop on average this year due to the stark fall in domestic demand. Our panelists see consumer prices falling 0.6% in 2020, which is down 0.2 percentage points from last month’s forecast. In 2021, our panel sees inflation averaging 1.7%,” the report said. According to the annual data released as part of the report, the overnight lending rate in the country would continue to rise from the current level of 2.5% and reach up to 4.24% by 2024. The Qatari Riyal will continue to be pegged at $3.64 in the years to come, the report said. According to FocusEconomics, Qatar’s public debt (as a percentage of GDP) has been forecast to fall to 49.4 from 66.8 this year. The country’s public debt as a percentage of the GDP will fall continuously over the next four years, the researcher said. It is projected at 63 next year, 57.9 (in 2022) and 53.6 in 2023. Qatar’s GDP has been estimated to reach $220bn in 2024 from $166bn this year. Next year, it will be $181bn, followed by $194bn (2022) and $207bn in 2023. GDP per capita, FocusEconomics said, has been estimated to reach $79,060 in 2024 from $60,256 this year. GDP per capita next year will be $65,369, followed by $70,110 in 2022 and $74,596 in 2023. (Qatar Tribune, Gulf- Times.com) KPMG Qatar: Banks should have three-pronged strategy to transition away from Libor – Banks in Qatar should have an initial three-pronged transition strategy as regulators across the globe strategize moving away from Libor (London Interbank
- 3. Page 3 of 7 Offered Rate) on which 25% of their financial products are linked, according to KPMG Qatar, a global consultant. “In Qatar, it is estimated that about one-quarter of all the financial products in banks reference Libor,” Shubhadip Bhattacharya, Financial Risk Management Lead, KPMG Qatar, said in an article. Libor plays a key role in the financial markets and underpins trillions of dollars in financial products. However, regulators globally have signaled that firms should transition away from Libor to alternative overnight RFRs (risk-free rates) before December 2021, he said. Cautioning that the transition will likely trigger an upheaval within financial institutions (FIs) worldwide, he said due to its ubiquitous nature, transitioning will require careful considerations to limit adverse impacts on their (FIs’) profitability, customer relations and reputation. Highlighting that across the GCC, regulators are preparing for the transition away from Libor and are establishing working groups to discuss the challenges; he said it is unclear yet how the central banks would deal with country-specific inter-bank offered rates such Qibor (Qatar’s inter-bank offered rate). Given their exposure to Libor-based products, banks in Europe and the US could be leading with the implementation of their transition programs, Bhattacharya said, adding the transition path is expected to be similar across jurisdictions and has three initial steps. “Banks in Qatar could therefore leverage the approach taken by their international counterparts,” he said, adding an internal working group could be established including key stakeholders across the bank. (Gulf-Times.com) Building permit issuance rises 111% MoM in June – The number of building permits issued in June by municipalities in Qatar has increased by 111% compared to previous month, according to data released by the Planning and Statistics Authority (PSA). The total number of permits issued by the municipalities reached 572 in June, compared to 271 in May this year. Building completion certificates witnessed a rise of 103% in June compared to May. Building permits and building completion certificates data is of particular importance as it is considered an indicator for the performance of the construction sector which in turn occupies a significant position in the national economy. (Peninsula Qatar) Oxford Economics: Qatar demand growth seen picking up in 2021 on strong fundamentals – Qatar’s relatively strong fiscal position, planned infrastructure spending for the 2022 World Cup and ongoing benefits for public sector workers should underpin recovery in the country’s demand growth in 2021, Oxford Economics has said in a report. Taking note of the weak oil and gas prices, Oxford Economics said, “This is being exacerbated sharply this year by the impact of coronavirus.” In its ‘economic risk evaluation’, the researcher said Qatar's overall economic risk score of 3.8 is low, well below the MENA average of 5.3. The pace of growth has slowed since 2012, because of the moratorium on North Field gas expansion and then since 2014 because of lower oil prices and associated fiscal austerity. Growth disappointed in 2018 despite improved oil prices and turned negative in 2019. Activity may slide further as the coronavirus pandemic hits and fiscal policy retrenches amid a decline in revenues, it said. In terms of market demand, the demand risk score of 4.0 (given by Oxford Economics) is below the MENA average of 5.2, reflecting what it said, “Qatar's very high per capita income, large government reserves and lack of overheating. Trade credit risk – a measure of private sector repayment risk – remains very low in Qatar by regional standards at 3.0, compared with the regional average of 6.1.” (Gulf-Times.com) UDCD enters Financing Agreement for developing residential villas complexes in Floresta Gardens – United Development Company (UDCD) has entered in to Financing Agreement for the project of developing residential villas complexes and infrastructure in Floresta Gardens Area at The Pearl Qatar, and accordingly UDCD has informed the following. (1) The objective to be achieved from the operation is to develop the project of residential villas complexes and infrastructure in the Floresta Gardens area, at The Pearl Island, Qatar, (2) The total value of the operation is QR353mn, (3) The method of payment and the sources of financing of the operation are installments over a period of approximately 10 years, (4) The agreement was entered between UDCD and Al Rayan Bank for financing the project, (5) There is no impact on UDCD’ financial position due to the completion of this process, (6) The advantages is to contribute into the completion of developing the project of the Residential Villas Complexes and Infrastructure in the Floresta Gardens at The Pearl Qatar without risks, and (7) There is no conflict of interest between the related parties in the process. Also, there is no change in ownership ratios before and after the completion of the process. (QSE)
- 4. Page 4 of 7 Qatar Stock Exchange Top Gainers Top Decliners Source: Qatar Stock Exchange (QSE) Source: Qatar Stock Exchange (QSE) Most Active Shares by Value (QR Million) Most Active Shares by Volume (Million) Source: Qatar Stock Exchange (QSE) Source: Qatar Stock Exchange (QSE) Investor Trading Percentage to Total Value Traded Net Traded Value by Nationality (QR Million) Source: Qatar Stock Exchange (QSE) Source: Qatar Stock Exchange (QSE) 29.9% 16.5% 13.2% 12.2% 11.9% 0.0% 12.0% 24.0% 36.0% Qatari German Company for Medical Devices Qatar Aluminium Manufacturing Company Baladna Qatar Cinema & Film Distribution Company Vodafone Qatar -9.7% -6.7% -6.3% -4.2% -3.6% -12.0% -8.0% -4.0% 0.0% Qatari Investors Group Dlala Brokerage & Investment Holding Company Al Khaleej Takaful Insurance Company United Development Company Industries Qatar 287.6 236.1 225.3 183.1 174.6 0.0 105.0 210.0 315.0 QNB Group Investment Holding Group Qatar Aluminium Manufacturing Company Baladna Barwa Real Estate Company 443.8 249.9 127.2 124.2 114.2 0.0 150.0 300.0 450.0 Investment Holding Group Qatar Aluminium Manufacturing Company Mazaya Qatar Real Estate Development United Development Company Salam International Investment Limited 0% 20% 40% 60% 80% 100% Buy Sell 55.26% 53.01% 18.41% 19.77% 14.98% 17.30% 11.35% 9.93% Qatari Individuals Qatari Institutions Non-Qatari Individuals Non-Qatari Institutions 2,161 772 2,134 798 26 -26 -500 0 500 1,000 1,500 2,000 2,500 Qatari Non-Qatari Net Investment Total Sold Total Bought
- 5. Page 5 of 7 TECHNICAL ANALYSIS OF THE QSE INDEX Source: Bloomberg The QSE Index closed flattish, but in the red, losing only 0.06% from the week before and finished at the 9,310.66 level. The Index bounced off the corrective uptrend channel, but it remains below its 200-day moving average; it should move above that level before the index becomes positive in the medium term. The general index needs to remain above the 9,000 to hold its ground. DEFINITIONS OF KEY TERMS USED IN TECHNICAL ANALYSIS RSI (Relative Strength Index) indicator – RSI is a momentum oscillator that measures the speedand change of price movements. The RSI oscillates between 0 to 100. The index is deemed to be overbought once the RSI approaches the 70 level, indicating that a correction is likely. On the other hand, if the RSI approaches 30, it is an indication that the index may be getting oversold and therefore likely to bounce back. MACD (Moving Average Convergence Divergence) indicator – The indicator consists of the MACD line and a signal line. The divergence or the convergence of the MACD line with the signal line indicates the strength in the momentum during the uptrend or downtrend, as the case may be. When the MACD crosses the signal line from below and trades above it, it gives a positive indication. The reverse is the situation for a bearish trend. Candlestick chart – A candlestick chart is a price chart that displays the high, low, open, and close for a security. The ‘body’ of the chart is portion between the open and close price, while the high and low intraday movements form the ‘shadow’. The candlestick may represent any time frame. We use a one-day candlestick chart (every candlestick represents one trading day) in our analysis. Doji candlestick pattern – A Doji candlestick is formed when a security's open and close are practically equal. The pattern indicates indecisiveness, and based on preceding price actions and future confirmation, may indicate a bullish or bearish trend reversal. ShootingStar/Inverted Hammer candlestick patterns – These candlestick patterns have a small real body (open price and close price are near to each other), and a long upper shadow (large intraday movement on the upside). The Shooting Star is a bearish reversal pattern that forms after a rally. The Inverted Hammer looks exactly like a Shooting Star, but forms after a downtrend. Inverted Hammers represent a potential bullish trend reversal.
- 6. Page 6 of 7 Source: Bloomberg Company Name Price July 16 % Change WTD % Change YTD Market Cap. QR Million TTM P/E P/B Div. Yield Qatar National Bank 18.18 0.17 (11.70) 167,918 14.4 2.4 3.3 Qatar Islamic Bank 15.60 (2.62) 1.76 36,862 13.0 2.2 3.4 Commercial Bank of Qatar 3.80 0.56 (19.15) 15,380 8.9 0.9 5.3 Doha Bank 2.40 3.90 (5.14) 7,441 13.5 0.9 N/A Al Ahli Bank 3.18 0.95 (4.60) 7,726 11.4 1.3 4.5 Qatar International Islamic Bank 8.25 0.98 (14.77) 12,488 14.2 2.2 5.2 Masraf Al Rayan 3.88 (1.32) (1.97) 29,115 13.3 2.2 5.8 Al Khaliji Bank 1.60 (0.68) 22.06 5,756 9.6 1.1 4.7 Qatar First Bank 1.24 4.27 52.08 871 N/A 1.7 N/A National Leasing 0.89 7.23 26.24 440 31.9 0.6 5.6 Dlala Holding 1.40 (6.67) 129.13 398 N/A 2.1 N/A Qatar & Oman Investment 0.68 4.13 1.64 214 30.0 0.8 2.9 Islamic Holding Group 3.90 4.67 105.26 221 276.0 1.6 N/A Banking and Financial Services 284,830 Zad Holding 14.95 0.88 8.18 3,543 17.2 2.2 5.7 Qatar German Co. for Medical Devices 1.77 29.95 203.44 204 N/A 7.2 N/A Salam International Investment 0.45 (1.32) (13.15) 513 N/A 0.5 N/A Baladna 1.70 13.18 70.00 3,232 N/A 1.5 1.2 Medicare Group 7.00 1.85 (17.14) 1,971 27.7 2.1 25.7 Qatar Cinema & Film Distribution 3.31 12.20 50.45 208 46.2 0.2 3.0 Qatar Fuel 15.98 (1.84) (30.22) 15,888 16.9 2.0 5.0 Qatar Meat and Livestock 6.95 2.19 2.81 1,251 12.6 4.0 4.3 Mannai Corp. 3.01 7.42 (2.27) 1,373 10.5 0.5 6.7 Al Meera Consumer Goods 18.93 4.07 23.73 3,786 19.7 3.0 4.5 Consumer Goods and Services 31,969 Qatar Industrial Manufacturing 2.76 1.10 (22.69) 1,312 14.0 0.9 5.4 Qatar National Cement 3.64 (2.36) (35.58) 2,379 16.7 0.8 8.2 Industries Qatar 7.91 (3.59) (23.10) 47,825 23.0 1.5 5.1 Qatari Investors Group 2.01 (9.73) 12.46 2,503 23.5 0.9 2.7 Qatar Electricity and Water 16.50 1.91 2.55 18,150 12.8 2.2 4.7 Aamal 0.76 2.72 (7.01) 4,763 15.5 0.6 5.3 Gulf International Services 1.63 (1.87) (5.29) 3,027 109.2 0.9 N/A Mesaieed Petrochemical Holding 2.10 0.62 (16.33) 26,383 27.1 1.8 3.3 Invesment Holding Group 0.53 3.35 (6.91) 436 8.8 0.5 N/A Qatar Aluminum Manufacturing 0.92 16.46 17.80 5,134 N/A 0.9 1.1 Industrials 111,911 Qatar Insurance 2.10 9.72 (33.54) 6,859 69.8 1.0 7.1 Doha Insurance 1.03 0.29 (14.42) 514 11.0 0.5 7.8 Qatar General Insurance & Reinsurance 2.23 (0.04) (9.43) 1,950 N/A 0.4 N/A Al Khaleej Takaful Insurance 1.69 (6.28) (15.65) 431 13.7 0.9 3.0 Qatar Islamic Insurance 6.28 1.23 (6.05) 941 12.8 2.7 6.0 Insurance 10,694 United Development 1.17 (4.18) (23.16) 4,136 17.1 0.4 4.3 Barw a Real Estate 3.26 1.09 (8.05) 12,666 10.4 0.6 6.1 Ezdan Real Estate 1.34 0.90 118.37 35,623 3740.9 1.1 N/A Mazaya Qatar Real Estate Development 0.88 2.08 22.95 1,023 36.1 0.8 N/A Real Estate 53,448 Ooredoo 6.72 (0.12) (5.16) 21,509 12.8 1.0 3.7 Vodafone Qatar 1.29 11.85 11.47 5,466 37.3 1.3 3.9 Telecoms 26,975 Qatar Navigation (Milaha) 5.99 (0.17) (1.80) 6,860 13.1 0.5 5.0 Gulf Warehousing 5.10 0.71 (6.93) 299 12.4 1.7 3.9 Qatar Gas Transport (Nakilat) 2.77 1.17 15.77 15,330 14.3 2.5 3.6 Transportation 22,489 Qatar Exchange 545,006
- 7. Contacts Saugata Sarkar, CFA, CAIA Shahan Keushgerian Zaid al-Nafoosi , CMT, CFTe Head of Research Senior Research Analyst Senior Research Analyst Tel: (+974) 4476 6534 Tel: (+974) 4476 6509 Tel: (+974) 4476 6535 saugata.sarkar@qnbfs.com.qa shahan.keushgerian@qnbfs.com.qa zaid.alnafoosi@qnbfs.com.qa Mehmet Aksoy, PhD QNB Financial Services Co. W.L.L. Senior Research Analyst Contact Center: (+974) 4476 6666 Tel: (+974) 4476 6589 PO Box 24025 mehmet.aksoy@qnbfs.com.qa Doha, Qatar Disclaimer and Copyright Notice: This publication has been prepared by QNB Financial Services Co. W.L.L. (“QNB FS”) a wholly-owned subsidiary of Qatar National Bank (Q.P.S.C.). QNB FS is regulated by the Qatar Financial Markets Authority and the Qatar Exchange. Qatar National Bank (Q.P.S.C.) is regulated by the Qatar Central Bank. This publication expresses the views and opinions of QNB FS at a given time only. It is not an offer, promotion or recommendation to buy or sell securities or other investments, nor is it intended to constitute legal, tax, accounting, or financial advice. QNB FS accepts no liability whatsoever for any direct or indirect losses arising from use of this report. Any investment decision should depend on the individual circumstances of the investor and be based on specifically engaged investment advice. We therefore strongly advise potential investors to seek independent professional advice before making any investment decision. Although the information in this report has been obtained from sources that QNB FS believes to be reliable, we have not independently verified such information and it may not be accurate or complete. QNB FS does not make any representations or warranties as to the accuracy and completeness of the information it may contain, and declines any liability in that respect. For reports dealing with Technical Analysis, expressed opinions and/or recommendations may be different or contrary to the opinions/recommendations of QNB FS Fundamental Research as a result of depending solely on the historical technical data (price and volume). QNB FS reserves the right to amend the views and opinions expressed in this publication at any time. It may also express viewpoints or make investment decisions that differ significantly from, or even contradict, the views and opinions included in this report. This report may not be reproduced in whole or in part without permission from QNB FS COPYRIGHT: No part of this document may be reproduced without the explicit written permission of QNB FS. Page 7 of 7