QNBFS Weekly Market Report March 18, 2021
•
0 likes•114 views

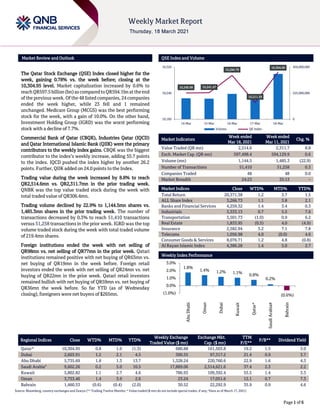
The Qatar Stock Exchange (QSE) Index closed higher for the week, gaining 0.78% vs. the week before; closing at the 10,304.95 level.

Recommended
Recommended
More Related Content
What's hot
What's hot (20)
Similar to QNBFS Weekly Market Report March 18, 2021
Similar to QNBFS Weekly Market Report March 18, 2021 (20)
More from QNB Group
More from QNB Group (20)
Recently uploaded
Recently uploaded (20)
QNBFS Weekly Market Report March 18, 2021
- 1. ``````` Page 1 of 6 Market Review and Outlook QSE Index and Volume The Qatar Stock Exchange (QSE) Index closed higher for the week, gaining 0.78% vs. the week before; closing at the 10,304.95 level. Market capitalization increased by 0.6% to reachQR597.5billion(bn)ascomparedtoQR594.1bnattheend of the previous week. Of the 48 listed companies, 24 companies ended the week higher, while 23 fell and 1 remained unchanged. Medicare Group (MCGS) was the best performing stock for the week, with a gain of 10.0%. On the other hand, Investment Holding Group (IGRD) was the worst performing stock with a decline of 7.7%. Commercial Bank of Qatar (CBQK), Industries Qatar (IQCD) and Qatar International Islamic Bank (QIIK) were the primary contributors to the weekly index gains. CBQK was the biggest contributor to the index’s weekly increase, adding 55.7 points to the index. IQCD pushed the index higher by another 26.2 points. Further, QIIK added on 24.0 points to the Index. Trading value during the week increased by 8.8% to reach QR2,514.6mn vs. QR2,311.7mn in the prior trading week. QNBK was the top value traded stock during the week with total traded value of QR306.4mn. Trading volume declined by 22.9% to 1,144.5mn shares vs. 1,485.3mn shares in the prior trading week. The number of transactions decreased by 0.3% to reach 51,410 transactions versus 51,258 transactions in the prior week. IGRD was the top volume traded stock during the week with total traded volume of 219.4mn shares. Foreign institutions ended the week with net selling of QR98mn vs. net selling of QR77mn in the prior week. Qatari institutions remained positive with net buying of QR63mn vs. net buying of QR19mn in the week before. Foreign retail investors ended the week with net selling of QR24mn vs. net buying of QR22mn in the prior week. Qatari retail investors remained bullish with net buying of QR59mn vs. net buying of QR36mn the week before. So far YTD (as of Wednesday closing), foreigners were net buyers of $265mn. Market Indicators Week ended Mar 18, 2021 Week ended Mar 11, 2021 Chg. % Value Traded (QR mn) 2,514.6 2,311.7 8.8 Exch. Market Cap. (QR mn) 597,498.4 594,129.9 0.6 Volume (mn) 1,144.5 1,485.3 (22.9) Number of Transactions 51,410 51,258 0.3 Companies Traded 48 48 0.0 Market Breadth 24:23 35:13 – Market Indices Close WTD% MTD% YTD% Total Return 20,371.38 1.2 3.7 1.5 ALL Share Index 3,266.73 1.1 3.8 2.1 Banks and Financial Services 4,259.32 1.4 3.4 0.3 Industrials 3,333.13 0.7 5.5 7.6 Transportation 3,501.73 (1.0) 0.9 6.2 Real Estate 1,833.95 (0.5) 4.0 (4.9) Insurance 2,582.94 3.2 7.1 7.8 Telecoms 1,056.98 4.0 (0.0) 4.6 Consumer Goods & Services 8,076.71 1.2 4.8 (0.8) Al Rayan Islamic Index 4,386.28 1.4 5.0 2.7 Weekly Index Performance Regional Indices Close WTD% MTD% YTD% Weekly Exchange Traded Value ($ mn) Exchange Mkt. Cap. ($ mn) TTM P/E** P/B** Dividend Yield Qatar* 10,304.95 0.8 1.6 (1.3) 680.88 161,503.8 19.2 1.5 3.0 Dubai 2,603.91 1.2 2.1 4.5 300.55 97,317.2 21.4 0.9 3.7 Abu Dhabi 5,735.69 1.8 1.3 13.7 1,328.24 220,760.6 22.9 1.6 4.3 Saudi Arabia# 9,602.26 0.2 5.0 10.5 17,889.06 2,514,621.6 37.4 2.3 2.2 Kuwait 5,802.82 1.1 2.7 4.6 786.93 109,392.4 55.5 1.4 3.3 Oman 3,753.46 1.4 3.9 2.6 23.24 17,051.6 12.1 0.7 7.3 Bahrain 1,460.53 (0.6) (0.4) (2.0) 30.52 22,292.9 35.9 0.9 4.6 Source: Bloomberg, country exchanges and Zawya (** Trailing Twelve Months; * Value traded ($ mn) do not include special trades, if any; #Data as of March 17, 2021) 10,240.68 10,241.47 10,294.79 10,211.39 10,304.95 0 225,000,000 450,000,000 10,160 10,240 10,320 14-Mar 15-Mar 16-Mar 17-Mar 18-Mar Volume QE Index 1.8% 1.4% 1.2% 1.1% 0.8% 0.2% (0.6%) (1.0%) 0.0% 1.0% 2.0% 3.0% Abu Dhabi Oman Dubai Kuwait Qatar* Saudi Arabia# Bahrain
- 2. Page 2 of 6 Economic, Market & Corporate News BLDN’s net profit rises QoQ to QR39.3mn in 4Q2020 from QR29.0mn in 3Q2020 – Baladna (BLDN) posted net profit of QR39.3mn as compared to QR29.0mn in 3Q2020. The company’s revenue came in at QR190.6mn in 4Q2020 versus QR182.3mn in 3Q2020. Net profit margin for the fourth quarter reached 20.6%. BLDN announced its result for the period from December 2, 2019 (establishment date) to December 31, 2020 (approximately 13 months). Despite the various challenges related to the COVID- 19 pandemic, BLDN was able to achieve significant growth in its revenue and net profit. During the 13 months period ended December 31, 2020, revenue generated was QR814.8mn resulting in a reported net profit of QR152.1mn. Correspondingly, the company achieved a strong net profit margin for the period of approximately 18.7%. The EPS remained at QR0.082 for the period. Product portfolio management remained paramount as Baladna continued to focus on introducing innovate and value accretive product. The consumer insights program, launched in 2020, coupled with new product development program, allowed for the identification of market trends and customer preferences in an accelerated and more informative manner, resulting in the successful launch of 96 new SKUs and delisting of 18 SKUs to optimize Baladna’s yield. Overall, Baladna`s product portfolio grew by 41% during the corresponding period. Baladna has continued to achieve operational efficiencies, across the supply chain. In particular, the farming division has witnessed significantly productivity gains achieving an average daily milk yield of 36.6 liter per cow for the period. (QNB FS Research, QSE, Gulf-Times.com) MCCS's reports net profit of QR213.7mn in 4Q2020 – Mannai Corporation (MCCS) reported net profit of QR213.7mn in 4Q2020 as compared to net loss of QR162.8mn in 4Q2019 and net profit of QR3.4mn in 3Q2020.The company's Revenue came in at QR3,856.8mn in 4Q2020, which represents an increase of 26.0% YoY (+20.9% QoQ). In FY2020, the net profit came in at QR14.31mn as compared to net loss of QR81.8mn in FY2019. The earnings per share amounted to QR0.03 in FY2020 as compared to loss per share of QR0.18 in FY2019. The board of directors’ proposed for a cash dividend payment of Qatari Dirham 1 per share, being 1% of the nominal share value. (QSE) ERES posts net profit of QR139.4mn vs. net loss of QR199.9mn in 4Q2019 – Ezdan Holding Group (ERES) reported net profit of QR139.4mn in 4Q2020 as compared to net loss of QR199.9mn in 4Q2019 and net profit of QR36.2mn in 3Q2020 (+285.1% QoQ). The company's rental income came in at QR293.7mn in 4Q2020, which represents a decrease of 5.2% YoY. However, on QoQ basis Rental Income rose 1.7%. In FY2020, ERES recorded net profit of QR347.9mn as compared to QR309.3mn in FY2019. EPS amounted to QR0.013 in FY2020 as compared to QR0.012 in FY2019. The Group generated revenues of QR1.4bn, compared to QR1.67bn for a year earlier. The board of directors has recommended no dividends for the financial year ended December 31, 2020. The Board of Directors of Ezdan Holding Group convened, and ratified the annual financial statements for the year ended December 31, 2020. ERES has also declared that Investor Relations’ Conference will be held via a Conference Call to review the financial results of the company for the year ended December 31, 2020 and the overall corporate performance on March 31 at 2pm. (QSE, Peninsula Qatar) IGRD records FY2020 net profits of QR23.4mn compared to 2019’s QR55.1mn– Investment Holding Group (IGRD) reported net loss of QR3.4mn in 4Q2020 as compared to net profit of QR20.5mn in 4Q2019 and net profit of QR11.3mn in 3Q2020, versus our net profit estimate of QR10.2mn. The company's revenue came in at QR83.3mn in 4Q2020, which represents a decrease of 30.9% YoY (-4.5% QoQ). In FY2020, the net profit came in at QR23.4mn as compared to QR55.1mn in FY2019. EPS amounted to QR0.028 in FY2020 as compared to QR0.066 in FY2019.The board has recommended non-distribution of dividends for this year. (QNB FS Research, QSE) MoPH to manage new insurance system – The Shura Council held its regular weekly meeting via videoconferencing under the chairmanship of HE the Speaker Ahmed bin Abdullah bin Zaid Al-Mahmoud, at the Council's headquarters. During its session, the Council discussed a draft law on health care services in the country, which included 47 articles and 6 chapters and stipulated the provision of health care services to citizens in government health facilities free of charge. Under the draft law, the Ministry of Public Health (MoPH) will set standards for the provision of health care services in government and private health facilities as well as compulsory health insurance and supervision. It will also provide an integrated, high-quality, efficient and sustainable health system and work on developing and maintaining compulsory health insurance. According to the draft law, health insurance is mandatory to ensure the provision of basic healthcare services to expatriates and visitors to the country. It is also not permissible to issue an entry visa for an expatriate or visitor, renew it, grant or renew a residence permit, and it is not permissible to employ expatriates, except after submitting proof they hold compulsory health insurance for the duration of the stay. The draft law provides for the provision of healthcare services to beneficiaries in emergency situations without requiring them to pay any amount until the danger is overcome even if the service provider is not within the network of healthcare service providers to the beneficiary, and that this does not prejudice the right of the health care service provider to refer to a company insurance, or the employer or the recruiter, as the case may be, to pay the cost of this service. (Gulf- Times.com) 510,000 vaccine doses administered in Qatar – The Ministry of Public Health (MoPH) has announced that 510,000 COVID-19 vaccine doses have been administered since the start of the National Vaccination Program in Qatar. Recent availability of greater quantities of both the Moderna and Pfizer-BioNTech vaccines has helped increase the pace of the vaccination program, with over 100,000 doses being administered each week, meaning that every day around 14,000 of our most vulnerable members of society and essential workers are getting vaccinated and becoming protected against COVID-19, the ministry said in a statement. (Gulf-Times.com)
- 3. Page 3 of 6 Qatar Stock Exchange Top Gainers Top Decliners Source: Qatar Stock Exchange (QSE) Source: Qatar Stock Exchange (QSE) Most Active Shares by Value (QR Million) Most Active Shares by Volume (Million) Source: Qatar Stock Exchange (QSE) Source: Qatar Stock Exchange (QSE) Investor Trading Percentage to Total Value Traded Net Traded Value by Nationality (QR Million) Source: Qatar Stock Exchange (QSE) Source: Qatar Stock Exchange (QSE) 10.0% 9.9% 9.2% 8.2% 7.7% 0.0% 4.0% 8.0% 12.0% Medicare Group Mannai Corporation The Commercial Bank Qatar National Cement Company Qatar Aluminium Manufacturing Company -7.7% -7.4% -7.1% -7.0% -4.2% -9.0% -6.0% -3.0% 0.0% Investment Holding Group Ahli Bank Qatar Navigation Mesaieed Petrochemical Holding Company Islamic Holding Group 306.4 202.5 174.8 166.2 151.7 0.0 105.0 210.0 315.0 QNB Group Qatar Aluminium Manufacturing Company Masraf Al Rayan Investment Holding Group Baladna 219.4 171.1 136.8 90.2 57.1 0.0 80.0 160.0 240.0 Investment Holding Group Qatar Aluminium Manufacturing Company Salam International Investment Limited Baladna Mesaieed Petrochemical Holding Company 0% 20% 40% 60% 80% 100% Buy Sell 38.86% 41.19% 17.61% 20.13% 14.39% 13.42% 29.14% 25.25% Qatari Individuals Qatari Institutions Non-Qatari Individuals Non-Qatari Institutions 1,380 1,064 1,499 945 -119 119 -500 0 500 1,000 1,500 2,000 Qatari Non-Qatari Net Investment Total Sold Total Bought
- 4. Page 4 of 6 TECHNICAL ANALYSIS OF THE QSE INDEX Source: Bloomberg The QE Index gained 0.78% from last week and closed at 10,304.95 last Thursday. The Index remains resilient after it bounced off the 10,000 psychological level and moved above two of its three major moving averages. Our thesis has not changed from last week; we see continuation on the bounce. That been said, we would like to see more traded volumes to strengthen the movement north. Our projected resistance level is around 10,600 points and the support level remains at 10,000 points. DEFINITIONS OF KEY TERMS USED IN TECHNICAL ANALYSIS RSI (Relative Strength Index) indicator – RSI is a momentum oscillator that measures the speedand change of price movements. The RSI oscillates between 0 to 100. The index is deemed to be overbought once the RSI approaches the 70 level, indicating that a correction is likely. On the other hand, if the RSI approaches 30, it is an indication that the index may be getting oversold and therefore likely to bounce back. MACD (Moving Average Convergence Divergence) indicator – The indicator consists of the MACD line and a signal line. The divergence or the convergence of the MACD line with the signal line indicates the strength in the momentum during the uptrend or downtrend, as the case may be. When the MACD crosses the signal line from below and trades above it, it gives a positive indication. The reverse is the situation for a bearish trend. Candlestick chart – A candlestick chart is a price chart that displays the high, low, open, and close for a security. The ‘body’ of the chart is portion between the open and close price, while the high and low intraday movements form the ‘shadow’. The candlestick may represent any time frame. We use a one-day candlestick chart (every candlestick represents one trading day) in our analysis. Doji candlestick pattern – A Doji candlestick is formed when a security's open and close are practically equal. The pattern indicates indecisiveness, and based on preceding price actions and future confirmation, may indicate a bullish or bearish trend reversal. ShootingStar/Inverted Hammer candlestick patterns – These candlestick patterns have a small real body (open price and close price are near to each other), and a long upper shadow (large intraday movement on the upside). The Shooting Star is a bearish reversal pattern that forms after a rally. The Inverted Hammer looks exactly like a Shooting Star, but forms after a downtrend. Inverted Hammers represent a potential bullish trend reversal.
- 5. Page 5 of 6 Source: Bloomberg Company Name Price March 18 % Change WTD % Change YTD Market Cap. QR Million TTM P/E P/B Div. Yield Qatar National Bank 17.40 0.40 (2.41) 160,714 14.6 2.1 2.6 Qatar Islamic Bank 16.20 0.62 (5.32) 38,279 13.5 2.1 2.5 Commercial Bank of Qatar 4.74 9.19 7.73 19,184 17.5 1.1 2.1 Doha Bank 2.24 (3.07) (5.32) 6,948 13.8 0.7 3.3 Al Ahli Bank 3.61 (7.44) 4.73 8,771 12.9 1.4 4.2 Qatar International Islamic Bank 9.01 1.39 (0.42) 13,644 16.4 2.2 3.6 Masraf Al Rayan 4.17 (0.36) (8.06) 31,238 14.3 2.2 4.1 Al Khaliji Bank 2.14 1.71 16.21 7,690 12.3 1.2 3.5 Qatar First Bank 1.81 (1.42) 5.23 1,268 N/A 2.7 N/A National Leasing 1.24 (2.28) 0.00 615 13.5 0.9 2.0 Dlala Holding 1.71 (2.34) (4.62) 486 73.0 2.3 N/A Qatar & Oman Investment 0.89 (1.43) 0.68 281 22.3 0.9 2.2 Islamic Holding Group 4.93 (4.18) (3.73) 279 46.1 2.0 1.0 Banking and Financial Services 289,397 Zad Holding 17.00 0.00 14.02 4,029 20.0 2.6 5.0 Qatar German Co. for Medical Devices 2.97 (0.93) 32.86 343 408.9 10.9 N/A Salam International Investment 0.65 (1.07) (0.15) 743 N/A 0.5 N/A Baladna 1.67 (1.07) (6.87) 3,169 N/A 1.4 1.3 Medicare Group 10.00 10.02 13.12 2,814 33.6 2.7 18.0 Qatar Cinema & Film Distribution 3.80 (0.05) (4.88) 239 50.3 1.7 2.6 Qatar Fuel 17.40 1.34 (6.85) 17,300 22.8 2.1 2.6 Qatar Meat and Livestock 5.75 (1.02) (9.05) 1,035 20.4 2.8 5.2 Mannai Corp. 3.33 9.90 11.00 1,519 N/A 0.7 6.0 Al Meera Consumer Goods 20.65 (1.20) (0.29) 4,130 21.5 2.7 4.1 Consumer Goods and Services 35,321 Qatar Industrial Manufacturing 3.00 4.10 (6.54) 1,425 16.0 0.9 3.3 Qatar National Cement 5.30 8.16 27.71 3,464 23.7 1.1 3.8 Industries Qatar 12.10 1.85 11.32 73,205 37.5 2.2 2.7 Qatari Investors Group 1.81 1.06 0.00 2,252 27.3 0.8 3.3 Qatar Electricity and Water 16.95 (0.12) (5.04) 18,645 16.1 1.9 3.7 Aamal 1.00 0.60 16.84 6,294 51.3 0.8 4.0 Gulf International Services 1.50 (1.96) (12.71) 2,782 N/A 0.9 N/A Mesaieed Petrochemical Holding 1.82 (6.99) (10.89) 22,915 42.6 1.5 3.8 Invesment Holding Group 0.74 (7.70) 24.04 617 26.1 0.7 N/A Qatar Aluminum Manufacturing 1.19 7.69 23.06 6,640 N/A 1.2 2.9 Industrials 138,238 Qatar Insurance 2.50 3.39 5.80 8,162 N/A 1.0 N/A QLM Life & Medical Insurance 4.80 2.24 N/A 1,680 N/A N/A N/A Doha Insurance 2.10 3.04 50.93 1,051 17.4 0.9 3.8 Qatar General Insurance & Reinsurance 2.39 2.66 (10.19) 2,091 15.5 0.4 N/A Al Khaleej Takaful Insurance 2.71 (2.06) 42.83 692 20.3 1.3 1.8 Qatar Islamic Insurance 7.97 6.37 15.51 1,196 15.7 3.0 4.7 Insurance 14,871 United Development 1.54 (1.28) (6.95) 5,453 24.1 0.5 3.2 Barw a Real Estate 3.17 0.13 (6.94) 12,316 10.2 0.6 3.9 Ezdan Real Estate 1.57 (0.32) (11.60) 41,644 505.0 1.3 N/A Mazaya Qatar Real Estate Development 1.21 (1.30) (3.88) 1,405 47.0 1.1 N/A Real Estate 60,818 Ooredoo 6.99 3.10 (7.05) 22,390 20.4 1.0 3.6 Vodafone Qatar 1.68 6.13 25.47 7,101 38.7 1.6 3.0 Telecoms 29,492 Qatar Navigation (Milaha) 7.43 (7.11) 4.75 8,509 140.8 0.6 4.0 Gulf Warehousing 5.05 0.28 (0.86) 296 12.6 1.6 2.0 Qatar Gas Transport (Nakilat) 3.23 0.69 1.54 17,890 15.4 2.5 3.4 Transportation 26,695 Qatar Exchange 597,498
- 6. Contacts QNB Financial Services Co. W.L.L. Contact Center: (+974) 4476 6666 info@qnbfs.com.qa Doha, Qatar Saugata Sarkar, CFA, CAIA Shahan Keushgerian Mehmet Aksoy, PhD Head of Research Senior Research Analyst Senior Research Analyst saugata.sarkar@qnbfs.com.qa shahan.keushgerian@qnbfs.com.qa mehmet.aksoy@qnbfs.com.qa Disclaimer and Copyright Notice: This publication has been prepared by QNB Financial Services Co. W.L.L. (“QNBFS”) a wholly-owned subsidiary of Qatar National Bank (Q.P.S.C.). QNB FS is regulated by the Qatar Financial Markets Authority and the Qatar Exchange. Qatar National Bank (Q.P.S.C.) is regulated by the Qatar Central Bank. This publication expresses the views and opinions of QNBFS at a given time only. It is not an offer, promotion or recommendation to buy or sell securities or other investments, nor is it intended to constitute legal, tax, accounting, or financial advice. QNBFS accepts no liability whatsoever for any direct or indirect losses arising from use of this report. Any investment decision should depend on the individual circumstances of the investor and be based on specifically engaged investment advice. We therefore strongly advise potential investors to seek independent professional advice before making any investment decision. Although the information in this report has been obtained from sources that QNBFS believes to be reliable, we have not independently verified such information and it may not be accurate or complete. QNBFS does not make any representations or warranties as to the accuracy and completeness of the information it may contain, and declines any liability in that respect. For reports dealing with Technical Analysis, expressed opinions and/or recommendations may be different or contrary to the opinions/recommendations of QNBFS Fundamental Research as a result of depending solely on the historical technical data (price and volume). QNBFS reserves the right to amend the views and opinions expressed in this publication at any time. It may also express viewpoints or make investment decisions that differ significantly from, or even contradict, the views and opinions included in this report. This report may not be reproduced in whole or in part without permission from QNBFS. COPYRIGHT: No part of this document may be reproduced without the explicit written permission of QNBFS. Page 6 of 6