QNBFS Weekly Market Report March 05, 2020
•
0 likes•35 views

The Qatar Stock Exchange (QSE) Index decreased by 180.75 points, or 1.90% during the week, to close at 9,309.39

Recommended
Recommended
More Related Content
What's hot
What's hot (20)
Similar to QNBFS Weekly Market Report March 05, 2020
Similar to QNBFS Weekly Market Report March 05, 2020 (20)
More from QNB Group
More from QNB Group (20)
Recently uploaded
Recently uploaded (20)
QNBFS Weekly Market Report March 05, 2020
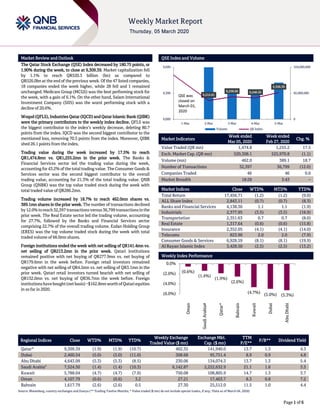
- 1. ```` Page 1 of 6 Market Review and Outlook QSE Index and Volume The Qatar Stock Exchange (QSE) Index decreased by 180.75 points, or 1.90% during the week, to close at 9,309.39. Market capitalization fell by 1.1% to reach QR520.3 billion (bn) as compared to QR526.0bn at the end of the previous week. Of the 47 listed companies, 18 companies ended the week higher, while 28 fell and 1 remained unchanged. Medicare Group (MCGS) was the best performing stock for the week, with a gain of 6.1%. On the other hand, Salam International Investment Company (SIIS) was the worst performing stock with a decline of 20.6%. Woqod (QFLS), Industries Qatar (IQCD) and Qatar Islamic Bank (QIBK) were the primary contributors to the weekly index decline. QFLS was the biggest contributor to the index’s weekly decrease, deleting 80.7 points from the index. IQCD was the second biggest contributor to the mentioned loss, removing 70.5 points from the index. Moreover, QIBK shed 26.1 points from the index. Trading value during the week increased by 17.5% to reach QR1,474.8mn vs. QR1,255.2mn in the prior week. The Banks & Financial Services sector led the trading value during the week, accounting for 43.2% of the total trading value. The Consumer Goods & Services sector was the second biggest contributor to the overall trading value, accounting for 21.3% of the total trading value. QNB Group (QNBK) was the top value traded stock during the week with total traded value of QR286.2mn. Trading volume increased by 18.7% to reach 462.0mn shares vs. 389.1mn shares in the prior week. The number of transactions declined by12.0%toreach32,397 transactionsversus36,799 transactionsinthe prior week. The Real Estate sector led the trading volume, accounting for 27.7%, followed by the Banks and Financial Services sector comprising 22.7% of the overall trading volume. Ezdan Holding Group (ERES) was the top volume traded stock during the week with total traded volume of 66.0mn shares. Foreign institutions ended the week with net selling of QR141.4mn vs. net selling of QR213.2mn in the prior week. Qatari institutions remained positive with net buying of QR277.9mn vs. net buying of QR179.6mn in the week before. Foreign retail investors remained negative with net selling of QR4.5mn vs. net selling of QR3.1mn in the prior week. Qatari retail investors turned bearish with net selling of QR132.0mn vs. net buying of QR36.7mn the week before. Foreign institutionshavebought(netbasis)~$162.8mnworthofQatariequities in so far in 2020. Market Indicators Week ended Mar 05, 2020 Week ended Feb 27, 2020 Chg. % Value Traded (QR mn) 1,474.8 1,255.2 17.5 Exch. Market Cap. (QR mn) 520,308.1 525,970.8 (1.1) Volume (mn) 462.0 389.1 18.7 Number of Transactions 32,397 36,799 (12.0) Companies Traded 46 46 0.0 Market Breadth 18:28 3:43 – Market Indices Close WTD% MTD% YTD% Total Return 17,456.71 (1.2) (1.2) (9.0) ALL Share Index 2,843.11 (0.7) (0.7) (8.3) Banks and Financial Services 4,138.36 1.1 1.1 (1.9) Industrials 2,377.95 (3.5) (3.5) (18.9) Transportation 2,351.63 0.7 0.7 (8.0) Real Estate 1,317.64 (0.6) (0.6) (15.8) Insurance 2,352.05 (4.1) (4.1) (14.0) Telecoms 823.90 2.0 2.0 (7.9) Consumer Goods & Services 6,928.59 (8.1) (8.1) (19.9) Al Rayan Islamic Index 3,428.50 (2.5) (2.5) (13.2) Market Indices Weekly Index Performance Regional Indices Close WTD% MTD% YTD% Weekly Exchange Traded Value ($ mn) Exchange Mkt. Cap. ($ mn) TTM P/E** P/B** Dividend Yield Qatar* 9,309.39 (1.9) (1.9) (10.7) 402.35 141,940.0 13.7 1.3 4.3 Dubai 2,460.54 (5.0) (5.0) (11.0) 308.68 95,751.4 8.9 0.9 4.8 Abu Dhabi 4,643.09 (5.3) (5.3) (8.5) 230.06 134,074.3 13.7 1.3 5.4 Saudi Arabia# 7,524.50 (1.4) (1.4) (10.3) 6,142.87 2,222,632.9 21.1 1.6 3.5 Kuwait 5,788.04 (4.7) (4.7) (7.9) 750.08 108,805.9 14.7 1.3 3.7 Oman 4,107.79 (0.6) (0.6) 3.2 27.21 17,463.7 8.3 0.8 7.2 Bahrain 1,617.79 (2.6) (2.6) 0.5 27.30 25,512.0 11.5 1.0 4.4 Source: Bloomberg, country exchanges and Zawya (** Trailing Twelve Months; * Value traded ($ mn) do not include special trades, if any; #Data as of March 04, 2020) 9,215.81 9,258.69 9,246.55 9,309.39 0 82,000,000 164,000,000 9,000 9,300 9,600 1-Mar 2-Mar 3-Mar 4-Mar 5-Mar Volume QE Index QSE was closed on March 01, 2020 QSE was closed on March 01, 2020 (0.6%) (1.4%) (1.9%) (2.6%) (4.7%) (5.0%) (5.3%)(6.0%) (4.0%) (2.0%) 0.0% Oman SaudiArabia# Qatar* Bahrain Kuwait Dubai AbuDhabi
- 2. Page 2 of 6 News Economic News / Market & Corporate News QCB lowers interest rates – Qatar Central Bank (QCB) on Wednesday cut the deposit rate, lending rate and the repurchase rate (repo) by 50, 75 and 50 basis points respectively. The three rates are now 1.5%, 3.5% and 1.5%. In a statement on its official website the central bank cited domestic and international macroeconomic developments for the decision which follows the emergency rate cut of 50 basis points by the US Federal Reserve. The Fed stated in it decided to cut the rate in an effort to shield the US economy from the impact of the novel coronavirus. Most countries with currencies pegged to the US dollar hike and lower interest rates with the Fed. The Qatari Riyal has been pegged to the US dollar since 1980. (Gulf- Times.com) WDAM posts 47.8% YoY decrease but 6% QoQ increase in net profit in 4Q2019, below our estimate – Widam Food Company's (WDAM) net profit declined 47.8% YoY (but rose 6.0% on QoQ basis) to QR15.0mn in 4Q2019, below our estimate of QR28.6mn (variation of -47.5%). The miss was due to the company recording QR6.3mn of “Other Impairments” under losses from discontinued operations within 4Q2019 vs. none in 3Q2019. After the company recorded QR13.8mn as of 1H2019 for the discontinued Al Rkya farm losses, followed by none in 3Q2019, we were not expecting the company to record additional losses from discontinued operations in 4Q2019. The company's revenues came in at QR125.7mn in 4Q2019, which represents an increase of 9.0% YoY (+6.9% QoQ). In FY2019, WDAM posted net profit of QR78.39mn compared to net profit amounting to QR108.39mn for the same period of the previous year. EPS amounted to QR0.44 in FY2019 as compared to QR0.60 in FY2018. The boards of directors propose distribution of a cash dividend of 30% of the nominal share value i.e., QR0.30 per share. (QNB FS Research, QSE, Company Press Release) MCCS' bottom line declines 34.5% YoY in 4Q2019 – Mannai Corporation (MCCS) reported net profit of QR121.6mn in 4Q2019 as compared to net profit of QR185.8mn (-34.5% YoY) in 4Q2018 and net loss of QR6.5mn in 3Q2019.The company's revenue came in at QR3,066.6mn in 4Q2019, which represents a decrease of 0.7% YoY. However, on QoQ basis revenue rose 8.6%. In FY2019, MCCS recorded net profit of QR202.6mn compared to net profit amounting to QR407.1mn for the same period of the previous year. EPS amounted to QR0.44 in FY2019 as compared to QR0.89 in FY2018. Reviewing and approving the board of directors’ proposal for a cash dividend payment of QR0.2 per share, being 20% of the nominal share value. In FY2019, MCCS reported 7.6% increase in revenue to reach QR11.6bn over QR10.8bn in the previous year, driven by solid growth in its Information and Communications Technology (ICT) businesses. ICT revenue crossed QR9bn, which accounts for 79% of the total revenue in the current period, MCCS stated in a statement. The group’s profit before interest, tax, depreciation and amortization expenses (EBITDA) for FY2019 increased to QR1.1bn compared to QR1bn last year, an increase of 7.5%. “Despite strong performance by the ICT business, the net profit was depressed due to the increase in finance costs; subdued general market conditions in the retail and luxury segment impacted the performance of its jewelry business. During the period, finance costs increased by QR87mn to QR405mn, an increase of 27% over last year, mainly as a result of higher borrowings relating to increased investment and acquisitions in the Information Technology segment,” MCCS stated. (QSE, Company Press Release, Gulf-Times.com) QGRI posts net loss of QR468.0mn in FY2019 and will hold AGM on March 29 – Qatar General Insurance & Reinsurance Company (QGRI) posted net loss of QR468.0mn compared to (restated)net loss amounting to QR169.2mn in FY2018. Loss per share amounted to QR0.535 for the year ended December 31, 2019 compared to (restated) loss per share QR0.193 last year. Net earned premium stood at QR142.7mn in FY2019 (QR131.6mn in FY2018) and net commission and other insurance income came in at QR58.7mn in FY2019 (QR55.0mn in FY2018). In FY2019, loss from discontinued operations stood at QR5.8mn versus profit from discontinued operations of QR1.6mn in FY2018. QGRI also announced that its Annual General Assembly Meeting (AGM) will be held on March 29, 2020. In case the required quorum is not met, a second meeting will be held on April 8, 2020. (QSE) CBQK announces the sale of the bank's treasury shares – Further to the bank’s announcements published on July 18, 2019, July 25, 2019 and February 2, 2020, relating to the Qatar Financial Market Authority’s (QFMA) approval to sell The Commercial Bank’s (CBQK) held treasury shares of 65,335,250, the bank confirmed that as at February 29, 2020 the bank has sold 58,472,705 of the shares equating to 1.44% of the bank’s shares. The bank will sell the remainder of the held treasury shares. (QSE) WDAM announces Al Shahaniya slaughterhouse project – Widam Food Company (WDAM) announced that in tune with Qatar National Food Security Plans and by extension investment strategy in business opportunities and national and international projects in the meat sector, with view to sustain an uninterrupted availability of related commodities at competitive prices, the company started to execute Al Shahaniya Slaughterhouse Project at a cost of QR15mn to serve the needs of the local people in Al Shahaniya area and neighboring areas, which are densely populated with a large number of livestock Breeders. The capacity of the slaughterhouse is 600 heads of livestock per day. The project is characterized by modern outstanding design and operational features in the slaughtering sector. The build and completion of the slaughterhouse shall be completed as soon as possible and within this year. In parallel, the company has completed the design and contractual protocols to build an operations zone with international standards to substitute the old operational zone in Abu Hammour. This Project includes a production and meat processing unit, and barns to house the large number of imported livestock. The project shall commence its operations soon and the Company has set aside a budget of QR130mn for the build and preparatory works. (QSE)
- 3. Page 3 of 6 Qatar Stock Exchange Top Gainers Top Decliners Source: Qatar Stock Exchange (QSE) Source: Qatar Stock Exchange (QSE) Most Active Shares by Value (QR Million) Most Active Shares by Volume (Million) Source: Qatar Stock Exchange (QSE) Source: Qatar Stock Exchange (QSE) Investor Trading Percentage to Total Value Traded Net Traded Value by Nationality (QR Million) Source: Qatar Stock Exchange (QSE) Source: Qatar Stock Exchange (QSE) 6.1% 6.0% 5.9% 5.1% 3.8% 0.0% 3.0% 6.0% 9.0% Medicare Group Mannai Corporation Qatar General Insurance & Reinsurance Company Qatar International Islamic Bank Aamal Company -20.6% -12.4% -12.0% -11.0% -9.6% -24.0% -16.0% -8.0% 0.0% Salam International Investment Limited Qatar Fuel Company Qatar Oman Investment Company Industries Qatar Al Khaleej Takaful Insurance Company 286.2 264.2 125.1 102.3 100.3 0.0 100.0 200.0 300.0 QNB Group Qatar Fuel Company Masraf Al Rayan Industries Qatar Ooredoo 66.0 47.0 40.5 31.0 21.1 0.0 25.0 50.0 75.0 Ezdan Holding Group Salam International Investment Limited United Development Company Masraf Al Rayan Mesaieed Petrochemical Holding Company 0% 20% 40% 60% 80% 100% Buy Sell 2 6 .55% 3 5 .50% 3 5 .67% 1 6 .83% 1 0 .21% 1 0 .51% 2 7 .57% 3 7 .16% QatariIndividuals QatariInstitutions Non-QatariIndividuals Non-QatariInstitutions 918 557 772 703 146 -146 -200 0 200 400 600 800 1,000 Qatari Non-Qatari Net Investment Total Sold Total Bought
- 4. Page 4 of 6 TECHNICAL ANALYSIS OF THE QSE INDEX Source: Bloomberg The QSE Index closed lower by 1.9% from the week before, and closed at the 9,309.39 level. The Index broke below the price range managed to create a bullish reversal signal, but needs to be confirmed. As a result, we update our immediate weekly support level at 9,000 points and the resistance level at 10,000 points. DEFINITIONS OF KEY TERMS USED IN TECHNICAL ANALYSIS RSI (Relative Strength Index) indicator – RSI is a momentum oscillator that measures the speedand change of price movements. The RSI oscillates between 0 to 100. The index is deemed to be overbought once the RSI approaches the 70 level, indicating that a correction is likely. On the other hand, if the RSI approaches 30, it is an indication that the index may be getting oversold and therefore likely to bounce back. MACD (Moving Average Convergence Divergence) indicator – The indicator consists of the MACD line and a signal line. The divergence or the convergence of the MACD line with the signal line indicates the strength in the momentum during the uptrend or downtrend, as the case may be. When the MACD crosses the signal line from below and trades above it, it gives a positive indication. The reverse is the situation for a bearish trend. Candlestick chart – A candlestick chart is a price chart that displays the high, low, open, and close for a security. The ‘body’ of the chart is portion between the open and close price, while the high and low intraday movements form the ‘shadow’. The candlestick may represent any time frame. We use a one-day candlestick chart (every candlestick represents one trading day) in our analysis. Doji candlestick pattern – A Doji candlestick is formed when a security's open and close are practically equal. The pattern indicates indecisiveness, and based on preceding price actions and future confirmation, may indicate a bullish or bearish trend reversal. ShootingStar/Inverted Hammer candlestick patterns – These candlestick patterns have a small real body (open price and close price are near to each other), and a long upper shadow (large intraday movement on the upside). The Shooting Star is a bearish reversal pattern that forms after a rally. The Inverted Hammer looks exactly like a Shooting Star, but forms after a downtrend. Inverted Hammers represent a potential bullish trend reversal.
- 5. Page 5 of 6 Source: Bloomberg Company Name Price March 05 % Change WTD % Change YTD Market Cap. QR Million TTM P/E P/B Div. Yield Qatar National Bank 19.20 1.91 (6.75) 177,339 14.1 2.4 3.1 Qatar Islamic Bank 15.28 (2.05) (0.33) 36,106 12.7 2.1 3.4 Commercial Bank of Qatar 4.65 2.76 (1.06) 18,820 10.7 1.1 3.2 Doha Bank 2.38 2.59 (5.93) 7,379 13.4 0.8 4.2 Al Ahli Bank 3.30 (0.99) (1.00) 8,018 11.8 1.3 4.3 Qatar International Islamic Bank 8.94 5.12 (7.70) 13,525 15.4 2.2 4.5 Masraf Al Rayan 4.08 0.22 3.01 30,593 14.0 2.2 4.9 Al Khaliji Bank 1.19 (4.72) (9.08) 4,288 7.2 0.7 6.3 Qatar First Bank 0.98 (4.47) 20.29 689 N/A 1.0 N/A National Leasing 0.76 (0.52) 8.23 378 15.6 0.5 6.6 Dlala Holding 0.52 (1.69) (14.57) 148 N/A 0.7 N/A Qatar & Oman Investment 0.46 (12.00) (30.94) 146 54.4 0.5 6.5 Islamic Holding Group 1.61 (7.65) (15.53) 91 197.4 0.7 N/A Banking and Financial Services 297,518 Zad Holding 14.50 2.76 4.92 3,436 16.1 2.3 5.9 Qatar German Co. for Medical Devices 0.51 (6.91) (12.03) 59 N/A 1.8 N/A Salam International Investment 0.31 (20.57) (41.01) 349 N/A 0.3 N/A Baladna 1.00 1.01 0.00 1,901 N/A N/A N/A Medicare Group 7.00 6.09 (17.16) 1,970 27.5 1.9 25.7 Qatar Cinema & Film Distribution 2.21 0.00 0.45 139 21.7 1.0 6.8 Qatar Fuel 16.91 (12.38) (26.16) 16,813 13.8 2.0 4.7 Qatar Meat and Livestock 5.99 (4.18) (11.41) 1,078 11.7 3.2 7.5 Mannai Corp. 3.23 6.01 4.74 1,472 7.3 0.6 6.2 Al Meera Consumer Goods 15.64 0.90 2.22 3,128 16.8 2.2 5.4 Consumer Goods and Services 30,345 Qatar Industrial Manufacturing 2.96 2.17 (17.00) 1,408 13.6 0.9 8.4 Qatar National Cement 4.06 (2.64) (28.23) 2,650 16.9 0.9 7.4 Industries Qatar 8.00 (11.01) (22.18) 48,400 18.8 1.4 5.0 Qatari Investors Group 1.35 (5.66) (24.53) 1,680 12.7 0.6 4.1 Qatar Electricity and Water 15.30 1.66 (4.91) 16,830 11.9 1.7 5.1 Aamal 0.73 3.84 (10.21) 4,599 14.4 0.6 8.2 Gulf International Services 1.31 1.32 (24.01) 2,429 54.7 0.7 N/A Mesaieed Petrochemical Holding 1.73 (2.09) (30.96) 21,772 18.3 1.4 4.6 Invesment Holding Group 0.49 (3.71) (12.59) 409 6.7 0.5 5.1 Qatar Aluminum Manufacturing 0.59 (4.24) (24.84) 3,276 N/A 0.6 3.4 Industrials 103,452 Qatar Insurance 2.54 (6.00) (19.68) 8,289 15.0 1.0 5.9 Doha Insurance 1.14 (1.13) (5.00) 570 11.6 0.5 7.0 Qatar General Insurance & Reinsurance 2.19 5.91 (11.10) 1,914 N/A 0.3 4.6 Al Khaleej Takaful Insurance 1.59 (9.61) (20.50) 406 13.6 0.8 3.1 Qatar Islamic Insurance 6.22 (1.58) (6.89) 933 12.7 2.5 5.6 Insurance 12,112 United Development 1.11 (8.35) (27.11) 3,923 10.8 0.4 4.5 Barw a Real Estate 3.17 2.26 (10.45) 12,335 7.9 0.6 7.9 Ezdan Real Estate 0.53 (1.30) (13.82) 14,058 42.4 0.4 N/A Mazaya Qatar Real Estate Development 0.62 (4.15) (13.35) 721 72.7 0.6 8.0 Real Estate 31,038 Ooredoo 6.30 (0.38) (11.02) 20,180 11.8 0.9 4.0 Vodafone Qatar 1.00 (3.19) (13.79) 4,227 29.7 0.9 5.0 Telecoms 24,407 Qatar Navigation (Milaha) 5.60 (0.18) (8.20) 6,413 12.4 0.4 5.4 Gulf Warehousing 4.65 0.80 (15.20) 272 10.9 1.5 4.3 Qatar Gas Transport (Nakilat) 2.22 1.37 (7.11) 12,299 12.3 1.8 4.5 Transportation 18,985 Qatar Exchange 520,308
- 6. Contacts Saugata Sarkar, CFA, CAIA Shahan Keushgerian Zaid al-Nafoosi , CMT, CFTe Head of Research Senior Research Analyst Senior Research Analyst Tel: (+974) 4476 6534 Tel: (+974) 4476 6509 Tel: (+974) 4476 6535 saugata.sarkar@qnbfs.com.qa shahan.keushgerian@qnbfs.com.qa zaid.alnafoosi@qnbfs.com.qa Mehmet Aksoy, PhD QNB Financial Services Co. W.L.L. Senior Research Analyst Contact Center: (+974) 4476 6666 Tel: (+974) 4476 6589 PO Box 24025 mehmet.aksoy@qnbfs.com.qa Doha, Qatar Disclaimer and Copyright Notice: This publication has been prepared by QNB Financial Services Co. W.L.L. (“QNB FS”) a wholly-owned subsidiary of Qatar National Bank (Q.P.S.C.). QNB FS is regulated by the Qatar Financial Markets Authority and the Qatar Exchange. Qatar National Bank (Q.P.S.C.) is regulated by the Qatar Central Bank. This publication expresses the views and opinions of QNB FS at a given time only. It is not an offer, promotion or recommendation to buy or sell securities or other investments, nor is it intended to constitute legal, tax, accounting, or financial advice. QNB FS accepts no liability whatsoever for any direct or indirect losses arising from use of this report. Any investment decision should depend on the individual circumstances of the investor and be based on specifically engaged investment advice. We therefore strongly advise potential investors to seek independent professional advice before making any investment decision. Although the information in this report has been obtained from sources that QNB FS believes to be reliable, we have not independently verified such information and it may not be accurate or complete. QNB FS does not make any representations or warranties as to the accuracy and completeness of the information it may contain, and declines any liability in that respect. For reports dealing with Technical Analysis, expressed opinions and/or recommendations may be different or contrary to the opinions/recommendations of QNB FS Fundamental Research as a result of depending solely on the historical technical data (price and volume). QNB FS reserves the right to amend the views and opinions expressed in this publication at any time. It may also express viewpoints or make investment decisions that differ significantly from, or even contradict, the views and opinions included in this report. This report may not be reproduced in whole or in part without permission from QNB FS COPYRIGHT: No part of this document may be reproduced without the explicit written permission of QNB FS. Page 6 of 6