Download as PDF, PPTX
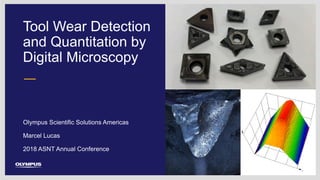
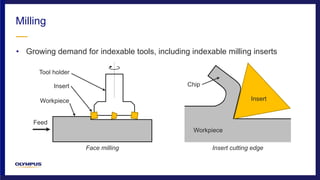
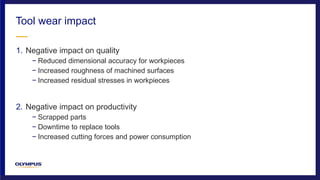
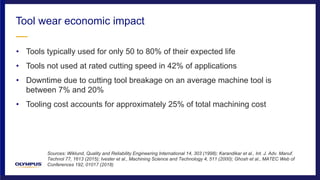
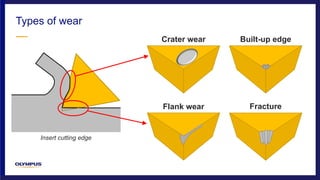
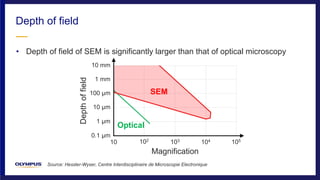
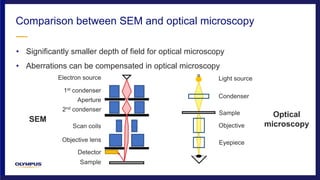
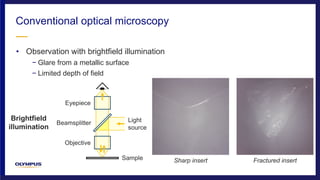
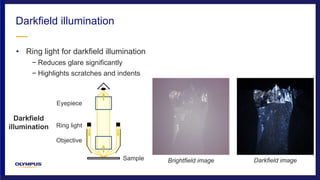
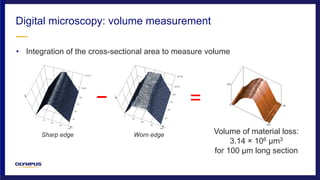


The document discusses tool wear detection and quantitation using digital microscopy, emphasizing its economic impact and characterization techniques such as scanning electron microscopy and optical microscopy. Key insights include the negative effects of tool wear on quality and productivity, with tools often underperforming their expected lifespan. Digital microscopy's advancements allow for detailed 3D imaging, measurement of wear, and enhanced analysis through varied illumination methods.


