SlideShare a Scribd company logo
1 of 14
Center for Research and Application for Satellite Remote Sensing
Yamaguchi University
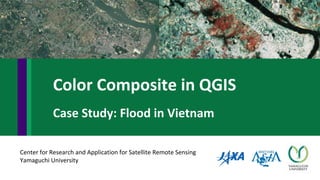
Color Composite in QGIS
Case Study: Flood in Vietnam
• According to the Quick report on Aug 25th 2017 from Standing office of Central Steering
Committee for Natural Disaster Prevention and Control (CSCNDPC). The storm number 6 name
Hato had landing on Hong Kong, China. On land, the storm also affected to the province in the
Northern of Vietnam. There are a lot of heavy rain, land slide and local flood in mountain area.
• According to the rapid report of the affected provinces (Ha Giang, Yen Bai, Tuyen Quang, Thai
Nguyen, Lang Son, Bac Can), the situation and Initial damage caused by Storm number 6 are as
follows:
- Casualty: 02 people dead, 01 people missing,
- Housing: 05 houses collapsed completely; 387 unroofed;
- Agriculture: Total area of rice and crops are flooded: 1.751 ha, including 1.502 hectares of rice
and 249 hectares of crops.
• http://phongchongthientai.vn/tin-tuc/bao-cao-nhanh-cong-tac-truc-ban-pctt-ngay-25-8-2017/-c5174.html
• http://www.nchmf.gov.vn/web/vi-VN/104/51/5594/Default.aspx
Vietnam Flood in 2017
ALOS2 level data and processing
Product from Sentinel ASIA website
• Jpeg
• GeoTiff
Product from JAXA (CEOS SAR/GeoTIFF)
• Level 1.1 This is complex number data on the slant range following compression of the range and azimuth. As one-look data,
it includes phase information and will be the basis for later processing. In wide-area mode, image files are created for each
scan.
• Level 1.5 This is multi-look data on the slant range from map projection amplitude data, with range and azimuth compressed.
• Level 2.1 Geometrically corrected (orthorectified) data using the digital elevation data from Level 1.1
• Level 3.1 Image quality-corrected (noise removed, dynamic range compressed) data from Level 1.5
https://sentinel.tksc.jaxa.jp/sentinel2/emobSelect.jsp
• Image before flood : JPJXisis0001201708310012.tiff
• Date : 07 June 2017
• Image during flood : JPJXisis0001201708310011.tiff
• Date : 30 August 2017
• Software : QGIS
ALOS2 level data and processing
Open QGIS software🡪 add raster layers
Raster 🡪 Miscellaneous 🡪 Merge
A false color composite is created, with two of the RGB bands on
the "during" image and one on the "before"
Red : SAR Image before flood
Green : SAR Image during flood
Blue : SAR Image during flood
Color composite for detecting flood
Merge later 🡪 right click at properties 🡪 red present as flood or wetland
Save RGB composite image: Right click at image 🡪 click “save as”
Save RGB composite image 🡪 Select “Rendered image” for output mode 🡪
Define directory and output file name
Open Google Earth 🡪 click “File” 🡪 click “Open”🡪 select “All files” for all formats
Open RGB image in Google Earth by create super overlay
Choose directory where the file should be saved. Then, wait for importing image data
Observe flood area (red color) in Google Earth
Google Earth
Analyzed result
(Red color is possible to be flood area)

More Related Content

More from NopphawanTamkuan

Earthquake Damage Detection Using SAR Interferometric Coherence
Earthquake Damage Detection Using SAR Interferometric CoherenceEarthquake Damage Detection Using SAR Interferometric Coherence
Earthquake Damage Detection Using SAR Interferometric CoherenceNopphawanTamkuan
 
How to better understand SAR, interpret SAR products and realize the limitations
How to better understand SAR, interpret SAR products and realize the limitationsHow to better understand SAR, interpret SAR products and realize the limitations
How to better understand SAR, interpret SAR products and realize the limitationsNopphawanTamkuan
 
SAR Interferometry Technique
SAR Interferometry TechniqueSAR Interferometry Technique
SAR Interferometry TechniqueNopphawanTamkuan
 
Flood Detection Using ALOS-2 Images in SNAP
Flood Detection Using ALOS-2 Images in SNAPFlood Detection Using ALOS-2 Images in SNAP
Flood Detection Using ALOS-2 Images in SNAPNopphawanTamkuan
 
Differential SAR Interferometry Using ALOS-2 Data for Nepal Earthquake
Differential SAR Interferometry Using ALOS-2 Data for Nepal EarthquakeDifferential SAR Interferometry Using ALOS-2 Data for Nepal Earthquake
Differential SAR Interferometry Using ALOS-2 Data for Nepal EarthquakeNopphawanTamkuan
 
Flood Detection Using During-Flood SAR Image in QGIS
Flood Detection Using During-Flood SAR Image in QGISFlood Detection Using During-Flood SAR Image in QGIS
Flood Detection Using During-Flood SAR Image in QGISNopphawanTamkuan
 
Color Composite in ENVI (Case Study: Flood in Myanmar)
Color Composite in ENVI (Case Study: Flood in Myanmar)Color Composite in ENVI (Case Study: Flood in Myanmar)
Color Composite in ENVI (Case Study: Flood in Myanmar)NopphawanTamkuan
 
Play with Vector and Make Map
Play with Vector and Make MapPlay with Vector and Make Map
Play with Vector and Make MapNopphawanTamkuan
 
Raster Analysis (Color Composite and Remote Sensing Indices)
Raster Analysis (Color Composite and Remote Sensing Indices)Raster Analysis (Color Composite and Remote Sensing Indices)
Raster Analysis (Color Composite and Remote Sensing Indices)NopphawanTamkuan
 
Understanding Basic of Python
Understanding Basic of PythonUnderstanding Basic of Python
Understanding Basic of PythonNopphawanTamkuan
 
Introduction to Geospatial Data
Introduction to Geospatial DataIntroduction to Geospatial Data
Introduction to Geospatial DataNopphawanTamkuan
 
Geospatial Processing with Python
Geospatial Processing with PythonGeospatial Processing with Python
Geospatial Processing with PythonNopphawanTamkuan
 
Setting-Up Python Environment (Jupyter Notebook)
Setting-Up Python Environment (Jupyter Notebook)Setting-Up Python Environment (Jupyter Notebook)
Setting-Up Python Environment (Jupyter Notebook)NopphawanTamkuan
 
Data Processing Using DubaiSat Satellite Imagery for Disaster Monitoring (Cas...
Data Processing Using DubaiSat Satellite Imagery for Disaster Monitoring (Cas...Data Processing Using DubaiSat Satellite Imagery for Disaster Monitoring (Cas...
Data Processing Using DubaiSat Satellite Imagery for Disaster Monitoring (Cas...NopphawanTamkuan
 
Data Processing Using IRS Satellite Imagery for Disaster Monitoring (Case Stu...
Data Processing Using IRS Satellite Imagery for Disaster Monitoring (Case Stu...Data Processing Using IRS Satellite Imagery for Disaster Monitoring (Case Stu...
Data Processing Using IRS Satellite Imagery for Disaster Monitoring (Case Stu...NopphawanTamkuan
 
Data Processing Using THEOS Satellite Imagery for Disaster Monitoring (Case S...
Data Processing Using THEOS Satellite Imagery for Disaster Monitoring (Case S...Data Processing Using THEOS Satellite Imagery for Disaster Monitoring (Case S...
Data Processing Using THEOS Satellite Imagery for Disaster Monitoring (Case S...NopphawanTamkuan
 
Data Processing Using DIWATA-1 Microsatellite Imagery for Disaster Monitoring
Data Processing Using DIWATA-1 Microsatellite Imagery for Disaster MonitoringData Processing Using DIWATA-1 Microsatellite Imagery for Disaster Monitoring
Data Processing Using DIWATA-1 Microsatellite Imagery for Disaster MonitoringNopphawanTamkuan
 

More from NopphawanTamkuan (20)

Earthquake Damage Detection Using SAR Interferometric Coherence
Earthquake Damage Detection Using SAR Interferometric CoherenceEarthquake Damage Detection Using SAR Interferometric Coherence
Earthquake Damage Detection Using SAR Interferometric Coherence
 
How to better understand SAR, interpret SAR products and realize the limitations
How to better understand SAR, interpret SAR products and realize the limitationsHow to better understand SAR, interpret SAR products and realize the limitations
How to better understand SAR, interpret SAR products and realize the limitations
 
SAR Interferometry Technique
SAR Interferometry TechniqueSAR Interferometry Technique
SAR Interferometry Technique
 
Flood Detection Using ALOS-2 Images in SNAP
Flood Detection Using ALOS-2 Images in SNAPFlood Detection Using ALOS-2 Images in SNAP
Flood Detection Using ALOS-2 Images in SNAP
 
Differential SAR Interferometry Using ALOS-2 Data for Nepal Earthquake
Differential SAR Interferometry Using ALOS-2 Data for Nepal EarthquakeDifferential SAR Interferometry Using ALOS-2 Data for Nepal Earthquake
Differential SAR Interferometry Using ALOS-2 Data for Nepal Earthquake
 
Flood Detection Using During-Flood SAR Image in QGIS
Flood Detection Using During-Flood SAR Image in QGISFlood Detection Using During-Flood SAR Image in QGIS
Flood Detection Using During-Flood SAR Image in QGIS
 
Color Composite in ENVI (Case Study: Flood in Myanmar)
Color Composite in ENVI (Case Study: Flood in Myanmar)Color Composite in ENVI (Case Study: Flood in Myanmar)
Color Composite in ENVI (Case Study: Flood in Myanmar)
 
Play with Vector and Make Map
Play with Vector and Make MapPlay with Vector and Make Map
Play with Vector and Make Map
 
Raster Analysis (Color Composite and Remote Sensing Indices)
Raster Analysis (Color Composite and Remote Sensing Indices)Raster Analysis (Color Composite and Remote Sensing Indices)
Raster Analysis (Color Composite and Remote Sensing Indices)
 
Image Classification
Image ClassificationImage Classification
Image Classification
 
Useful Tools in QGIS
Useful Tools in QGISUseful Tools in QGIS
Useful Tools in QGIS
 
Understanding Basic of Python
Understanding Basic of PythonUnderstanding Basic of Python
Understanding Basic of Python
 
Introduction to Geospatial Data
Introduction to Geospatial DataIntroduction to Geospatial Data
Introduction to Geospatial Data
 
Geospatial Processing with Python
Geospatial Processing with PythonGeospatial Processing with Python
Geospatial Processing with Python
 
Setting-Up Python Environment (Jupyter Notebook)
Setting-Up Python Environment (Jupyter Notebook)Setting-Up Python Environment (Jupyter Notebook)
Setting-Up Python Environment (Jupyter Notebook)
 
Keras and TensorFlow
Keras and TensorFlowKeras and TensorFlow
Keras and TensorFlow
 
Data Processing Using DubaiSat Satellite Imagery for Disaster Monitoring (Cas...
Data Processing Using DubaiSat Satellite Imagery for Disaster Monitoring (Cas...Data Processing Using DubaiSat Satellite Imagery for Disaster Monitoring (Cas...
Data Processing Using DubaiSat Satellite Imagery for Disaster Monitoring (Cas...
 
Data Processing Using IRS Satellite Imagery for Disaster Monitoring (Case Stu...
Data Processing Using IRS Satellite Imagery for Disaster Monitoring (Case Stu...Data Processing Using IRS Satellite Imagery for Disaster Monitoring (Case Stu...
Data Processing Using IRS Satellite Imagery for Disaster Monitoring (Case Stu...
 
Data Processing Using THEOS Satellite Imagery for Disaster Monitoring (Case S...
Data Processing Using THEOS Satellite Imagery for Disaster Monitoring (Case S...Data Processing Using THEOS Satellite Imagery for Disaster Monitoring (Case S...
Data Processing Using THEOS Satellite Imagery for Disaster Monitoring (Case S...
 
Data Processing Using DIWATA-1 Microsatellite Imagery for Disaster Monitoring
Data Processing Using DIWATA-1 Microsatellite Imagery for Disaster MonitoringData Processing Using DIWATA-1 Microsatellite Imagery for Disaster Monitoring
Data Processing Using DIWATA-1 Microsatellite Imagery for Disaster Monitoring
 

Recently uploaded

This PowerPoint helps students to consider the concept of infinity.
This PowerPoint helps students to consider the concept of infinity.This PowerPoint helps students to consider the concept of infinity.
This PowerPoint helps students to consider the concept of infinity.christianmathematics
 
SECOND SEMESTER TOPIC COVERAGE SY 2023-2024 Trends, Networks, and Critical Th...
SECOND SEMESTER TOPIC COVERAGE SY 2023-2024 Trends, Networks, and Critical Th...SECOND SEMESTER TOPIC COVERAGE SY 2023-2024 Trends, Networks, and Critical Th...
SECOND SEMESTER TOPIC COVERAGE SY 2023-2024 Trends, Networks, and Critical Th...KokoStevan
 
Making and Justifying Mathematical Decisions.pdf
Making and Justifying Mathematical Decisions.pdfMaking and Justifying Mathematical Decisions.pdf
Making and Justifying Mathematical Decisions.pdfChris Hunter
 
Sports & Fitness Value Added Course FY..
Sports & Fitness Value Added Course FY..Sports & Fitness Value Added Course FY..
Sports & Fitness Value Added Course FY..Disha Kariya
 
PROCESS RECORDING FORMAT.docx
PROCESS      RECORDING        FORMAT.docxPROCESS      RECORDING        FORMAT.docx
PROCESS RECORDING FORMAT.docxPoojaSen20
 
Measures of Central Tendency: Mean, Median and Mode
Measures of Central Tendency: Mean, Median and ModeMeasures of Central Tendency: Mean, Median and Mode
Measures of Central Tendency: Mean, Median and ModeThiyagu K
 
The basics of sentences session 2pptx copy.pptx
The basics of sentences session 2pptx copy.pptxThe basics of sentences session 2pptx copy.pptx
The basics of sentences session 2pptx copy.pptxheathfieldcps1
 
ICT Role in 21st Century Education & its Challenges.pptx
ICT Role in 21st Century Education & its Challenges.pptxICT Role in 21st Century Education & its Challenges.pptx
ICT Role in 21st Century Education & its Challenges.pptxAreebaZafar22
 
Basic Civil Engineering first year Notes- Chapter 4 Building.pptx
Basic Civil Engineering first year Notes- Chapter 4 Building.pptxBasic Civil Engineering first year Notes- Chapter 4 Building.pptx
Basic Civil Engineering first year Notes- Chapter 4 Building.pptxDenish Jangid
 
Unit-IV- Pharma. Marketing Channels.pptx
Unit-IV- Pharma. Marketing Channels.pptxUnit-IV- Pharma. Marketing Channels.pptx
Unit-IV- Pharma. Marketing Channels.pptxVishalSingh1417
 
Presentation by Andreas Schleicher Tackling the School Absenteeism Crisis 30 ...
Presentation by Andreas Schleicher Tackling the School Absenteeism Crisis 30 ...Presentation by Andreas Schleicher Tackling the School Absenteeism Crisis 30 ...
Presentation by Andreas Schleicher Tackling the School Absenteeism Crisis 30 ...EduSkills OECD
 
Seal of Good Local Governance (SGLG) 2024Final.pptx
Seal of Good Local Governance (SGLG) 2024Final.pptxSeal of Good Local Governance (SGLG) 2024Final.pptx
Seal of Good Local Governance (SGLG) 2024Final.pptxnegromaestrong
 
Mixin Classes in Odoo 17 How to Extend Models Using Mixin Classes
Mixin Classes in Odoo 17  How to Extend Models Using Mixin ClassesMixin Classes in Odoo 17  How to Extend Models Using Mixin Classes
Mixin Classes in Odoo 17 How to Extend Models Using Mixin ClassesCeline George
 
Introduction to Nonprofit Accounting: The Basics
Introduction to Nonprofit Accounting: The BasicsIntroduction to Nonprofit Accounting: The Basics
Introduction to Nonprofit Accounting: The BasicsTechSoup
 
microwave assisted reaction. General introduction
microwave assisted reaction. General introductionmicrowave assisted reaction. General introduction
microwave assisted reaction. General introductionMaksud Ahmed
 
Z Score,T Score, Percential Rank and Box Plot Graph
Z Score,T Score, Percential Rank and Box Plot GraphZ Score,T Score, Percential Rank and Box Plot Graph
Z Score,T Score, Percential Rank and Box Plot GraphThiyagu K
 
How to Give a Domain for a Field in Odoo 17
How to Give a Domain for a Field in Odoo 17How to Give a Domain for a Field in Odoo 17
How to Give a Domain for a Field in Odoo 17Celine George
 

Recently uploaded (20)

This PowerPoint helps students to consider the concept of infinity.
This PowerPoint helps students to consider the concept of infinity.This PowerPoint helps students to consider the concept of infinity.
This PowerPoint helps students to consider the concept of infinity.
 
SECOND SEMESTER TOPIC COVERAGE SY 2023-2024 Trends, Networks, and Critical Th...
SECOND SEMESTER TOPIC COVERAGE SY 2023-2024 Trends, Networks, and Critical Th...SECOND SEMESTER TOPIC COVERAGE SY 2023-2024 Trends, Networks, and Critical Th...
SECOND SEMESTER TOPIC COVERAGE SY 2023-2024 Trends, Networks, and Critical Th...
 
Mattingly "AI & Prompt Design: The Basics of Prompt Design"
Mattingly "AI & Prompt Design: The Basics of Prompt Design"Mattingly "AI & Prompt Design: The Basics of Prompt Design"
Mattingly "AI & Prompt Design: The Basics of Prompt Design"
 
Making and Justifying Mathematical Decisions.pdf
Making and Justifying Mathematical Decisions.pdfMaking and Justifying Mathematical Decisions.pdf
Making and Justifying Mathematical Decisions.pdf
 
Sports & Fitness Value Added Course FY..
Sports & Fitness Value Added Course FY..Sports & Fitness Value Added Course FY..
Sports & Fitness Value Added Course FY..
 
PROCESS RECORDING FORMAT.docx
PROCESS      RECORDING        FORMAT.docxPROCESS      RECORDING        FORMAT.docx
PROCESS RECORDING FORMAT.docx
 
Measures of Central Tendency: Mean, Median and Mode
Measures of Central Tendency: Mean, Median and ModeMeasures of Central Tendency: Mean, Median and Mode
Measures of Central Tendency: Mean, Median and Mode
 
The basics of sentences session 2pptx copy.pptx
The basics of sentences session 2pptx copy.pptxThe basics of sentences session 2pptx copy.pptx
The basics of sentences session 2pptx copy.pptx
 
ICT Role in 21st Century Education & its Challenges.pptx
ICT Role in 21st Century Education & its Challenges.pptxICT Role in 21st Century Education & its Challenges.pptx
ICT Role in 21st Century Education & its Challenges.pptx
 
Basic Civil Engineering first year Notes- Chapter 4 Building.pptx
Basic Civil Engineering first year Notes- Chapter 4 Building.pptxBasic Civil Engineering first year Notes- Chapter 4 Building.pptx
Basic Civil Engineering first year Notes- Chapter 4 Building.pptx
 
Unit-IV- Pharma. Marketing Channels.pptx
Unit-IV- Pharma. Marketing Channels.pptxUnit-IV- Pharma. Marketing Channels.pptx
Unit-IV- Pharma. Marketing Channels.pptx
 
Presentation by Andreas Schleicher Tackling the School Absenteeism Crisis 30 ...
Presentation by Andreas Schleicher Tackling the School Absenteeism Crisis 30 ...Presentation by Andreas Schleicher Tackling the School Absenteeism Crisis 30 ...
Presentation by Andreas Schleicher Tackling the School Absenteeism Crisis 30 ...
 
Seal of Good Local Governance (SGLG) 2024Final.pptx
Seal of Good Local Governance (SGLG) 2024Final.pptxSeal of Good Local Governance (SGLG) 2024Final.pptx
Seal of Good Local Governance (SGLG) 2024Final.pptx
 
INDIA QUIZ 2024 RLAC DELHI UNIVERSITY.pptx
INDIA QUIZ 2024 RLAC DELHI UNIVERSITY.pptxINDIA QUIZ 2024 RLAC DELHI UNIVERSITY.pptx
INDIA QUIZ 2024 RLAC DELHI UNIVERSITY.pptx
 
Mixin Classes in Odoo 17 How to Extend Models Using Mixin Classes
Mixin Classes in Odoo 17  How to Extend Models Using Mixin ClassesMixin Classes in Odoo 17  How to Extend Models Using Mixin Classes
Mixin Classes in Odoo 17 How to Extend Models Using Mixin Classes
 
Introduction to Nonprofit Accounting: The Basics
Introduction to Nonprofit Accounting: The BasicsIntroduction to Nonprofit Accounting: The Basics
Introduction to Nonprofit Accounting: The Basics
 
microwave assisted reaction. General introduction
microwave assisted reaction. General introductionmicrowave assisted reaction. General introduction
microwave assisted reaction. General introduction
 
Z Score,T Score, Percential Rank and Box Plot Graph
Z Score,T Score, Percential Rank and Box Plot GraphZ Score,T Score, Percential Rank and Box Plot Graph
Z Score,T Score, Percential Rank and Box Plot Graph
 
Código Creativo y Arte de Software | Unidad 1
Código Creativo y Arte de Software | Unidad 1Código Creativo y Arte de Software | Unidad 1
Código Creativo y Arte de Software | Unidad 1
 
How to Give a Domain for a Field in Odoo 17
How to Give a Domain for a Field in Odoo 17How to Give a Domain for a Field in Odoo 17
How to Give a Domain for a Field in Odoo 17
 

Color Composite in ENVI (Case Study: Flood in Vietnam)

  • 1. Center for Research and Application for Satellite Remote Sensing Yamaguchi University Color Composite in QGIS Case Study: Flood in Vietnam
  • 2. • According to the Quick report on Aug 25th 2017 from Standing office of Central Steering Committee for Natural Disaster Prevention and Control (CSCNDPC). The storm number 6 name Hato had landing on Hong Kong, China. On land, the storm also affected to the province in the Northern of Vietnam. There are a lot of heavy rain, land slide and local flood in mountain area. • According to the rapid report of the affected provinces (Ha Giang, Yen Bai, Tuyen Quang, Thai Nguyen, Lang Son, Bac Can), the situation and Initial damage caused by Storm number 6 are as follows: - Casualty: 02 people dead, 01 people missing, - Housing: 05 houses collapsed completely; 387 unroofed; - Agriculture: Total area of rice and crops are flooded: 1.751 ha, including 1.502 hectares of rice and 249 hectares of crops. • http://phongchongthientai.vn/tin-tuc/bao-cao-nhanh-cong-tac-truc-ban-pctt-ngay-25-8-2017/-c5174.html • http://www.nchmf.gov.vn/web/vi-VN/104/51/5594/Default.aspx Vietnam Flood in 2017
  • 3. ALOS2 level data and processing Product from Sentinel ASIA website • Jpeg • GeoTiff Product from JAXA (CEOS SAR/GeoTIFF) • Level 1.1 This is complex number data on the slant range following compression of the range and azimuth. As one-look data, it includes phase information and will be the basis for later processing. In wide-area mode, image files are created for each scan. • Level 1.5 This is multi-look data on the slant range from map projection amplitude data, with range and azimuth compressed. • Level 2.1 Geometrically corrected (orthorectified) data using the digital elevation data from Level 1.1 • Level 3.1 Image quality-corrected (noise removed, dynamic range compressed) data from Level 1.5 https://sentinel.tksc.jaxa.jp/sentinel2/emobSelect.jsp
  • 4. • Image before flood : JPJXisis0001201708310012.tiff • Date : 07 June 2017 • Image during flood : JPJXisis0001201708310011.tiff • Date : 30 August 2017 • Software : QGIS ALOS2 level data and processing
  • 5. Open QGIS software🡪 add raster layers
  • 7. A false color composite is created, with two of the RGB bands on the "during" image and one on the "before" Red : SAR Image before flood Green : SAR Image during flood Blue : SAR Image during flood Color composite for detecting flood
  • 8. Merge later 🡪 right click at properties 🡪 red present as flood or wetland
  • 9. Save RGB composite image: Right click at image 🡪 click “save as”
  • 10. Save RGB composite image 🡪 Select “Rendered image” for output mode 🡪 Define directory and output file name
  • 11. Open Google Earth 🡪 click “File” 🡪 click “Open”🡪 select “All files” for all formats
  • 12. Open RGB image in Google Earth by create super overlay
  • 13. Choose directory where the file should be saved. Then, wait for importing image data
  • 14. Observe flood area (red color) in Google Earth Google Earth Analyzed result (Red color is possible to be flood area)