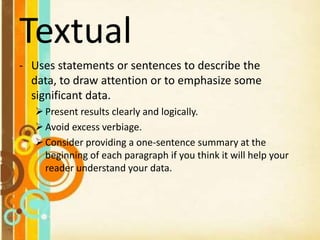
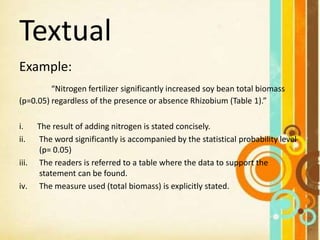
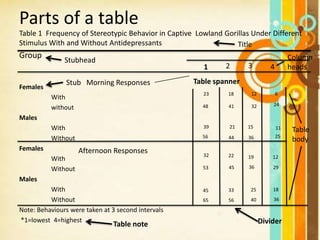
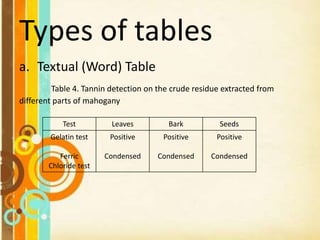
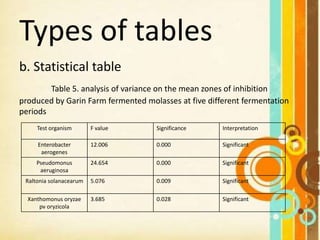
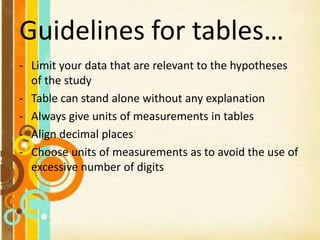
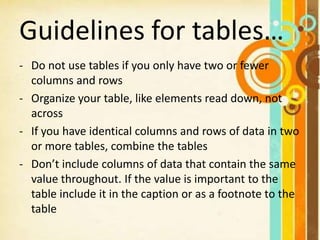
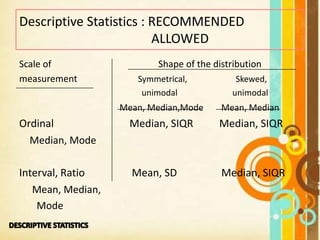
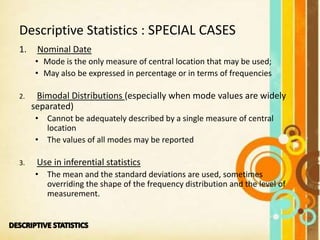
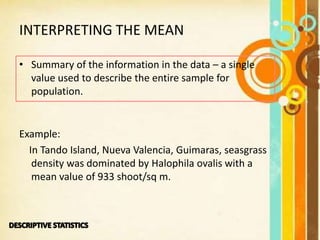
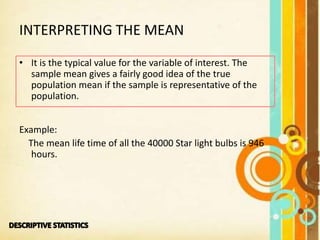
1. Data Presentation
Adapted from the Presentation
Of Mrs. Zennifer Oberio
Presented by:
Daleon, Kathryna Maeve V.
Lacsamana, Marco A.
Toledano, Anthon Jay B.
<III-SSC>
2. Outline
• Three ways of Presenting Data
• Textual
• Tabular
• Graphical
• How to Write Your Results
• Other Types of Figures
3. Textual
- Uses statements or sentences to describe the
data, to draw attention or to emphasize some
significant data.
Present results clearly and logically.
Avoid excess verbiage.
Consider providing a one-sentence summary at the
beginning of each paragraph if you think it will help your
reader understand your data.
4. Textual
The results should be short and sweet, without verbiage.
Do not say
“It is clearly evident from Fig. 1 that bird species
richness increased with habitat complexity.”
Say instead
“Bird species richness increased with habitat
complexity (Fig.1)”
5. • To pinpoint a trend, the best or the
representative case
• Do not deliberately leave out anomalous data
6. Textual
Example:
“Nitrogen fertilizer significantly increased soy bean total biomass
(p=0.05) regardless of the presence or absence Rhizobium (Table 1).”
i. The result of adding nitrogen is stated concisely.
ii. The word significantly is accompanied by the statistical probability level
(p= 0.05)
iii. The readers is referred to a table where the data to support the
statement can be found.
iv. The measure used (total biomass) is explicitly stated.
7. Tabular
- allows large amount of data to be sorted
and reorganized in a neat format
- allows data to be organized for further
analysis
- allows the inclusion of only the most
important or relevant data
- facilitates dialogue between the text and
the exact numbers in your results
8. Parts of a table
Table 1 Frequency of Stereotypic Behavior in Captive Lowland Gorillas Under Different
Stimulus With and Without Antidepressants
Group
Females
With
without
Males
With
Without
Females
With
Without
Males
With
Without
Note: Behaviours were taken at 3 second intervals
*1=lowest 4=highest
Title
Stubhead
Stub Morning Responses
Afternoon Responses
Table spanner
1 2 3 4
Table note Divider
56
39
23
48
18 12
32
15
3644
21
41 24
11
25
6
32
53
45
65
22
45
33
56
19
36
25
40
12
29
18
36
Table
body
Column
heads
9. Types of tables
a. Textual (Word) Table
Table 4. Tannin detection on the crude residue extracted from
different parts of mahogany
Test Leaves Bark Seeds
Gelatin test
Ferric
Chloride test
Positive
Condensed
Positive
Condensed
Positive
Condensed
10. Types of tables
b. Statistical table
Table 5. analysis of variance on the mean zones of inhibition
produced by Garin Farm fermented molasses at five different fermentation
periods
Test organism F value Significance Interpretation
Enterobacter
aerogenes
12.006 0.000 Significant
Pseudomonus
aeruginosa
24.654 0.000 Significant
Raltonia solanacearum 5.076 0.009 Significant
Xanthomonus oryzae
pv oryzicola
3.685 0.028 Significant
11. Table 2.t – test results of the weights and swim times of mice given
mineral water and mice given VCO before and after treatments
t - value significance interpretation
Mineral
water
Swim time
(Minutes)
- 1.151 0.279 Not
significant
VCO Swim time
(Minutes)
3.021 0.017 significant
12. Types of tables
c. Numerical
Table 2. Description of Trees with Nest holes of Visayan Taricite hornbills
(Penelopides panini)
site Common
name of
tree
Scientific name Circumference
(m)
Estimated
height
(m)
No. of nest
holes
I Talulo Pterocymhium tinctorium 1.845 30 3
Red Lauan Shorea negrosensis 1.832 50 1
White Lauan Shorea contorta 1.419 35 6
Malabuyo 2.616 50 1
II Red Lauan Shorea negrosensus 2.040 45 3
Almon Shorea almon 1.893 35 2
Red Lauan Shorea negrosensus 1.946 37 1
Guijo Shorea guiso 1.875 25 1
Red Lauan Shorea negrosensis 1.435 24 1
Red Lauan Shorea negrosensis 1.543 37 1
13. Guidelines for tables…
- Limit your data that are relevant to the hypotheses
of the study
- Table can stand alone without any explanation
- Always give units of measurements in tables
- Align decimal places
- Choose units of measurements as to avoid the use of
excessive number of digits
14. Guidelines for tables…
- Do not use tables if you only have two or fewer
columns and rows
- Organize your table, like elements read down, not
across
- If you have identical columns and rows of data in two
or more tables, combine the tables
- Don’t include columns of data that contain the same
value throughout. If the value is important to the
table include it in the caption or as a footnote to the
table
15. Guidelines for tables…
- In presenting numbers, give only significant
figures.
- Brief explanatory footnotes may be provided,
but not excessive experimental detail.
16. Graphical / Pictorial
The main objective in using a graphical device is
that the reader gains additional information (i.e
trends, relationships) from seeing the data in a
graphic display
This is the one main requirement in choosing
graphical devices over tables.
17. Considerations
1. It is constructed in relation to two axes.
2. If displaying only one variable, it is customary to
represent the sub-categories of a variable along
the X axis and the frequency of the category
along the Y axis.
3. It should have a title that describes its contents.
20. Time Plot
0
5
10
15
20
25
30
1 2 3 4 5 6 7 8 9
Species 1
Species 2
Species 3
Average Number of Flowers Blooming Over Time
Time in Months
Figure 6. Each line is for a single treatment. The x-axis shows the time interval and the y-
axis depicts the values of the dependent variable.
21. Guidelines for figures...
- Include a legend. It should be succinct yet provide
sufficient information for the reader to interpret
the figure without reference to the text.
- Provide each axis with brief but informative title.
- Don’t fill the entire page with the graph.
- Don’t extend the axes vary far beyond the range
of the data.
22. How to Write Chapter 4
Results Section
• The presentation of results is made such that
the sequence of data presented answers each
of the objectives stated in Chapter 4.
23. How to Write Chapter 4
Results Section
• Raw data are never included unless they are
needed.
• Present data in converted form.
• Use the text of the paper to state the
results, then refer the reader to a table or figure.
• Do not include the same data in both a table and
a figure.
• Number tables and figures separately beginning
with 1.
24. How to Write Chapter 4
Results Section
• Tables should generally report summary-level
data, such as means and standard deviations.
• Only use a figure (graph) when the data lend
themselves to a good visual representation.
• Avoid using figures that show too many
variables or trends at once.
• use text, tables and figures together for a
more effective result.
25. Example:
“A simple test result is obtained with a primer derived
from the human -satellite... This primer... Labels 6
sites in the PRINS reaction... After 10 cycles of PCR-
IS, the number of sites labeled has doubled (Fig.2b);
after 20 cycles, the number of sites labled is the same
but the signals are stringer (fig. 2c)...
(Rouwendal et al., July 93:80)”
The sample points out what is important in the
accompanying figure. It makes us aware of
relationships that we mat not notice quickly and is
important to the following discussion.
26. How to Write Chapter 4
Results Section
• Do not repeat all of the information in the text
that appears in a table. Summarize it.
Example:
“The temperature of the solution increased
rapidly at first, going from 50o to 80o in the
first three minutes (Table 1).”
27. How to Write Chapter 4
Results Section
• Do not abuse data graphics by referring to
them as: “It is clearly seen in Figure 1 that...”
• A table’s legend appears above it, while the
legend for a figure appears below the figure.
• Sparse or monotonously repetitive data need
not be tabulated or graphed.
• If only a few determinations were made or
need to be presented, give data in the text.
28. Other Types of Figures
LEADING CAUSES OF DEATH IN U.S. : 1990 Estimate
0 100 200 300 400 500 600 700 800 900 1000
Diseases of Heart and Blood Vessels 930,500
Cancer 506, 000
Accidents 93,600
Chronic Obstructive Pulmonary Disease 89,000
Pneumonia and Influenza 78,600
All Other Causes 464,300
Bar Graph: Horizontal
Number of Deaths (on thousands)
29. Figure 2-6 Wind Chill at 50o F
Effective temperature (o F)
Wind speed (mph)
50
45
40
35
30
25
20
15
10
5
50
45
40
36
32 30
0 5 10 15 20 25
Freezing
Bar Graph: Vertical
30. Subtypes
Figure 16.4 A stacked bar chart
Attitude towards uranium mining by gender
0
10
20
30
40
50
60
70
80
90
100
Males
Females
Numberofrespondents
Attitude
Stacked Bar Graph
31. Figure 16.5 The 100 per cent chart
0%
10%
20%
30%
40%
50%
60%
70%
80%
90%
100%
Females
Males
Attitude towards uranium mining by gender (hypothetical data)
Percentageofrespondetns
Female 4 5 3 4 25
Male 12 7 3 8 31
100 Percent Bar Graph
32. Figure 2-9 Pareto Chart Conditions That Might cause Lateness
20
15
13
9
8
5
3
Pareto Chart
34. Pie Chart
Pie Chart of Percentage of Plant Species in Habitat
Succulents
30%
Shrubs 25%
Annuals 20%
Trees 25%
Figure 7. Shown in the percentage of each type of pant in a fictitious habitat
39. A Guide to Writing in the Biological Sciences
http://classweb.gmuu.edu/biologyresources/writingguide/Results.htm
How To Write a Scientific Paper
By Susan Cordova for the New Mexico Junior Academy of Science
The Scientific Paper
A treatise by Gary Dillard
http://bioweb.wku.edu/courses/Biol398/Paper/paperText.html
Writing Guidelines
Writing in Science
http://writing.colostate.edu/guides/processes/science/pop2a.cfm
Elements of Scientific Papers and of Proposals
http://www.iit.edu/~tc/paper-elements.htm
Notes on the Structure of a Scientific Paper
40. Descriptive Statistics : RECOMMENDED
ALLOWED
Scale of Shape of the distribution
measurement Symmetrical, Skewed,
unimodal unimodal
Mean, Median,Mode Mean, Median
Ordinal Median, SIQR Median, SIQR
Median, Mode
Interval, Ratio Mean, SD Median, SIQR
Mean, Median,
Mode
41. 1. Nominal Date
• Mode is the only measure of central location that may be used;
• May also be expressed in percentage or in terms of frequencies
2. Bimodal Distributions (especially when mode values are widely
separated)
• Cannot be adequately described by a single measure of central
location
• The values of all modes may be reported
3. Use in inferential statistics
• The mean and the standard deviations are used, sometimes
overriding the shape of the frequency distribution and the level of
measurement.
Descriptive Statistics : SPECIAL CASES
42. INTERPRETING THE MEAN
• Summary of the information in the data – a single
value used to describe the entire sample for
population.
Example:
In Tando Island, Nueva Valencia, Guimaras, seasgrass
density was dominated by Halophila ovalis with a
mean value of 933 shoot/sq m.
43. INTERPRETING THE MEAN
• It is the typical value for the variable of interest. The
sample mean gives a fairly good idea of the true
population mean if the sample is representative of the
population.
Example:
The mean life time of all the 40000 Star light bulbs is 946
hours.
44. INTERPRETING THE MEAN
• Maybe used to make relative comparisons that are
confined to the data sets. May NOT be used to make
inferences about statistically significant differences.
Example:
The mean salinity in the 4 study sites ranges from
30.5 ppt to 37.8 ppt. Relatively, the study area in
Tando, Guimaras had the most saline waters while
that of Looc, Romblon had the least saline waters.
45. INTERPRETING THE STANDARD DEVIATION
Example:
No. of species of Nerita in selected island in the Phils.
Large Island Mainland
4 2 3 9 6 8
2 2 2 7 10 3
6 2 2 9 6 3
3 3 2 7 2 3
Mean = 2.8 + 1.22 Mean = 6.2 + 2.75
46. INTERPRETING THE STANDARD DEVIATION
Used to asses the extent to which the data disperse; how
the values differ from the mean.
Example:
Mainland
9 6 8 Stad.Dev. =.2.75
7 10 3 Mean = 6.1
9 6 3 N= 12.00
7 2 3
Magnitude
Mean = 6.1 + 2.75 (3.35-8.85)
0
1
2
3
4
2 4 6 8 10
Column1
47. INTERPRETING THE MEAN
Gives an idea of the consistency of values
Example:
In big blossom green house, the mean diameter of
hybrid A rose bushes is 6.0 + 3.07 inches while that
of hybrid B is 6.0 + is 1.07 inches. This means that
the blossoms of hybrid are less consistent than
those of hybrid B. So if a garden wants a bush that
consistently produces roses close to 6 inches in
diameter, he must use hybrid B.
48. REFERENCES
Aczel AD. 1995. Statistics concepts and applications. Chicago: Irwin. 533 p.
Brase CH, Brase CP. 1995 . Understandable statistics concepts and methods fifth
edition. Lexington, Massachusetts; D.C. Health and Company. 849 p.
Freund JE, Simon GA. 1997. Modern Elementary Statistics. Singapore: Prentice Hall
International, Inc. 612 p.
Iman RL. 1995. A data based approach to statistics concise version. Belmont: Duxbury
Press. 577 p.
Kiess HO. 1996. Statistical concepts for the behavioral scinces second edition. Boston:
Allyn and bacon. 604 p.
Milton JS, McTeer PM, Corbet JJ. 1997. Introduction to statistics. New York: The
Mcgraw-Hill Companies, Inc. 622 p.