1. The World of Truck tyres in may 2017
Source: Eurostat, Michelin, Continental, World Bank, OECD, US Government
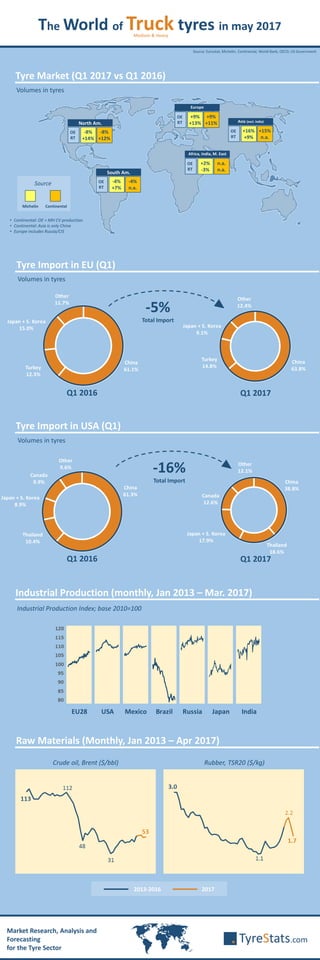
Tyre Market (Q1 2017 vs Q1 2016)
Crude oil, Brent ($/bbl) Rubber, TSR20 ($/kg)
North Am.
OE
RT
Industrial Production Index; base 2010=100
-8%
+14%
-8%
+12%
• Continental: OE = MH CV production.
• Continental: Asia is only China
• Europe includes Russia/CIS
Industrial Production (monthly, Jan 2013 – Mar. 2017)
Raw Materials (Monthly, Jan 2013 – Apr 2017)
South Am.
OE
RT
-4%
+7%
-4%
n.a.
Africa, India, M. East
OE
RT
+2%
-3%
n.a.
n.a.
Europe
OE
RT
+9%
+13%
+9%
+11% Asia (excl. India)
OE
RT
+16%
+9%
+15%
n.a.
Medium & Heavy
EU28 USA Mexico Brazil Russia Japan India
Volumes in tyres
Tyre Import in USA (Q1)
Tyre Import in EU (Q1)
-5%
Total Import
Volumes in tyres
Q1 2016 Q1 2017
Q1 2016 Q1 2017
-16%
Total Import
Market Research, Analysis and
Forecasting
for the Tyre Sector
Volumes in tyres
Michelin Continental
Source
2013-2016 2017