SlideShare a Scribd company logo
1 of 9
Download to read offline
News Release
FOR IMMEDIATE RELEASE:
Home buyers were less active in February
VANCOUVER, BC – March 2, 2018 – Metro Vancouver* home sales dipped below the long-
term historical average in February.
The Real Estate Board of Greater Vancouver (REBGV) reports that residential property sales in
the region totalled 2,207 in February 2018, a nine per cent decrease from the 2,424 sales
recorded in February 2017, and a 21.4 per cent increase compared to January 2018 when 1,818
homes sold.
Last month’s sales were 14.4 per cent below the 10-year February sales average. By property
type, detached sales were down 39.4 per cent over the same period, attached sales were down 6.8
per cent, and apartment sales were 5.5 per cent above the 10-year February average.
“Rising interest rates and stricter mortgage requirements have reduced home buyers’ purchasing
power, particularly for those at the entry level of our market,” Jill Oudil, REBGV president said.
“Even still, the supply of apartment and townhome properties for sale today is unable to meet
demand. On the other hand, our detached home market is beginning to enter buyers’ market
territory.”
There were 4,223 detached, attached and apartment properties newly listed for sale on the
Multiple Listing Service® (MLS®) in Metro Vancouver in February 2018. This represents a
15.2 per cent increase compared to the 3,666 homes listed in February 2017 and an 11.2 per cent
increase compared to January 2018 when 3,796 homes were listed.
The total number of homes currently listed for sale on the MLS® system in Metro Vancouver is
7,822, a three per cent increase compared to February 2017 (7,594) and a 12.6 per cent increase
compared to January 2018 (6,947).
“The spring is traditionally the busiest time for home buyers and sellers in our market. We’ll
wait to see how they react to the taxes and other policy measures that our provincial and federal
governments have introduced so far this year,” Oudil said. “To help you navigate these changes
in today’s housing market, it’s important to work with your local REALTOR®.”
For all property types, the sales-to-active listings ratio for February 2018 is 28.2 per cent. By
property type, the ratio is 13 per cent for detached homes, 37.6 per cent for townhomes, and 59.7
per cent for condominiums.
Generally, analysts say that downward pressure on home prices occurs when the ratio dips below
the 12 per cent mark for a sustained period, while home prices often experience upward pressure
when it surpasses 20 per cent over several months.
The MLS® Home Price Index composite benchmark price for all residential properties in Metro
Vancouver is currently $1,071,800. This represents a 16.9 per cent increase over February 2017
and a 1.4 per cent increase compared to January 2018.
Sales of detached properties in February 2018 reached 621, a 16.6 per cent decrease from the 745
detached sales recorded in February 2017. The benchmark price for detached properties is
$1,602,000. This represents an 8.2 per cent increase from February 2017 and is virtually
unchanged from January 2018.
Sales of apartment properties reached 1,185 in February 2018, a 7.1 per cent decrease compared
to the 1,275 sales in February 2017. The benchmark price of an apartment property is $682,800.
This represents a 27.2 per cent increase from February 2017 and a 2.6 per cent increase
compared to January 2018.
Attached property sales in February 2018 totalled 401, a 0.7 per cent decrease compared to the
404 sales in February 2017. The benchmark price of an attached unit is $819,200. This represents
an 18.1 per cent increase from February 2017 and a 1.9 per cent increase compared to January
2018.
-30-
*Editor’s Note: Areas covered by the Real Estate Board of Greater Vancouver include: Whistler, Sunshine Coast,
Squamish, West Vancouver, North Vancouver, Vancouver, Burnaby, New Westminster, Richmond, Port Moody,
Port Coquitlam, Coquitlam, Pitt Meadows, Maple Ridge, and South Delta.
The real estate industry is a key economic driver in British Columbia. In 2017, 35,993 homes changed ownership in
the Board’s area, generating $2.4 billion in economic spin-off activity and an estimated 17,600 jobs. The total dollar
value of residential sales transacted through the MLS® system in Greater Vancouver totalled $37 billion in 2017.
The Real Estate Board of Greater Vancouver is an association representing more than 14,000 REALTORS® and
their companies. The Board provides a variety of member services, including the Multiple Listing Service®. For
more information on real estate, statistics, and buying or selling a home, contact a local REALTOR® or visit
www.rebgv.org.
For more information please contact:
Craig Munn
Manager, Communication
Real Estate Board of Greater Vancouver
604.730.3146
cmunn@rebgv.org
Property Type Area
Benchmark
Price
Price
Index
1 Month
Change %
3 Month
Change %
6 Month
Change %
1 Year
Change %
3 Year
Change %
5 Year
Change %
10 Year
Change %
Residential / Composite Lower Mainland $977,500 275.8 1.7% 3.3% 5.1% 19.1% 67.8% 81.8% 89.4%
Greater Vancouver $1,071,800 280.2 1.4% 2.4% 4.1% 16.9% 63.3% 79.8% 90.9%
Bowen Island $974,600 211.3 3.5% 0.6% 3.5% 18.7% 65.9% 67.4% 54.3%
Burnaby East $977,800 272.0 2.1% 2.7% 1.6% 16.3% 60.2% 75.7% 85.8%
Burnaby North $931,600 281.3 1.6% 4.2% 6.2% 16.9% 66.4% 81.1% 90.7%
Burnaby South $1,037,000 292.9 1.6% 3.5% 5.3% 17.1% 66.2% 86.0% 102.3%
Coquitlam $945,700 280.5 1.3% 3.0% 4.9% 22.3% 72.6% 90.8% 95.1%
Ladner $865,700 243.0 -0.2% -0.8% 2.5% 10.4% 51.7% 60.8% 73.6%
Maple Ridge $718,200 241.5 2.6% 4.6% 8.2% 24.6% 77.6% 81.9% 72.1%
New Westminster $693,600 297.3 2.7% 5.8% 7.6% 27.9% 79.1% 89.4% 96.6%
North Vancouver $1,110,300 249.5 1.5% 0.8% 1.7% 13.6% 56.8% 73.3% 77.1%
Pitt Meadows $709,700 259.6 1.4% 4.5% 9.3% 27.0% 74.7% 86.9% 81.4%
Port Coquitlam $754,400 266.1 2.4% 3.1% 5.1% 24.4% 77.3% 89.4% 82.0%
Port Moody $948,200 262.1 2.1% 3.7% 7.6% 23.2% 70.5% 89.7% 84.7%
Richmond $1,019,900 297.8 0.5% 3.7% 4.7% 16.3% 65.2% 80.4% 104.1%
Squamish $820,600 262.7 2.0% 0.2% 8.6% 18.4% 80.1% 112.5% 98.1%
Sunshine Coast $588,800 206.3 0.6% -0.6% 2.3% 16.4% 67.7% 67.5% 49.1%
Tsawwassen $995,900 250.1 -0.3% -1.7% 0.8% 10.1% 58.1% 67.5% 77.1%
Vancouver East $1,106,100 323.9 1.1% 1.6% 2.6% 16.1% 64.9% 86.9% 113.4%
Vancouver West $1,374,800 289.9 1.4% 1.0% 2.1% 12.8% 55.4% 75.7% 90.0%
West Vancouver $2,656,600 285.6 1.8% 0.9% 0.1% 8.4% 49.5% 71.4% 94.8%
Whistler $981,900 215.9 4.2% 0.9% 12.1% 21.6% 78.9% 110.6% 64.4%
Single Family Detached Lower Mainland $1,328,300 281.8 0.4% 0.6% 0.1% 10.8% 60.3% 79.0% 98.2%
Greater Vancouver $1,602,000 294.4 0.0% -0.4% -0.8% 8.2% 55.4% 76.9% 103.5%
Bowen Island $974,600 211.3 3.5% 0.6% 3.5% 18.7% 65.9% 67.4% 54.3%
Burnaby East $1,281,200 286.5 1.1% 1.2% -3.0% 10.4% 61.4% 75.4% 100.5%
Burnaby North $1,532,700 296.4 -2.2% -2.0% -3.8% 2.2% 48.2% 68.6% 101.1%
Burnaby South $1,682,600 322.1 0.9% -0.2% -2.0% 2.8% 55.6% 82.8% 126.8%
Coquitlam $1,277,900 283.6 -0.2% -0.5% -0.1% 14.0% 62.1% 83.2% 101.6%
Ladner $1,003,900 242.0 -1.3% -3.0% 0.4% 5.8% 51.2% 60.6% 76.3%
Maple Ridge $847,700 241.5 1.7% 4.0% 5.5% 19.3% 76.3% 86.6% 76.0%
New Westminster $1,159,700 289.3 1.0% 1.7% -1.4% 12.3% 63.9% 77.1% 102.2%
North Vancouver $1,686,800 263.8 1.0% -0.6% -1.4% 6.7% 56.8% 81.4% 88.6%
Pitt Meadows $912,400 257.1 0.9% 3.0% 4.0% 18.2% 70.3% 84.6% 85.4%
Port Coquitlam $986,400 263.0 0.8% -1.4% -1.6% 14.6% 65.7% 80.3% 86.4%
Port Moody $1,483,700 274.0 -0.7% -1.2% -0.5% 10.7% 60.2% 83.4% 92.8%
Richmond $1,697,900 341.0 0.4% 1.6% 1.3% 8.8% 61.1% 82.6% 130.2%
Squamish $993,600 253.6 -0.9% -1.9% 1.8% 13.3% 72.9% 98.3% 92.9%
Sunshine Coast $585,200 205.0 0.3% -0.6% 2.3% 16.5% 67.6% 66.9% 48.1%
Tsawwassen $1,249,300 269.0 -1.0% -2.6% -0.6% 8.5% 63.9% 77.0% 90.4%
Vancouver East $1,560,400 344.9 -0.2% -0.8% -0.3% 9.5% 57.5% 92.1% 137.5%
Vancouver West $3,500,600 359.4 -1.3% -2.0% -4.2% 2.3% 45.7% 74.8% 123.6%
West Vancouver $3,141,900 296.6 1.4% -0.1% -1.5% 5.9% 47.7% 72.3% 98.5%
Whistler $1,679,900 213.0 0.0% -0.7% 2.6% 12.7% 67.6% 83.3% 62.2%
HOW TO READ THE TABLE:
• Benchmark Price: Estimated sale price of a benchmark property. Benchmarks represent a typical property within each market.
• Price Index: Index numbers estimate the percentage change in price on typical and constant quality properties over time. All figures are based on past sales.
• x Month/Year Change %: Percentage change of index over a period of x month(s)/year(s) *
In January 2005, the indexes are set to 100.
Townhome properties are similar to Attached properties, a category that was used in the previous MLSLink HPI, but do not included duplexes.
The above info is deemed reliable, but is not guaranteed. All dollar amounts in CDN.
February 2018*
* MLS®, Multiple Listing Service®, and all related graphics are trademarks of The Canadian Real Estate Association 1 of 15
Property Type Area
Benchmark
Price
Price
Index
1 Month
Change %
3 Month
Change %
6 Month
Change %
1 Year
Change %
3 Year
Change %
5 Year
Change %
10 Year
Change %
February 2018*
Townhouse Lower Mainland $694,800 251.1 2.0% 3.1% 6.3% 20.8% 66.8% 74.0% 76.7%
Greater Vancouver $819,200 264.3 1.9% 1.7% 5.3% 18.1% 63.5% 74.5% 84.6%
Burnaby East $684,900 253.0 2.6% 4.5% 8.8% 25.6% 56.5% 67.0% 75.8%
Burnaby North $752,000 280.7 2.5% 5.7% 7.8% 24.0% 62.3% 77.0% 88.6%
Burnaby South $807,600 278.2 2.7% 6.2% 4.5% 22.0% 61.5% 75.2% 92.7%
Coquitlam $680,600 249.7 2.7% 3.4% 6.3% 20.1% 63.6% 73.9% 78.6%
Ladner $783,200 273.1 0.9% 3.5% 6.7% 19.5% 61.9% 74.3% 84.2%
Maple Ridge $551,400 256.0 3.3% 3.5% 8.5% 29.9% 82.1% 77.8% 78.6%
New Westminster $712,700 281.8 2.7% 4.4% 9.2% 24.7% 62.3% 76.6% 92.4%
North Vancouver $998,400 242.6 0.7% 1.5% 3.1% 14.3% 59.0% 66.4% 76.2%
Pitt Meadows $587,300 254.1 -0.5% 0.9% 4.3% 22.3% 78.6% 83.1% 77.6%
Port Coquitlam $656,100 247.5 3.2% 3.1% 2.1% 20.7% 72.2% 76.8% 73.7%
Port Moody $644,800 217.9 1.9% 4.0% 5.9% 24.8% 46.9% 56.6% 52.3%
Richmond $819,500 269.3 -0.4% 1.7% 2.4% 13.0% 57.4% 69.2% 89.6%
Squamish $848,600 308.3 7.8% -3.9% 21.4% 16.3% 93.4% 157.3% 133.2%
Tsawwassen $756,000 281.6 -0.9% 0.3% 5.0% 17.9% 63.5% 73.6% 89.9%
Vancouver East $868,900 285.2 1.3% 0.8% 1.2% 16.2% 64.1% 68.2% 84.4%
Vancouver West $1,250,100 276.1 0.2% -1.4% -0.3% 11.1% 59.7% 72.8% 90.0%
Whistler $993,200 265.6 8.6% -4.8% 21.9% 17.8% 76.9% 128.4% 105.4%
Apartment Lower Mainland $641,800 280.6 3.0% 6.8% 11.5% 31.1% 80.8% 90.2% 85.0%
Greater Vancouver $682,800 274.4 2.6% 5.3% 8.9% 27.2% 74.6% 86.4% 82.8%
Burnaby East $706,700 268.3 2.8% 5.7% 5.8% 29.6% 65.6% 91.2% 69.3%
Burnaby North $642,500 274.3 3.9% 8.1% 13.5% 28.4% 85.7% 93.9% 86.2%
Burnaby South $710,100 285.1 1.8% 5.3% 9.7% 26.4% 77.1% 93.0% 93.9%
Coquitlam $525,300 288.3 2.5% 6.5% 10.2% 34.6% 94.5% 110.0% 91.2%
Ladner $443,300 210.1 2.8% 2.3% 5.7% 16.5% 39.7% 44.0% 50.0%
Maple Ridge $307,800 222.3 5.6% 10.1% 22.1% 47.3% 79.4% 71.8% 46.3%
New Westminster $529,100 301.6 3.1% 7.1% 10.2% 34.3% 87.4% 95.5% 95.3%
North Vancouver $580,700 236.4 2.4% 2.5% 5.4% 24.4% 59.6% 67.7% 65.4%
Pitt Meadows $452,100 267.2 3.6% 9.2% 21.0% 45.8% 78.4% 92.9% 75.8%
Port Coquitlam $468,000 279.9 3.6% 7.4% 13.5% 37.4% 94.2% 109.5% 79.7%
Port Moody $668,300 278.5 4.0% 7.3% 15.1% 34.1% 95.0% 115.2% 97.9%
Richmond $657,800 280.8 1.2% 7.3% 10.7% 30.5% 80.8% 89.5% 91.4%
Squamish $488,100 235.1 -0.5% 8.7% 6.8% 32.0% 79.2% 108.6% 74.1%
Tsawwassen $471,000 198.6 2.3% 0.7% 4.9% 16.6% 44.1% 44.0% 41.8%
Vancouver East $565,300 311.9 2.4% 4.6% 6.8% 26.7% 77.6% 87.4% 94.1%
Vancouver West $835,800 271.2 2.9% 3.0% 6.1% 20.5% 65.5% 81.0% 79.7%
West Vancouver $1,237,100 250.6 4.9% 7.1% 9.7% 26.2% 66.2% 70.7% 83.7%
Whistler $547,200 179.4 2.5% 9.9% 8.6% 34.7% 107.4% 145.1% 34.7%
HOW TO READ THE TABLE:
• Benchmark Price: Estimated sale price of a benchmark property. Benchmarks represent a typical property within each market.
• Price Index: Index numbers estimate the percentage change in price on typical and constant quality properties over time. All figures are based on past sales.
• x Month/Year Change %: Percentage change of index over a period of x month(s)/year(s)
In January 2005, the indexes are set to 100. *
Townhome properties are similar to attached properties, a category that was used in the previous MLSLink HPI, but do not included duplexes.
Lower Mainland includes areas serviced by both Real Estate Board of Greater Vancouver & Fraser Valley Real Estate Board.
The above info is deemed reliable, but is not guaranteed. All dollar amounts in CDN.
* MLS®, Multiple Listing Service®, and all related graphics are trademarks of The Canadian Real Estate Association 2 of 15
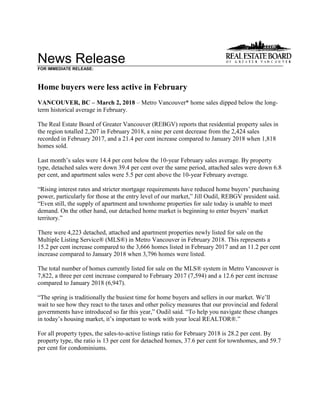
C:DATAMonthEndHpiexporthi_resgv-hpi2.tifGreaterVancouver
5YearTrend
60
110
160
210
260
310
Feb 2013
Apr 2013
Jun 2013
Aug 2013
Oct 2013
Dec 2013
Feb 2014
Apr 2014
Jun 2014
Aug 2014
Oct 2014
Dec 2014
Feb 2015
Apr 2015
Jun 2015
Aug 2015
Oct 2015
Dec 2015
Feb 2016
Apr 2016
Jun 2016
Aug 2016
Oct 2016
Dec 2016
Feb 2017
Apr 2017
Jun 2017
Aug 2017
Oct 2017
Dec 2017
Feb 2018
Price
Index
ResidentialDetachedTownhouseApartment
Jan2005HPI=100
2252018MLS®
SALESFacts
Burnaby
Coquitlam
Delta-South
Islands-Gulf
MapleRidge/PittMeadows
NewWestminster
NorthVancouver
PortCoquitlam
PortMoody/Belcarra
Richmond
Squamish
SunshineCoast
VancouverEast
VancouverWest
WestVancouver/HoweSound
Whistler/Pemberton
Detached526030185225827852183577532419621
Attached6030713912201912662073744522401
Apartment14487110656687382214318412733212291,185
Detached$1,720,000$1,340,000$1,100,000n/a$882,500$1,300,000$1,740,000$1,025,000n/a$1,700,000n/a$670,000$1,600,000$3,433,333$2,855,000n/a
Attached$792,950$771,000n/an/a$577,750n/a$988,000n/an/a$854,350$636,000n/a$1,180,000$1,385,000n/a$1,179,000n/a
Apartment$595,150$546,000n/an/a$405,000$535,000$709,500$434,850$599,500$568,000n/an/a$632,222$873,000n/a$460,000
Detached56561417411301336663645461515487
Attached3519804213271611611052524419319
Apartment112801308272752932145666724323271,012
Detached$1,650,000$1,265,000n/an/a$879,960n/a$1,637,500n/an/a$1,760,000n/a$624,500$1,596,000$3,600,000n/an/a
Attached$730,000n/an/an/a$548,500n/a$879,000n/an/a$885,000n/an/a$899,900$1,519,000n/an/an/a
Apartment$650,000$552,500n/an/a$351,250$501,000$691,500$425,000$595,450$600,000n/an/a$619,450$880,000$1,449,000$259,000
Detached476635479788271292164482933518745
Attached36302305214331666914102840627404
Apartment137971503987943731177141511936916281,275
Detached$1,535,500$1,227,000$992,500n/a$718,000n/a$1,627,500$870,500n/a$1,484,444n/a$577,500$1,499,000$3,120,000$3,210,000n/a
Attached$649,500$707,500$630,000n/a$466,000n/a$920,000n/an/a$745,900n/an/a$973,000$1,476,500n/a$758,000n/a
Apartment$495,000$463,000n/an/a$294,500$420,000$511,500$361,000$442,000$490,000n/an/a$540,000$694,500n/a$317,000
Detached1081164421593388401111824711229939341,108
Attached9549151812547352312730126268941720
Apartment2561672401471381626754288241019457535562,197
Detached$1,682,500$1,302,500$1,100,000n/a$882,500$1,299,000$1,690,000$992,250n/a$1,750,000$897,450$640,000$1,599,500$3,500,000$2,910,000$2,475,000
Attached$750,000$775,000n/an/a$562,500$769,000$910,000$685,000$725,100$874,000$669,000n/a$1,129,000$1,445,000n/a$1,160,000n/a
Apartment$610,000$550,000$515,000n/a$372,000$510,000$697,000$430,000$595,450$579,500$442,450n/a$625,900$876,000$1,449,000$362,500
Detached87101548136181224120147327613312955301,189
Attached6349311811946301911625164064949658
Apartment245157260741341536853300222219458029432,100
Detached$1,500,000$1,175,000$1,000,000n/a$694,500n/a$1,610,000$849,900$1,288,000$1,500,000$867,500$536,500$1,422,500$3,060,000$3,125,000$1,890,000
Attached$668,000$700,000$629,900n/a$455,000n/a$928,000$547,550n/a$750,000$593,000n/a$910,500$1,300,000n/a$758,000n/a
Apartment$492,500$457,450$470,000n/a$294,000$415,000$520,000$334,100$445,500$452,800$372,000$283,250$521,900$685,000$1,126,000$315,000
Note:MedianSellingPricesarenotreportedforareaswithlessthan20salesorfortheGulfIslands
Number
of
Sales
February
2018
Number
of
Sales
Median
Selling
Price
Number
of
Sales
Median
Selling
Price
Number
of
Sales
Median
Selling
Price
January
2018
February
2017
Jan.-
Feb.2018
Jan.-
Feb.2017
Median
Selling
Price
Number
of
Sales
Median
Selling
Price
February
2018
Year-to-date
Year-to-date
2252018MLS®
LISTINGSFacts
Burnaby
Coquitlam
Delta-South
Islands-Gulf
MapleRidge/PittMeadows
NewWestminster
NorthVancouver
PortCoquitlam
PortMoody/Belcarra
Richmond
Squamish
SunshineCoast
VancouverEast
VancouverWest
WestVancouver/HoweSound
Whistler/Pemberton
Detached1591288241503414743292834368216248155211,810
Attached83521124713383523116251666961432669
Apartment1691141907490131493423719418753634471,744
Detached33%47%37%25%57%65%39%63%28%18%42%51%36%21%15%90%
Attached72%58%64%50%83%92%53%54%52%57%80%44%56%46%36%69%n/a
Apartment85%76%58%n/a88%73%66%78%65%60%95%100%68%62%35%62%
Detached1641398481172714437202363966176268137131,675
Attached7842142632834291410416473811620618
Apartment1808518058831113633198251014345331391,503
Detached34%40%17%13%63%41%21%35%15%28%15%55%26%17%11%115%
Attached45%45%57%0%67%46%79%55%79%59%63%125%34%30%25%95%n/a
Apartment62%94%72%n/a141%87%68%81%97%73%24%60%47%54%74%69%
Detached1491146731082313643241903562180166116171,433
Attached7433171752337321510223760671537618
Apartment20211514073991135443207131116445618331,615
Detached32%58%52%133%73%30%65%63%50%48%46%71%46%56%30%106%
Attached49%91%135%0%69%61%89%50%40%68%61%143%47%60%40%73%n/a
Apartment68%84%107%n/a53%88%83%69%72%86%108%136%73%81%89%85%
Detached3232671661226761291804951982134392516292343,485
Attached1619425411041726437220412013917730521,287
Apartment3491993701321732428567435441433098965863,247
Detached33%43%27%17%60%54%30%50%22%23%29%53%31%19%13%100%
Attached59%52%60%25%74%61%65%55%62%58%73%60%45%38%30%79%n/a
Apartment73%84%65%n/a111%80%67%79%81%66%55%71%59%58%54%65%
Detached327229173924242273874853466128399475282403,354
Attached1457142113740695423208571710114025631,193
Apartment40723840012019523910578417271831795039693,259
Detached27%44%31%89%56%43%45%47%42%28%48%59%33%27%20%75%
Attached43%69%74%100%59%48%67%56%83%56%44%94%40%46%36%78%n/a
Apartment60%66%65%n/a62%69%64%65%68%72%81%122%61%61%74%62%
*Year-to-datelistingsrepresentacumulativetotaloflistingsratherthantotalactivelistings.
%Salesto
Listings
Number
of
Listings
%Salesto
Listings
January
2018
February
2017
Jan.-
Feb.2018
Jan.-
Feb.2017
%Salesto
Listings
Number
of
Listings
%Salesto
Listings
Number
of
Listings
February
2018
Number
of
Listings
%Salesto
Listings
Number
of
Listings
February
2018
Year-to-date*
Year-to-date*
Listing & Sales Activity Summary
Listings Sales
1 2 3 Col. 2 & 3 5 6 7 Col. 6 & 7 9 10 Col. 9 & 10
Feb Jan Feb Percentage Feb Jan Feb Percentage Dec 2016 - Dec 2017 - Percentage
2017 2018 2018 Variance 2017 2018 2018 Variance Feb 2017 Feb 2018 Variance
BURNABY % % %
DETACHED 149 164 159 -3.0 47 56 52 -7.1 129 152 17.8
ATTACHED 74 78 83 6.4 36 35 60 71.4 90 140 55.6
APARTMENTS 202 180 169 -6.1 137 112 144 28.6 354 401 13.3
COQUITLAM
DETACHED 114 139 128 -7.9 66 56 60 7.1 148 166 12.2
ATTACHED 33 42 52 23.8 30 19 30 57.9 67 81 20.9
APARTMENTS 115 85 114 34.1 97 80 87 8.8 219 246 12.3
DELTA
DETACHED 67 84 82 -2.4 35 14 30 114.3 72 70 -2.8
ATTACHED 17 14 11 -21.4 23 8 7 -12.5 39 23 -41.0
APARTMENTS 14 18 19 5.6 15 13 11 -15.4 36 29 -19.4
MAPLE RIDGE/PITT MEADOWS
DETACHED 108 117 150 28.2 79 74 85 14.9 202 241 19.3
ATTACHED 75 63 47 -25.4 52 42 39 -7.1 115 121 5.2
APARTMENTS 73 58 74 27.6 39 82 65 -20.7 102 187 83.3
NORTH VANCOUVER
DETACHED 136 144 147 2.1 88 30 58 93.3 170 158 -7.1
ATTACHED 37 34 38 11.8 33 27 20 -25.9 62 68 9.7
APARTMENTS 113 111 131 18.0 94 75 87 16.0 226 240 6.2
NEW WESTMINSTER
DETACHED 23 27 34 25.9 7 11 22 100.0 27 50 85.2
ATTACHED 23 28 13 -53.6 14 13 12 -7.7 25 39 56.0
APARTMENTS 99 83 90 8.4 87 72 66 -8.3 202 223 10.4
PORT MOODY/BELCARRA
DETACHED 24 20 29 45.0 12 3 8 166.7 30 21 -30.0
ATTACHED 15 14 23 64.3 6 11 12 9.1 28 38 35.7
APARTMENTS 43 33 34 3.0 31 32 22 -31.3 75 65 -13.3
PORT COQUITLAM
DETACHED 43 37 43 16.2 27 13 27 107.7 64 60 -6.3
ATTACHED 32 29 35 20.7 16 16 19 18.8 40 52 30.0
APARTMENTS 54 36 49 36.1 37 29 38 31.0 93 99 6.5
RICHMOND
DETACHED 190 236 283 19.9 92 66 52 -21.2 206 185 -10.2
ATTACHED 102 104 116 11.5 69 61 66 8.2 163 204 25.2
APARTMENTS 207 198 237 19.7 177 145 143 -1.4 429 429 0.0
SUNSHINE COAST
DETACHED 62 66 68 3.0 44 36 35 -2.8 119 120 0.8
ATTACHED 7 4 16 300.0 10 5 7 40.0 19 17 -10.5
APARTMENTS 11 10 4 -60.0 15 6 4 -33.3 26 16 -38.5
SQUAMISH
DETACHED 35 39 43 10.3 16 6 18 200.0 39 38 -2.6
ATTACHED 23 16 25 56.3 14 10 20 100.0 37 48 29.7
APARTMENTS 13 25 19 -24.0 14 6 18 200.0 38 35 -7.9
VANCOUVER EAST
DETACHED 180 176 216 22.7 82 45 77 71.1 196 210 7.1
ATTACHED 60 73 66 -9.6 28 25 37 48.0 65 95 46.2
APARTMENTS 164 143 187 30.8 119 67 127 89.6 288 310 7.6
VANCOUVER WEST
DETACHED 166 268 248 -7.5 93 46 53 15.2 193 135 -30.1
ATTACHED 67 81 96 18.5 40 24 44 83.3 87 94 8.0
APARTMENTS 456 453 536 18.3 369 243 332 36.6 817 826 1.1
WHISTLER/PEMBERTON
DETACHED 17 13 21 61.5 18 15 19 26.7 37 47 27.0
ATTACHED 37 20 32 60.0 27 19 22 15.8 66 60 -9.1
APARTMENTS 33 39 47 20.5 28 27 29 7.4 71 74 4.2
WEST VANCOUVER/HOWE SOUND
DETACHED 116 137 155 13.1 35 15 24 60.0 86 69 -19.8
ATTACHED 15 16 14 -12.5 6 4 5 25.0 12 10 -16.7
APARTMENTS 18 31 34 9.7 16 23 12 -47.8 39 45 15.4
GRAND TOTALS
DETACHED 1430 1667 1806 8.3 741 486 620 27.6 1718 1722 0.2
ATTACHED 617 616 667 8.3 404 319 400 25.4 915 1090 19.1
APARTMENTS 1615 1503 1744 16.0 1275 1012 1185 17.1 3015 3225 7.0
ResidentialAverageSalePrices-January1977toFebruary2018
0
200
400
600
800
1000
1200
1400
1600
1800
2000
1977
1978
1979
1980
1981
1982
1983
1984
1985
1986
1987
1988
1989
1990
1991
1992
1993
1994
1995
1996
1997
1998
1999
2000
2001
2002
2003
2004
2005
2006
2007
2008
2009
2010
2011
2012
2013
2014
2015
2016
2017
2018
DETACHEDCONDOMINIUMATTACHEDAPARTMENTS
INTHOUSANDS($)
NOTE:From1977-1984condominiumaverageswerenotseparatedintoattached&apartment.
$938,805
$750,052
$1,737,030

More Related Content

What's hot

December 2020 Victoria Real Estate Board Statistics
December 2020 Victoria Real Estate Board StatisticsDecember 2020 Victoria Real Estate Board Statistics
December 2020 Victoria Real Estate Board StatisticsVicky Aulakh
 
Rebgv stats-pkg-april-2018
Rebgv stats-pkg-april-2018Rebgv stats-pkg-april-2018
Rebgv stats-pkg-april-2018Kathryn Huang
 
2021 June - REBGV Statistics Package
2021 June - REBGV Statistics Package2021 June - REBGV Statistics Package
2021 June - REBGV Statistics PackageVicky Aulakh
 
Real Estate Board of Greater Vancouver Statistics Package March 2021
Real Estate Board of Greater Vancouver Statistics Package March 2021Real Estate Board of Greater Vancouver Statistics Package March 2021
Real Estate Board of Greater Vancouver Statistics Package March 2021Vicky Aulakh
 
Real Estate Board of Greater Vancouver Statistics Package July 2021
Real Estate Board of Greater Vancouver Statistics Package July 2021Real Estate Board of Greater Vancouver Statistics Package July 2021
Real Estate Board of Greater Vancouver Statistics Package July 2021Vicky Aulakh
 
Rebgv stats-pkg-december-2019
Rebgv stats-pkg-december-2019Rebgv stats-pkg-december-2019
Rebgv stats-pkg-december-2019Vicky Aulakh
 
Real Estate Board of Greater Vancouver Statistics Package - November 2021
Real Estate Board of Greater Vancouver Statistics Package - November 2021Real Estate Board of Greater Vancouver Statistics Package - November 2021
Real Estate Board of Greater Vancouver Statistics Package - November 2021VickyAulakh1
 
REBGV Statistics package July 2020
REBGV Statistics package July 2020REBGV Statistics package July 2020
REBGV Statistics package July 2020Vicky Aulakh
 
Real Estate Board of Greater Vancouver Statistics Package November 2020
Real Estate Board of Greater Vancouver Statistics Package November 2020Real Estate Board of Greater Vancouver Statistics Package November 2020
Real Estate Board of Greater Vancouver Statistics Package November 2020Vicky Aulakh
 
Rebgv stats-pkg-july-2019
Rebgv stats-pkg-july-2019Rebgv stats-pkg-july-2019
Rebgv stats-pkg-july-2019Vicky Aulakh
 
REBGV Statistics Package April 2021
REBGV Statistics Package April 2021REBGV Statistics Package April 2021
REBGV Statistics Package April 2021Vicky Aulakh
 
Rebgv stats-pkg-may-2019
Rebgv stats-pkg-may-2019Rebgv stats-pkg-may-2019
Rebgv stats-pkg-may-2019Kathryn Huang
 
REBGV January 2020 Statistics Package
REBGV January 2020 Statistics Package REBGV January 2020 Statistics Package
REBGV January 2020 Statistics Package Vicky Aulakh
 
Real Estate Board of Greater Vancouver Statistics Package August 2021
Real Estate Board of Greater Vancouver Statistics Package August 2021Real Estate Board of Greater Vancouver Statistics Package August 2021
Real Estate Board of Greater Vancouver Statistics Package August 2021Vicky Aulakh
 
Rebgv stats-pkg-april-2019
Rebgv stats-pkg-april-2019Rebgv stats-pkg-april-2019
Rebgv stats-pkg-april-2019Kathryn Huang
 
Rebgv stats-pkg-may-2021
Rebgv stats-pkg-may-2021Rebgv stats-pkg-may-2021
Rebgv stats-pkg-may-2021BC PRIME Realty
 
May-2019 Stats Package for Greater Vancouver
May-2019 Stats Package for Greater VancouverMay-2019 Stats Package for Greater Vancouver
May-2019 Stats Package for Greater VancouverBC PRIME Realty
 

What's hot (17)

December 2020 Victoria Real Estate Board Statistics
December 2020 Victoria Real Estate Board StatisticsDecember 2020 Victoria Real Estate Board Statistics
December 2020 Victoria Real Estate Board Statistics
 
Rebgv stats-pkg-april-2018
Rebgv stats-pkg-april-2018Rebgv stats-pkg-april-2018
Rebgv stats-pkg-april-2018
 
2021 June - REBGV Statistics Package
2021 June - REBGV Statistics Package2021 June - REBGV Statistics Package
2021 June - REBGV Statistics Package
 
Real Estate Board of Greater Vancouver Statistics Package March 2021
Real Estate Board of Greater Vancouver Statistics Package March 2021Real Estate Board of Greater Vancouver Statistics Package March 2021
Real Estate Board of Greater Vancouver Statistics Package March 2021
 
Real Estate Board of Greater Vancouver Statistics Package July 2021
Real Estate Board of Greater Vancouver Statistics Package July 2021Real Estate Board of Greater Vancouver Statistics Package July 2021
Real Estate Board of Greater Vancouver Statistics Package July 2021
 
Rebgv stats-pkg-december-2019
Rebgv stats-pkg-december-2019Rebgv stats-pkg-december-2019
Rebgv stats-pkg-december-2019
 
Real Estate Board of Greater Vancouver Statistics Package - November 2021
Real Estate Board of Greater Vancouver Statistics Package - November 2021Real Estate Board of Greater Vancouver Statistics Package - November 2021
Real Estate Board of Greater Vancouver Statistics Package - November 2021
 
REBGV Statistics package July 2020
REBGV Statistics package July 2020REBGV Statistics package July 2020
REBGV Statistics package July 2020
 
Real Estate Board of Greater Vancouver Statistics Package November 2020
Real Estate Board of Greater Vancouver Statistics Package November 2020Real Estate Board of Greater Vancouver Statistics Package November 2020
Real Estate Board of Greater Vancouver Statistics Package November 2020
 
Rebgv stats-pkg-july-2019
Rebgv stats-pkg-july-2019Rebgv stats-pkg-july-2019
Rebgv stats-pkg-july-2019
 
REBGV Statistics Package April 2021
REBGV Statistics Package April 2021REBGV Statistics Package April 2021
REBGV Statistics Package April 2021
 
Rebgv stats-pkg-may-2019
Rebgv stats-pkg-may-2019Rebgv stats-pkg-may-2019
Rebgv stats-pkg-may-2019
 
REBGV January 2020 Statistics Package
REBGV January 2020 Statistics Package REBGV January 2020 Statistics Package
REBGV January 2020 Statistics Package
 
Real Estate Board of Greater Vancouver Statistics Package August 2021
Real Estate Board of Greater Vancouver Statistics Package August 2021Real Estate Board of Greater Vancouver Statistics Package August 2021
Real Estate Board of Greater Vancouver Statistics Package August 2021
 
Rebgv stats-pkg-april-2019
Rebgv stats-pkg-april-2019Rebgv stats-pkg-april-2019
Rebgv stats-pkg-april-2019
 
Rebgv stats-pkg-may-2021
Rebgv stats-pkg-may-2021Rebgv stats-pkg-may-2021
Rebgv stats-pkg-may-2021
 
May-2019 Stats Package for Greater Vancouver
May-2019 Stats Package for Greater VancouverMay-2019 Stats Package for Greater Vancouver
May-2019 Stats Package for Greater Vancouver
 

Similar to Rebgv stats-pkg-february-2018

Rebgv stats-pkg-september-2018
Rebgv stats-pkg-september-2018Rebgv stats-pkg-september-2018
Rebgv stats-pkg-september-2018Kathryn Huang
 
Rebgv stats-pkg-january-2019
Rebgv stats-pkg-january-2019Rebgv stats-pkg-january-2019
Rebgv stats-pkg-january-2019Kathryn Huang
 
Rebgv stats-pkg-november-2018
Rebgv stats-pkg-november-2018Rebgv stats-pkg-november-2018
Rebgv stats-pkg-november-2018Kathryn Huang
 
201807 rebgv-stats-package-for-media
201807 rebgv-stats-package-for-media201807 rebgv-stats-package-for-media
201807 rebgv-stats-package-for-mediaKathryn Huang
 
REBGV Statistics Package June 2020
REBGV Statistics Package June 2020REBGV Statistics Package June 2020
REBGV Statistics Package June 2020Vicky Aulakh
 
Rebgv stats-pkg-march-2019
Rebgv stats-pkg-march-2019Rebgv stats-pkg-march-2019
Rebgv stats-pkg-march-2019Sherryl Jacobs
 
Rebgv stats-pkg-january-2018 2
Rebgv stats-pkg-january-2018 2Rebgv stats-pkg-january-2018 2
Rebgv stats-pkg-january-2018 2Kathryn Huang
 
Rebgv stats-pkg-june-2019
Rebgv stats-pkg-june-2019Rebgv stats-pkg-june-2019
Rebgv stats-pkg-june-2019Vicky Aulakh
 
Rebgv stats-pkg-may-2018
Rebgv stats-pkg-may-2018Rebgv stats-pkg-may-2018
Rebgv stats-pkg-may-2018Kathryn Huang
 
Rebgv stats-pkg-april-2020
Rebgv stats-pkg-april-2020Rebgv stats-pkg-april-2020
Rebgv stats-pkg-april-2020Vicky Aulakh
 
Real Estate Board of Greater Vancouver - Statistics Package for July 2021
Real Estate Board of Greater Vancouver - Statistics Package for July 2021Real Estate Board of Greater Vancouver - Statistics Package for July 2021
Real Estate Board of Greater Vancouver - Statistics Package for July 2021Alexander Mackenzie, PMP
 
REBGV Statistics Package May 2020
REBGV Statistics Package May 2020REBGV Statistics Package May 2020
REBGV Statistics Package May 2020Vicky Aulakh
 
REBGV Statistics Package October 2020
REBGV Statistics Package October 2020REBGV Statistics Package October 2020
REBGV Statistics Package October 2020Vicky Aulakh
 
Real Estate Board of Greater Vancouver Statistics Package January 2021
Real Estate Board of Greater Vancouver Statistics Package January 2021 Real Estate Board of Greater Vancouver Statistics Package January 2021
Real Estate Board of Greater Vancouver Statistics Package January 2021 Vicky Aulakh
 
May 2017 REBGV Stats
May 2017 REBGV Stats May 2017 REBGV Stats
May 2017 REBGV Stats Mike Stewart
 
March 2020 REBGV Statistics Package
March 2020 REBGV Statistics PackageMarch 2020 REBGV Statistics Package
March 2020 REBGV Statistics PackageMike Stewart
 
March 2020-rebgv-stats-pkg
March 2020-rebgv-stats-pkgMarch 2020-rebgv-stats-pkg
March 2020-rebgv-stats-pkgMatt Scalena
 

Similar to Rebgv stats-pkg-february-2018 (20)

Rebgv stats-pkg-september-2018
Rebgv stats-pkg-september-2018Rebgv stats-pkg-september-2018
Rebgv stats-pkg-september-2018
 
Rebgv stats-pkg-january-2019
Rebgv stats-pkg-january-2019Rebgv stats-pkg-january-2019
Rebgv stats-pkg-january-2019
 
Rebgv stats-pkg-november-2018
Rebgv stats-pkg-november-2018Rebgv stats-pkg-november-2018
Rebgv stats-pkg-november-2018
 
Rebgv stats-pkg-november-2020
Rebgv stats-pkg-november-2020Rebgv stats-pkg-november-2020
Rebgv stats-pkg-november-2020
 
201807 rebgv-stats-package-for-media
201807 rebgv-stats-package-for-media201807 rebgv-stats-package-for-media
201807 rebgv-stats-package-for-media
 
REBGV Statistics Package June 2020
REBGV Statistics Package June 2020REBGV Statistics Package June 2020
REBGV Statistics Package June 2020
 
Rebgv stats-pkg-march-2019
Rebgv stats-pkg-march-2019Rebgv stats-pkg-march-2019
Rebgv stats-pkg-march-2019
 
Rebgv stats-pkg-january-2018 2
Rebgv stats-pkg-january-2018 2Rebgv stats-pkg-january-2018 2
Rebgv stats-pkg-january-2018 2
 
Rebgv stats-pkg-june-2019
Rebgv stats-pkg-june-2019Rebgv stats-pkg-june-2019
Rebgv stats-pkg-june-2019
 
Rebgv stats-pkg-may-2018
Rebgv stats-pkg-may-2018Rebgv stats-pkg-may-2018
Rebgv stats-pkg-may-2018
 
Rebgv stats-pkg-april-2020
Rebgv stats-pkg-april-2020Rebgv stats-pkg-april-2020
Rebgv stats-pkg-april-2020
 
Real Estate Board of Greater Vancouver - Statistics Package for July 2021
Real Estate Board of Greater Vancouver - Statistics Package for July 2021Real Estate Board of Greater Vancouver - Statistics Package for July 2021
Real Estate Board of Greater Vancouver - Statistics Package for July 2021
 
Rebgv stats-pkg-august-2021
Rebgv stats-pkg-august-2021Rebgv stats-pkg-august-2021
Rebgv stats-pkg-august-2021
 
REBGV Statistics Package May 2020
REBGV Statistics Package May 2020REBGV Statistics Package May 2020
REBGV Statistics Package May 2020
 
REBGV Statistics Package October 2020
REBGV Statistics Package October 2020REBGV Statistics Package October 2020
REBGV Statistics Package October 2020
 
Rebgv stats-pkg-october-2020
Rebgv stats-pkg-october-2020Rebgv stats-pkg-october-2020
Rebgv stats-pkg-october-2020
 
Real Estate Board of Greater Vancouver Statistics Package January 2021
Real Estate Board of Greater Vancouver Statistics Package January 2021 Real Estate Board of Greater Vancouver Statistics Package January 2021
Real Estate Board of Greater Vancouver Statistics Package January 2021
 
May 2017 REBGV Stats
May 2017 REBGV Stats May 2017 REBGV Stats
May 2017 REBGV Stats
 
March 2020 REBGV Statistics Package
March 2020 REBGV Statistics PackageMarch 2020 REBGV Statistics Package
March 2020 REBGV Statistics Package
 
March 2020-rebgv-stats-pkg
March 2020-rebgv-stats-pkgMarch 2020-rebgv-stats-pkg
March 2020-rebgv-stats-pkg
 

More from Kathryn Huang

Disclosureof representationintradingservices english-recbc (4)
Disclosureof representationintradingservices english-recbc (4)Disclosureof representationintradingservices english-recbc (4)
Disclosureof representationintradingservices english-recbc (4)Kathryn Huang
 
Property disclosure statement strata title properties mike stewart prec
Property disclosure statement strata title properties mike stewart precProperty disclosure statement strata title properties mike stewart prec
Property disclosure statement strata title properties mike stewart precKathryn Huang
 
Privacy noticeandconsent (3)
Privacy noticeandconsent (3)Privacy noticeandconsent (3)
Privacy noticeandconsent (3)Kathryn Huang
 
Rebgv stats-pkg-december-2018
Rebgv stats-pkg-december-2018Rebgv stats-pkg-december-2018
Rebgv stats-pkg-december-2018Kathryn Huang
 
Rebgv stats-pkg-october-2018 .pdf
Rebgv stats-pkg-october-2018 .pdf Rebgv stats-pkg-october-2018 .pdf
Rebgv stats-pkg-october-2018 .pdf Kathryn Huang
 
Rebgv stats-pkg-august-2018
Rebgv stats-pkg-august-2018Rebgv stats-pkg-august-2018
Rebgv stats-pkg-august-2018Kathryn Huang
 
Rebgv stats-pkg-june-2018
Rebgv stats-pkg-june-2018Rebgv stats-pkg-june-2018
Rebgv stats-pkg-june-2018Kathryn Huang
 
Broadway corridor-planning-program-presentation-may-2018
Broadway corridor-planning-program-presentation-may-2018Broadway corridor-planning-program-presentation-may-2018
Broadway corridor-planning-program-presentation-may-2018Kathryn Huang
 
2018 03-metro-vancouver
2018 03-metro-vancouver 2018 03-metro-vancouver
2018 03-metro-vancouver Kathryn Huang
 
2017 Real Estate Board of Greater Vancouver Statistics Package with Charts & ...
2017 Real Estate Board of Greater Vancouver Statistics Package with Charts & ...2017 Real Estate Board of Greater Vancouver Statistics Package with Charts & ...
2017 Real Estate Board of Greater Vancouver Statistics Package with Charts & ...Kathryn Huang
 

More from Kathryn Huang (12)

Disclosureof representationintradingservices english-recbc (4)
Disclosureof representationintradingservices english-recbc (4)Disclosureof representationintradingservices english-recbc (4)
Disclosureof representationintradingservices english-recbc (4)
 
Property disclosure statement strata title properties mike stewart prec
Property disclosure statement strata title properties mike stewart precProperty disclosure statement strata title properties mike stewart prec
Property disclosure statement strata title properties mike stewart prec
 
2516 bc
2516 bc2516 bc
2516 bc
 
Privacy noticeandconsent (3)
Privacy noticeandconsent (3)Privacy noticeandconsent (3)
Privacy noticeandconsent (3)
 
Rebgv stats-pkg-december-2018
Rebgv stats-pkg-december-2018Rebgv stats-pkg-december-2018
Rebgv stats-pkg-december-2018
 
Rebgv stats-pkg-october-2018 .pdf
Rebgv stats-pkg-october-2018 .pdf Rebgv stats-pkg-october-2018 .pdf
Rebgv stats-pkg-october-2018 .pdf
 
2440 bc
2440 bc2440 bc
2440 bc
 
Rebgv stats-pkg-august-2018
Rebgv stats-pkg-august-2018Rebgv stats-pkg-august-2018
Rebgv stats-pkg-august-2018
 
Rebgv stats-pkg-june-2018
Rebgv stats-pkg-june-2018Rebgv stats-pkg-june-2018
Rebgv stats-pkg-june-2018
 
Broadway corridor-planning-program-presentation-may-2018
Broadway corridor-planning-program-presentation-may-2018Broadway corridor-planning-program-presentation-may-2018
Broadway corridor-planning-program-presentation-may-2018
 
2018 03-metro-vancouver
2018 03-metro-vancouver 2018 03-metro-vancouver
2018 03-metro-vancouver
 
2017 Real Estate Board of Greater Vancouver Statistics Package with Charts & ...
2017 Real Estate Board of Greater Vancouver Statistics Package with Charts & ...2017 Real Estate Board of Greater Vancouver Statistics Package with Charts & ...
2017 Real Estate Board of Greater Vancouver Statistics Package with Charts & ...
 

Recently uploaded

Low Rate Call Girls in Akshardham Delhi Call 9990771857
Low Rate Call Girls in Akshardham   Delhi Call 9990771857Low Rate Call Girls in Akshardham   Delhi Call 9990771857
Low Rate Call Girls in Akshardham Delhi Call 9990771857delhimodel235
 
Call Girls in Nehru Place Delhi 💯Call Us 🔝8264348440🔝
Call Girls in Nehru Place Delhi 💯Call Us 🔝8264348440🔝Call Girls in Nehru Place Delhi 💯Call Us 🔝8264348440🔝
Call Girls in Nehru Place Delhi 💯Call Us 🔝8264348440🔝soniya singh
 
Call Girls In Mundka Industrial Metro@꧂8447779280 ↬Enjoy ꧂Escort Service in ...
Call Girls In Mundka Industrial Metro@꧂8447779280 ↬Enjoy ꧂Escort Service in  ...Call Girls In Mundka Industrial Metro@꧂8447779280 ↬Enjoy ꧂Escort Service in  ...
Call Girls In Mundka Industrial Metro@꧂8447779280 ↬Enjoy ꧂Escort Service in ...asmaqueen5
 
Call Girls in shastri nagar Delhi 8264348440 ✅ call girls ❤️
Call Girls in shastri nagar Delhi 8264348440 ✅ call girls ❤️Call Girls in shastri nagar Delhi 8264348440 ✅ call girls ❤️
Call Girls in shastri nagar Delhi 8264348440 ✅ call girls ❤️soniya singh
 
Call Girls In Mayur Vihar-1 Delhi ❤️8860477959 Good Looking Escorts In 24/7 D...
Call Girls In Mayur Vihar-1 Delhi ❤️8860477959 Good Looking Escorts In 24/7 D...Call Girls In Mayur Vihar-1 Delhi ❤️8860477959 Good Looking Escorts In 24/7 D...
Call Girls In Mayur Vihar-1 Delhi ❤️8860477959 Good Looking Escorts In 24/7 D...lizamodels9
 
83770-87607 ŰžCall Girls In Near The Park Hotel (Cp) Delhi
83770-87607 ŰžCall Girls In Near The Park Hotel (Cp) Delhi83770-87607 ŰžCall Girls In Near The Park Hotel (Cp) Delhi
83770-87607 ŰžCall Girls In Near The Park Hotel (Cp) Delhidollysharma2066
 
Call girls in Jeewan Park .Delhi↫8447779280↬ ꧂Escorts Service In Delhi Ncr
Call girls in Jeewan Park .Delhi↫8447779280↬ ꧂Escorts Service In Delhi NcrCall girls in Jeewan Park .Delhi↫8447779280↬ ꧂Escorts Service In Delhi Ncr
Call girls in Jeewan Park .Delhi↫8447779280↬ ꧂Escorts Service In Delhi Ncrasmaqueen5
 
Model Call Girl in Shastri Nagar Delhi reach out to us at 🔝8264348440🔝
Model Call Girl in Shastri Nagar Delhi reach out to us at 🔝8264348440🔝Model Call Girl in Shastri Nagar Delhi reach out to us at 🔝8264348440🔝
Model Call Girl in Shastri Nagar Delhi reach out to us at 🔝8264348440🔝soniya singh
 
SVN Live 4.22.24 Weekly Property Broadcast
SVN Live 4.22.24 Weekly Property BroadcastSVN Live 4.22.24 Weekly Property Broadcast
SVN Live 4.22.24 Weekly Property BroadcastSVN International Corp.
 
9990771857 Call Girls in Noida Sector 10 Noida (Call Girls) Delhi
9990771857 Call Girls in Noida Sector 10 Noida (Call Girls) Delhi9990771857 Call Girls in Noida Sector 10 Noida (Call Girls) Delhi
9990771857 Call Girls in Noida Sector 10 Noida (Call Girls) Delhidelhimodel235
 
Call Girls in Janakpuri ↫8447779280↫Short 1500 Night 6000-Escorts Service In ...
Call Girls in Janakpuri ↫8447779280↫Short 1500 Night 6000-Escorts Service In ...Call Girls in Janakpuri ↫8447779280↫Short 1500 Night 6000-Escorts Service In ...
Call Girls in Janakpuri ↫8447779280↫Short 1500 Night 6000-Escorts Service In ...asmaqueen5
 
Building Dreams: Newman Leech's Visionary Approach to Real Estate Investment
Building Dreams: Newman Leech's Visionary Approach to Real Estate InvestmentBuilding Dreams: Newman Leech's Visionary Approach to Real Estate Investment
Building Dreams: Newman Leech's Visionary Approach to Real Estate InvestmentNewman George Leech
 
9990771857 Call Girls in Noida Sector 34 Noida (Call Girls) Delhi
9990771857 Call Girls in Noida Sector 34 Noida (Call Girls) Delhi9990771857 Call Girls in Noida Sector 34 Noida (Call Girls) Delhi
9990771857 Call Girls in Noida Sector 34 Noida (Call Girls) Delhidelhimodel235
 
9711199012 Call {Girls Delhi} Very Low rate Vaishali DownLoad PDF
9711199012 Call {Girls Delhi} Very Low rate Vaishali DownLoad PDF9711199012 Call {Girls Delhi} Very Low rate Vaishali DownLoad PDF
9711199012 Call {Girls Delhi} Very Low rate Vaishali DownLoad PDFMs Riya
 
Call Girls in laxmi Nagar Delhi 💯Call Us 🔝 9582086666🔝 South Delhi Escorts Se...
Call Girls in laxmi Nagar Delhi 💯Call Us 🔝 9582086666🔝 South Delhi Escorts Se...Call Girls in laxmi Nagar Delhi 💯Call Us 🔝 9582086666🔝 South Delhi Escorts Se...
Call Girls in laxmi Nagar Delhi 💯Call Us 🔝 9582086666🔝 South Delhi Escorts Se...delhimodel235
 
8 Key Elements for Comfortable Farmland Living
8 Key Elements for Comfortable Farmland Living 8 Key Elements for Comfortable Farmland Living
8 Key Elements for Comfortable Farmland Living Farmland Bazaar
 
Listing Turkey Sylvana Istanbul - Bahcesehir
Listing Turkey Sylvana Istanbul - BahcesehirListing Turkey Sylvana Istanbul - Bahcesehir
Listing Turkey Sylvana Istanbul - BahcesehirListing Turkey
 
Call Girls in Inderpuri Delhi 💯Call Us 🔝8264348440🔝
Call Girls in Inderpuri Delhi 💯Call Us 🔝8264348440🔝Call Girls in Inderpuri Delhi 💯Call Us 🔝8264348440🔝
Call Girls in Inderpuri Delhi 💯Call Us 🔝8264348440🔝soniya singh
 
Call Girls in Khan Market 9654467111 ESCORTS SERVICE
Call Girls in Khan Market 9654467111 ESCORTS SERVICECall Girls in Khan Market 9654467111 ESCORTS SERVICE
Call Girls in Khan Market 9654467111 ESCORTS SERVICESapana Sha
 

Recently uploaded (20)

Low Rate Call Girls in Akshardham Delhi Call 9990771857
Low Rate Call Girls in Akshardham   Delhi Call 9990771857Low Rate Call Girls in Akshardham   Delhi Call 9990771857
Low Rate Call Girls in Akshardham Delhi Call 9990771857
 
Call Girls in Nehru Place Delhi 💯Call Us 🔝8264348440🔝
Call Girls in Nehru Place Delhi 💯Call Us 🔝8264348440🔝Call Girls in Nehru Place Delhi 💯Call Us 🔝8264348440🔝
Call Girls in Nehru Place Delhi 💯Call Us 🔝8264348440🔝
 
Call Girls In Mundka Industrial Metro@꧂8447779280 ↬Enjoy ꧂Escort Service in ...
Call Girls In Mundka Industrial Metro@꧂8447779280 ↬Enjoy ꧂Escort Service in  ...Call Girls In Mundka Industrial Metro@꧂8447779280 ↬Enjoy ꧂Escort Service in  ...
Call Girls In Mundka Industrial Metro@꧂8447779280 ↬Enjoy ꧂Escort Service in ...
 
Call Girls in shastri nagar Delhi 8264348440 ✅ call girls ❤️
Call Girls in shastri nagar Delhi 8264348440 ✅ call girls ❤️Call Girls in shastri nagar Delhi 8264348440 ✅ call girls ❤️
Call Girls in shastri nagar Delhi 8264348440 ✅ call girls ❤️
 
Call Girls In Mayur Vihar-1 Delhi ❤️8860477959 Good Looking Escorts In 24/7 D...
Call Girls In Mayur Vihar-1 Delhi ❤️8860477959 Good Looking Escorts In 24/7 D...Call Girls In Mayur Vihar-1 Delhi ❤️8860477959 Good Looking Escorts In 24/7 D...
Call Girls In Mayur Vihar-1 Delhi ❤️8860477959 Good Looking Escorts In 24/7 D...
 
83770-87607 ŰžCall Girls In Near The Park Hotel (Cp) Delhi
83770-87607 ŰžCall Girls In Near The Park Hotel (Cp) Delhi83770-87607 ŰžCall Girls In Near The Park Hotel (Cp) Delhi
83770-87607 ŰžCall Girls In Near The Park Hotel (Cp) Delhi
 
Call girls in Jeewan Park .Delhi↫8447779280↬ ꧂Escorts Service In Delhi Ncr
Call girls in Jeewan Park .Delhi↫8447779280↬ ꧂Escorts Service In Delhi NcrCall girls in Jeewan Park .Delhi↫8447779280↬ ꧂Escorts Service In Delhi Ncr
Call girls in Jeewan Park .Delhi↫8447779280↬ ꧂Escorts Service In Delhi Ncr
 
Hot call girls in Moti Bagh🔝 9953056974 🔝 escort Service
Hot call girls in Moti Bagh🔝 9953056974 🔝 escort ServiceHot call girls in Moti Bagh🔝 9953056974 🔝 escort Service
Hot call girls in Moti Bagh🔝 9953056974 🔝 escort Service
 
Model Call Girl in Shastri Nagar Delhi reach out to us at 🔝8264348440🔝
Model Call Girl in Shastri Nagar Delhi reach out to us at 🔝8264348440🔝Model Call Girl in Shastri Nagar Delhi reach out to us at 🔝8264348440🔝
Model Call Girl in Shastri Nagar Delhi reach out to us at 🔝8264348440🔝
 
SVN Live 4.22.24 Weekly Property Broadcast
SVN Live 4.22.24 Weekly Property BroadcastSVN Live 4.22.24 Weekly Property Broadcast
SVN Live 4.22.24 Weekly Property Broadcast
 
9990771857 Call Girls in Noida Sector 10 Noida (Call Girls) Delhi
9990771857 Call Girls in Noida Sector 10 Noida (Call Girls) Delhi9990771857 Call Girls in Noida Sector 10 Noida (Call Girls) Delhi
9990771857 Call Girls in Noida Sector 10 Noida (Call Girls) Delhi
 
Call Girls in Janakpuri ↫8447779280↫Short 1500 Night 6000-Escorts Service In ...
Call Girls in Janakpuri ↫8447779280↫Short 1500 Night 6000-Escorts Service In ...Call Girls in Janakpuri ↫8447779280↫Short 1500 Night 6000-Escorts Service In ...
Call Girls in Janakpuri ↫8447779280↫Short 1500 Night 6000-Escorts Service In ...
 
Building Dreams: Newman Leech's Visionary Approach to Real Estate Investment
Building Dreams: Newman Leech's Visionary Approach to Real Estate InvestmentBuilding Dreams: Newman Leech's Visionary Approach to Real Estate Investment
Building Dreams: Newman Leech's Visionary Approach to Real Estate Investment
 
9990771857 Call Girls in Noida Sector 34 Noida (Call Girls) Delhi
9990771857 Call Girls in Noida Sector 34 Noida (Call Girls) Delhi9990771857 Call Girls in Noida Sector 34 Noida (Call Girls) Delhi
9990771857 Call Girls in Noida Sector 34 Noida (Call Girls) Delhi
 
9711199012 Call {Girls Delhi} Very Low rate Vaishali DownLoad PDF
9711199012 Call {Girls Delhi} Very Low rate Vaishali DownLoad PDF9711199012 Call {Girls Delhi} Very Low rate Vaishali DownLoad PDF
9711199012 Call {Girls Delhi} Very Low rate Vaishali DownLoad PDF
 
Call Girls in laxmi Nagar Delhi 💯Call Us 🔝 9582086666🔝 South Delhi Escorts Se...
Call Girls in laxmi Nagar Delhi 💯Call Us 🔝 9582086666🔝 South Delhi Escorts Se...Call Girls in laxmi Nagar Delhi 💯Call Us 🔝 9582086666🔝 South Delhi Escorts Se...
Call Girls in laxmi Nagar Delhi 💯Call Us 🔝 9582086666🔝 South Delhi Escorts Se...
 
8 Key Elements for Comfortable Farmland Living
8 Key Elements for Comfortable Farmland Living 8 Key Elements for Comfortable Farmland Living
8 Key Elements for Comfortable Farmland Living
 
Listing Turkey Sylvana Istanbul - Bahcesehir
Listing Turkey Sylvana Istanbul - BahcesehirListing Turkey Sylvana Istanbul - Bahcesehir
Listing Turkey Sylvana Istanbul - Bahcesehir
 
Call Girls in Inderpuri Delhi 💯Call Us 🔝8264348440🔝
Call Girls in Inderpuri Delhi 💯Call Us 🔝8264348440🔝Call Girls in Inderpuri Delhi 💯Call Us 🔝8264348440🔝
Call Girls in Inderpuri Delhi 💯Call Us 🔝8264348440🔝
 
Call Girls in Khan Market 9654467111 ESCORTS SERVICE
Call Girls in Khan Market 9654467111 ESCORTS SERVICECall Girls in Khan Market 9654467111 ESCORTS SERVICE
Call Girls in Khan Market 9654467111 ESCORTS SERVICE
 

Rebgv stats-pkg-february-2018