SlideShare a Scribd company logo
1 of 10
Download to read offline
News Release
FOR IMMEDIATE RELEASE:
Steady sales and diminished listings characterize 2017 for the Metro
Vancouver housing market
VANCOUVER, BC ā€“ January 3, 2018 ā€“ After reaching record levels in 2015 and 2016, Metro
Vancouver* home sales returned to more historically normal levels in 2017. Home listings, on
the other hand, came in several thousand units below typical activity.
The Real Estate Board of Greater Vancouver (REBGV) reports that sales of detached, attached
and apartment properties reached 35,993 on the Multiple Listing ServiceĀ® (MLSĀ®) in 2017, a
9.9 per cent decrease from the 39,943 sales recorded in 2016, and a 15 per cent decrease over the
42,326 residential sales in 2015.
Last yearā€™s sales total was, however, 9.7 per cent above the 10-year sales average.
ā€œIt was a steady year for home sales across the region, led by condominium and townhome
activity, and a quieter year for home listings,ā€ Jill Oudil, REBGV president said. ā€œMetro
Vancouver home sales were the third highest weā€™ve seen in the past ten years while the home
listings total was the second lowest on record for the same period.ā€
Home listings in Metro Vancouver reached 54,655 in 2017. This is a 5.1 per cent decrease
compared to the 57,596 homes listed in 2016 and a 4.5 per cent decrease compared to the 57,249
homes listed in 2015.
Last yearā€™s listings total was 4.4 per cent below the 10-year listings average.
ā€œMarket activity differed considerably this year based on property type,ā€ Oudil said.
ā€œCompetition was intense in the condominium and townhome markets, with multiple offer
situations becoming commonplace. The detached home market operated in a more balanced
state, giving home buyers more selection to choose from and more time to make decisions.ā€
The MLSĀ® HPI composite benchmark price for all residential properties in Metro Vancouver
ends the year at $1,050,300. This is up 15.9 per cent compared to December 2016.
The benchmark price of condominiums increased 25.9 per cent in the region last year.
Townhomes increased 18.5 per cent and detached homes increased 7.9 per cent.
ā€œStrong economic growth, low interest rates, declining unemployment, increasing wages and a
growing population all helped boost home buyer demand in our region last year,ā€ Oudil said.
December summary
Sales of detached, attached, and apartment properties totalled 2,016 in the region in December
2017, a 17.6 per cent increase from the 1,714 sales recorded in December 2016 and a 27.9 per
cent decrease compared to November 2017 when 2,795 homes sold.
Last monthā€™s sales were 7.5 per cent above the 10-year sales average for the month.
ā€œAs we move into 2018, REALTORSĀ® are working with their clients to help them understand
how changing interest rates and the federal governmentā€™s new mortgage qualifications could
affect their purchasing power,ā€ Oudil said. ā€œOnly time will tell what impact these rules will have
on the market.
ā€œHome buyers today should get pre-approved before making an offer to ensure that your home
buying goals align with your financial situation,ā€ Oudil said.
There were 1,891 residential homes newly listed for sale in December 2017. This represents a
44.1 per cent increase compared to the 1,312 homes listed in December 2016 and a 54 per cent
decrease compared to November 2017 when 4,109 properties were listed.
The total number of homes currently listed for sale on the MLSĀ® in Metro Vancouver is 6,958, a
9.7 per cent increase compared to December 2016 (6,345) and a 20.5 per cent decrease compared
to November 2017 (8,747).
The sales-to-active listings ratio for December 2017 is 29 per cent. By property type, the ratio is
14.4 per cent for detached homes, 38.8 per cent for townhomes, and 59.6 per cent for
condominiums.
Generally, analysts say that downward pressure on home prices occurs when the ratio dips below
the 12 per cent mark for a sustained period, while home prices often experience upward pressure
when it surpasses 20 per cent over several months.
Sales of detached properties in December 2017 reached 617, a 14 per cent increase from the 541
detached sales recorded in December 2016. The benchmark price for a detached home in the
region is $1,605,800. This represents a 7.9 per cent increase compared to December 2016.
Sales of apartment homes reached 1,028 in December 2017, a 12.3 per cent increase compared to
the 915 sales in December 2016.The benchmark price of an apartment in the region is $655,400.
This represents a 25.9 per cent increase compared to December 2016.
Attached (or townhome) property sales in December 2017 totalled 371, a 43.8 per cent increase
compared to the 258 sales in December 2016. The benchmark price of an attached home in the
region is $803,700. This represents an 18.5 per cent increase compared to December 2016.
-30-
*Editorā€™s Note: Areas covered by the Real Estate Board of Greater Vancouver include: Whistler, Sunshine Coast,
Squamish, West Vancouver, North Vancouver, Vancouver, Burnaby, New Westminster, Richmond, Port Moody,
Port Coquitlam, Coquitlam, Pitt Meadows, Maple Ridge, and South Delta.
The Real Estate Board of Greater Vancouver is an association representing more than 14,000 REALTORSĀ® and
their companies. The Board provides a variety of member services, including the Multiple Listing ServiceĀ®. For
more information on real estate, statistics, and buying or selling a home, contact a local REALTORĀ® or visit
www.rebgv.org.
For more information please contact:
Craig Munn
Manager, Communication
Real Estate Board of Greater Vancouver
604.730.3146
cmunn@rebgv.org
Property Type Area
Benchmark
Price
Price
Index
1 Month
Change %
3 Month
Change %
6 Month
Change %
1 Year
Change %
3 Year
Change %
5 Year
Change %
10 Year
Change %
Residential / Composite Lower Mainland $952,400 268.7 0.7% 1.7% 6.3% 17.3% 66.2% 77.2% 87.8%
Greater Vancouver $1,050,300 274.6 0.3% 1.3% 5.2% 15.9% 62.9% 76.1% 90.7%
Bowen Island $953,900 206.8 -1.5% -0.6% 6.9% 15.7% 61.8% 70.3% 52.1%
Burnaby East $962,400 267.7 1.1% 1.1% 4.9% 15.2% 60.9% 74.4% 86.0%
Burnaby North $905,400 273.4 1.3% 2.2% 5.8% 16.8% 63.6% 79.6% 91.1%
Burnaby South $1,009,400 285.1 0.7% 1.2% 5.4% 16.3% 64.5% 79.3% 100.6%
Coquitlam $925,800 274.6 0.8% 2.3% 7.1% 21.6% 71.4% 85.8% 94.6%
Ladner $876,100 245.9 0.4% 2.5% 6.2% 9.9% 55.2% 68.2% 78.8%
Maple Ridge $691,700 232.6 0.8% 2.7% 9.6% 20.8% 72.7% 72.4% 68.8%
New Westminster $667,400 286.1 1.8% 2.8% 10.9% 25.4% 74.5% 85.5% 92.1%
North Vancouver $1,091,200 245.2 -0.9% -0.3% 2.5% 12.1% 56.1% 71.9% 77.2%
Pitt Meadows $688,400 251.8 1.3% 3.2% 11.6% 23.6% 72.2% 79.1% 79.0%
Port Coquitlam $733,700 258.8 0.3% 2.5% 7.1% 23.9% 72.5% 81.4% 80.0%
Port Moody $923,300 255.2 1.0% 3.2% 8.9% 20.7% 69.5% 84.0% 81.6%
Richmond $1,004,100 293.2 2.1% 2.4% 5.9% 15.4% 66.0% 77.1% 105.6%
Squamish $812,800 260.2 -0.7% 2.4% 13.0% 23.2% 94.0% 113.1% 101.2%
Sunshine Coast $583,100 204.3 -1.5% -0.1% 4.7% 17.8% 65.6% 71.2% 49.8%
Tsawwassen $1,010,600 253.8 -0.3% 1.4% 5.4% 9.3% 59.2% 70.9% 83.5%
Vancouver East $1,089,100 318.9 0.0% 0.8% 4.1% 14.5% 64.8% 81.5% 114.5%
Vancouver West $1,351,600 285.0 -0.7% -0.3% 1.7% 12.6% 55.1% 72.9% 89.7%
West Vancouver $2,604,500 280.0 -1.1% -0.8% -0.9% 5.8% 54.0% 71.9% 94.3%
Whistler $956,500 210.3 -1.7% 2.8% 17.4% 23.4% 87.9% 103.4% 63.1%
Single Family Detached Lower Mainland $1,321,700 280.4 0.1% -0.4% 2.3% 10.0% 62.8% 77.8% 100.7%
Greater Vancouver $1,605,800 295.1 -0.1% -0.7% 1.1% 7.9% 59.5% 76.5% 108.4%
Bowen Island $953,900 206.8 -1.5% -0.6% 6.9% 15.7% 61.8% 70.3% 52.1%
Burnaby East $1,293,300 289.2 2.1% 1.4% 2.6% 11.0% 64.1% 81.2% 106.7%
Burnaby North $1,578,700 305.3 0.9% -1.1% 0.3% 6.0% 57.2% 76.5% 115.5%
Burnaby South $1,680,500 321.7 -0.3% -2.8% -2.3% 3.6% 59.7% 76.5% 131.4%
Coquitlam $1,282,800 284.7 -0.1% 0.2% 2.1% 14.0% 66.5% 83.0% 105.4%
Ladner $1,029,200 248.1 -0.6% 1.4% 5.5% 4.9% 55.5% 72.4% 83.6%
Maple Ridge $827,000 235.6 1.5% 1.8% 6.6% 16.8% 73.1% 78.9% 74.5%
New Westminster $1,159,300 289.2 1.7% 1.8% 3.0% 11.9% 65.7% 79.4% 106.1%
North Vancouver $1,679,700 262.7 -1.1% -1.9% -0.6% 5.2% 59.7% 81.7% 92.6%
Pitt Meadows $894,300 252.0 1.0% 0.2% 6.4% 16.2% 71.3% 80.4% 82.9%
Port Coquitlam $995,800 265.5 -0.4% 0.0% 0.5% 17.4% 69.5% 79.4% 92.8%
Port Moody $1,501,600 277.3 0.0% 0.3% 3.9% 11.1% 64.3% 83.4% 97.2%
Richmond $1,692,500 339.9 1.3% -0.1% 2.6% 7.1% 64.8% 78.4% 136.9%
Squamish $1,015,900 259.3 0.3% 2.1% 7.2% 20.2% 85.1% 110.8% 102.7%
Sunshine Coast $580,000 203.2 -1.5% 0.0% 4.8% 17.7% 65.3% 71.0% 49.1%
Tsawwassen $1,281,800 276.0 -0.1% 1.0% 5.1% 8.2% 66.0% 81.5% 99.4%
Vancouver East $1,559,900 344.8 -0.9% -0.3% 1.7% 7.1% 60.9% 88.2% 141.6%
Vancouver West $3,556,100 365.1 -0.5% -2.7% -2.0% 3.3% 52.8% 77.2% 132.0%
West Vancouver $3,093,200 292.0 -1.7% -1.4% -1.1% 4.0% 53.0% 73.6% 102.4%
Whistler $1,655,400 209.9 -2.1% 0.7% 5.6% 17.1% 68.5% 85.3% 63.5%
HOW TO READ THE TABLE:
ā€¢ Benchmark Price: Estimated sale price of a benchmark property. Benchmarks represent a typical property within each market.
ā€¢ Price Index: Index numbers estimate the percentage change in price on typical and constant quality properties over time. All figures are based on past sales.
ā€¢ x Month/Year Change %: Percentage change of index over a period of x month(s)/year(s) *
In January 2005, the indexes are set to 100.
Townhome properties are similar to Attached properties, a category that was used in the previous MLSLink HPI, but do not included duplexes.
The above info is deemed reliable, but is not guaranteed. All dollar amounts in CDN.
December 2017*
* MLSĀ®, Multiple Listing ServiceĀ®, and all related graphics are trademarks of The Canadian Real Estate Association 1 of 15
Property Type Area
Benchmark
Price
Price
Index
1 Month
Change %
3 Month
Change %
6 Month
Change %
1 Year
Change %
3 Year
Change %
5 Year
Change %
10 Year
Change %
December 2017*
Townhouse Lower Mainland $677,300 244.8 0.5% 2.4% 8.5% 20.0% 65.5% 71.1% 75.2%
Greater Vancouver $803,700 259.3 -0.2% 2.2% 7.8% 18.5% 63.7% 73.7% 85.0%
Burnaby East $659,200 243.5 0.5% 3.6% 7.8% 21.1% 53.2% 62.3% 73.6%
Burnaby North $728,200 271.8 2.3% 3.7% 5.8% 22.6% 60.8% 77.3% 87.8%
Burnaby South $765,200 263.6 0.6% 2.3% 2.9% 14.2% 53.4% 69.4% 86.7%
Coquitlam $662,600 243.1 0.7% 3.3% 7.3% 21.1% 62.0% 70.2% 76.8%
Ladner $776,900 270.9 2.7% 4.6% 6.2% 21.3% 65.5% 73.5% 86.6%
Maple Ridge $527,500 244.9 -1.0% 2.5% 11.9% 27.3% 76.1% 73.1% 73.9%
New Westminster $693,700 274.3 1.7% 3.8% 8.3% 22.3% 61.2% 75.2% 92.8%
North Vancouver $982,800 238.8 -0.1% 1.9% 4.7% 16.1% 58.6% 70.8% 78.3%
Pitt Meadows $588,200 254.5 1.1% 2.7% 9.7% 23.1% 77.6% 81.9% 82.6%
Port Coquitlam $632,700 238.7 -0.5% -0.4% 7.0% 17.5% 65.6% 69.8% 68.0%
Port Moody $629,100 212.6 1.4% 3.9% 7.6% 23.2% 46.2% 53.8% 50.7%
Richmond $807,900 265.5 0.3% 0.8% 5.4% 13.4% 57.9% 66.9% 90.3%
Squamish $843,400 306.4 -4.5% 4.8% 23.9% 29.9% 134.3% 150.9% 139.9%
Tsawwassen $754,700 281.1 0.1% 2.3% 3.1% 21.4% 72.7% 74.3% 93.6%
Vancouver East $879,200 288.6 2.0% 3.3% 8.1% 19.8% 65.6% 70.3% 93.3%
Vancouver West $1,242,400 274.4 -2.0% -1.8% 2.5% 12.6% 59.1% 82.9% 94.1%
Whistler $999,100 267.2 -4.3% 9.6% 27.8% 23.8% 103.3% 122.7% 113.1%
Apartment Lower Mainland $610,300 266.8 1.6% 4.3% 11.2% 28.6% 73.2% 81.0% 78.7%
Greater Vancouver $655,400 263.4 1.1% 3.1% 9.1% 25.9% 69.0% 78.7% 78.1%
Burnaby East $681,400 258.7 1.9% -0.2% 12.8% 28.8% 62.4% 80.2% 62.7%
Burnaby North $603,100 257.5 1.5% 4.6% 10.7% 26.7% 72.2% 85.4% 79.2%
Burnaby South $685,200 275.1 1.6% 3.1% 10.9% 26.5% 72.7% 85.6% 90.1%
Coquitlam $502,900 276.0 1.9% 4.3% 13.6% 33.9% 86.2% 98.0% 88.0%
Ladner $436,600 206.9 0.7% 3.2% 9.8% 16.0% 39.1% 44.1% 50.8%
Maple Ridge $282,200 203.8 0.9% 7.5% 21.3% 35.5% 68.7% 46.3% 37.2%
New Westminster $503,300 286.9 1.9% 3.0% 14.2% 31.7% 80.4% 89.7% 88.1%
North Vancouver $560,600 228.2 -1.0% 1.3% 6.1% 22.2% 53.5% 62.4% 60.5%
Pitt Meadows $422,800 249.9 2.1% 7.8% 21.3% 36.1% 69.9% 75.2% 68.3%
Port Coquitlam $441,600 264.1 1.3% 6.6% 14.1% 35.7% 80.4% 92.9% 71.7%
Port Moody $632,800 263.7 1.6% 5.2% 14.1% 29.6% 89.6% 102.8% 88.8%
Richmond $637,200 272.0 4.0% 6.5% 11.3% 31.7% 77.8% 86.3% 88.9%
Squamish $464,900 223.9 3.6% -0.4% 12.5% 25.4% 82.8% 94.2% 67.6%
Tsawwassen $462,400 195.0 -1.1% 2.4% 8.2% 15.4% 42.8% 44.1% 42.1%
Vancouver East $545,600 301.0 1.0% 1.9% 7.5% 25.4% 73.1% 79.9% 90.7%
Vancouver West $807,100 261.9 -0.5% 1.4% 4.4% 20.2% 61.0% 73.4% 75.8%
West Vancouver $1,171,000 237.2 1.4% 1.5% 0.3% 19.5% 63.4% 65.0% 65.6%
Whistler $507,500 166.4 2.0% -3.5% 14.2% 26.5% 102.7% 125.5% 25.8%
HOW TO READ THE TABLE:
ā€¢ Benchmark Price: Estimated sale price of a benchmark property. Benchmarks represent a typical property within each market.
ā€¢ Price Index: Index numbers estimate the percentage change in price on typical and constant quality properties over time. All figures are based on past sales.
ā€¢ x Month/Year Change %: Percentage change of index over a period of x month(s)/year(s)
In January 2005, the indexes are set to 100. *
Townhome properties are similar to attached properties, a category that was used in the previous MLSLink HPI, but do not included duplexes.
Lower Mainland includes areas serviced by both Real Estate Board of Greater Vancouver & Fraser Valley Real Estate Board.
The above info is deemed reliable, but is not guaranteed. All dollar amounts in CDN.
* MLSĀ®, Multiple Listing ServiceĀ®, and all related graphics are trademarks of The Canadian Real Estate Association 2 of 15
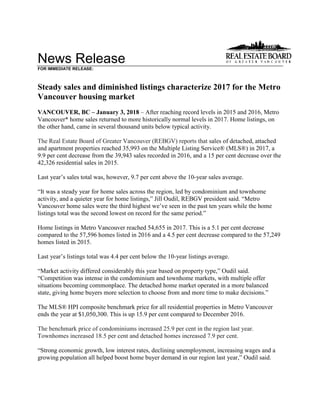
C:DATAMonthEndHpiexporthi_resgv-hpi2.tifGreaterVancouver
5YearTrend
60
110
160
210
260
310
Dec 2012
Feb 2013
Apr 2013
Jun 2013
Aug 2013
Oct 2013
Dec 2013
Feb 2014
Apr 2014
Jun 2014
Aug 2014
Oct 2014
Dec 2014
Feb 2015
Apr 2015
Jun 2015
Aug 2015
Oct 2015
Dec 2015
Feb 2016
Apr 2016
Jun 2016
Aug 2016
Oct 2016
Dec 2016
Feb 2017
Apr 2017
Jun 2017
Aug 2017
Oct 2017
Dec 2017
Price
Index
ResidentialDetachedTownhouseApartment
Jan2005HPI=100
12242017MLSĀ®
SALESFacts
Burnaby
Coquitlam
Delta-South
Islands-Gulf
MapleRidge/PittMeadows
NewWestminster
NorthVancouver
PortCoquitlam
PortMoody/Belcarra
Richmond
Squamish
SunshineCoast
VancouverEast
VancouverWest
WestVancouver/HoweSound
Whistler/Pemberton
Detached4450261821770201067144988363013617
Attached4532804014211715771853326119371
Apartment1457950408578321114111611625110181,028
Detached$1,585,000$1,390,400$1,002,500n/a$865,000n/a$1,707,500$948,700n/a$1,688,800n/a$695,000$1,650,000$3,200,000$3,600,000n/a
Attached$795,000$749,400n/an/a$539,000n/a$965,000n/an/a$825,800n/an/a$1,190,000$1,610,000n/an/an/a
Apartment$539,500$529,950n/an/a$339,000$478,000$622,500$439,000n/a$545,000n/an/a$608,500$788,000n/an/a
Detached76803791132676271874225094833719841
Attached4742704113372416841095142716446
Apartment1971066057128135433919113717038013231,508
Detached$1,610,000$1,298,000$1,196,000n/a$895,000$1,239,286$1,689,000$982,000n/a$1,676,190$859,500$649,900$1,527,500$3,218,333$3,000,000n/a
Attached$745,000$740,000n/an/a$535,050n/a$1,062,500$627,500n/a$860,000n/an/a$1,069,000$1,360,000n/an/an/a
Apartment$535,000$506,000n/an/a$367,500$488,250$645,000$410,000$625,000$509,500n/an/a$585,000$780,000n/a$599,000
Detached4247184669482310597436364317541
Attached27188034616109471232523317258
Apartment109621002868732522129164942371028915
Detached$1,517,500$1,100,000n/an/a$712,750n/a$1,595,000$815,000n/a$1,541,000n/a$509,000$1,367,500$3,472,500$2,960,000n/a
Attached$660,000n/an/an/a$424,500n/an/an/an/a$777,500n/an/a$819,900$1,120,000n/an/an/a
Apartment$500,900$396,500n/an/a$240,950$382,500$559,900$334,000$425,500$465,000n/an/a$492,000$676,000n/a$271,000
Detached9021,051557761,4812681,0484802131,2802837251,3941,05850919311,518
Attached74751714326712084133122081,181267122482631673116,282
Apartment2,3851,39118507031,3711,2835864092,4901911121,8454,68820335118,193
Detached$1,610,000$1,275,000$1,133,000$471,500$805,000$1,150,000$1,723,000$940,000$1,350,000$1,655,000$920,000$607,500$1,572,200$3,420,000$3,110,000$1,749,000
Attached$754,500$738,000$690,000n/a$487,500$690,000$1,020,000$625,000$674,500$830,000$614,500$389,488$1,020,500$1,350,000$1,725,000$780,000n/a
Apartment$535,000$480,000$500,000n/a$326,000$465,000$615,000$378,000$545,000$506,000$410,000$369,450$550,000$758,500$1,054,000$386,000
Detached1,1501,388614731,9153751,2425782971,6602829521,4941,59183421014,655
Attached75954113907671434633302301,043203115441710723736,329
Apartment2,5861,46519906261,1981,3007004152,5601951161,7045,18122349118,959
Detached$1,609,000$1,220,000$1,187,750$450,000$720,000$1,090,000$1,636,500$861,888$1,289,000$1,679,000$837,500$490,000$1,520,000$3,500,000$3,200,000$1,360,750
Attached$675,000$675,000$661,500n/a$405,000$550,000$875,000$547,750$595,000$738,000$542,000$303,000$890,000$1,200,000$1,650,000$721,000n/a
Apartment$439,900$380,000$468,000n/a$239,900$360,000$478,800$289,750$440,000$415,000$339,000$285,000$445,000$646,500$820,000$309,000
Note:MedianSellingPricesarenotreportedforareaswithlessthan20salesorfortheGulfIslands
Median
Selling
Price
Number
of
Sales
Median
Selling
Price
November
2017
December
2016
Jan.-
Dec.2017
Jan.-
Dec.2016
Median
Selling
Price
Number
of
Sales
Median
Selling
Price
Number
of
Sales
December
2017
Number
of
Sales
Median
Selling
Price
Number
of
Sales
December
2017
Year-to-date
Year-to-date
12242017MLSĀ®
LISTINGSFacts
Burnaby
Coquitlam
Delta-South
Islands-Gulf
MapleRidge/PittMeadows
NewWestminster
NorthVancouver
PortCoquitlam
PortMoody/Belcarra
Richmond
Squamish
SunshineCoast
VancouverEast
VancouverWest
WestVancouver/HoweSound
Whistler/Pemberton
Detached7859182532647205100144088723520677
Attached412050311520111666632423311295
Apartment1128260725454311313256932291020919
Detached56%85%144%50%155%65%149%100%200%67%100%123%100%50%86%65%
Attached110%160%160%n/a129%93%105%155%94%117%300%167%138%113%33%173%n/a
Apartment129%96%83%n/a56%157%144%103%85%107%220%100%125%110%100%90%
Detached1581535431473713647232112761230149123191,578
Attached835115045114931181541688585922682
Apartment24311414052132184433625720819449034281,849
Detached48%52%69%300%77%70%56%57%78%35%81%82%41%56%30%100%
Attached57%82%47%n/a91%118%76%77%89%55%63%113%60%49%78%73%n/a
Apartment81%93%43%n/a110%97%73%100%108%74%65%88%88%78%38%82%
Detached483225143102510784122686652515514
Attached211070910910447421918521196
Apartment66408026423521169284511462423602
Detached88%147%72%400%153%90%192%230%143%70%58%165%73%98%124%47%
Attached129%180%114%n/a378%60%178%100%225%100%300%150%132%128%60%81%n/a
Apartment165%155%125%n/a108%162%209%119%138%140%200%100%184%162%42%122%
Detached2,2552,0159961162,1114641,9356963923,0454619972,9272,7341,75427823,176
Attached1,11565516957592625923832541,7213101408161,0491373358,702
Apartment2,8931,67222808091,5911,6446964973,0762081152,2496,37733538722,777
Detached40%52%56%66%70%58%54%69%54%42%61%73%48%39%29%69%
Attached67%79%85%40%88%79%70%81%82%69%86%87%59%60%49%93%n/a
Apartment82%83%81%n/a87%86%78%84%82%81%92%97%82%74%61%91%
Detached2,3452,3031,1361302,5925721,9919064803,4324781,1463,1473,0731,87627125,878
Attached1,09871323458381835804542791,4833011246551,0071043978,455
Apartment3,0101,73426307021,4331,6347795123,0262821152,0976,85032749923,263
Detached49%60%54%56%74%66%62%64%62%48%59%83%47%52%44%77%
Attached69%76%59%0%92%78%80%73%82%70%67%93%67%71%69%94%n/a
Apartment86%84%76%n/a89%84%80%90%81%85%69%101%81%76%68%98%
*Year-to-datelistingsrepresentacumulativetotaloflistingsratherthantotalactivelistings.
Number
of
Listings
December
2017
Number
of
Listings
%Salesto
Listings
Number
of
Listings
%Salesto
Listings
Number
of
Listings
%Salesto
Listings
November
2017
December
2016
Jan.-
Dec.2017
Jan.-
Dec.2016
%Salesto
Listings
Number
of
Listings
%Salesto
Listings
December
2017
Year-to-date*
Year-to-date*
Listing & Sales Activity Summary
Listings Sales
1 2 3 Col. 2 & 3 5 6 7 Col. 6 & 7 9 10 Col. 9 & 10
Dec Nov Dec Percentage Dec Nov Dec Percentage Oct 2016 - Oct 2017 - Percentage
2016 2017 2017 Variance 2016 2017 2017 Variance Dec 2016 Dec 2017 Variance
BURNABY % % %
DETACHED 48 158 78 -50.6 42 76 44 -42.1 134 208 55.2
ATTACHED 21 83 41 -50.6 27 47 45 -4.3 115 162 40.9
APARTMENTS 66 243 112 -53.9 109 197 145 -26.4 423 548 29.6
COQUITLAM
DETACHED 32 153 59 -61.4 47 80 50 -37.5 160 218 36.3
ATTACHED 10 51 20 -60.8 18 42 32 -23.8 78 116 48.7
APARTMENTS 40 114 82 -28.1 62 106 79 -25.5 246 301 22.4
DELTA
DETACHED 25 54 18 -66.7 18 37 26 -29.7 74 109 47.3
ATTACHED 7 15 5 -66.7 8 7 8 14.3 32 26 -18.8
APARTMENTS 8 14 6 -57.1 10 6 5 -16.7 38 24 -36.8
MAPLE RIDGE/PITT MEADOWS
DETACHED 43 147 53 -63.9 66 113 82 -27.4 259 316 22.0
ATTACHED 9 45 31 -31.1 34 41 40 -2.4 126 131 4.0
APARTMENTS 26 52 72 38.5 28 57 40 -29.8 105 143 36.2
NORTH VANCOUVER
DETACHED 25 136 47 -65.4 48 76 70 -7.9 170 227 33.5
ATTACHED 9 49 20 -59.2 16 37 21 -43.2 74 100 35.1
APARTMENTS 35 184 54 -70.7 73 135 78 -42.2 233 338 45.1
NEW WESTMINSTER
DETACHED 10 37 26 -29.7 9 26 17 -34.6 36 66 83.3
ATTACHED 10 11 15 36.4 6 13 14 7.7 23 40 73.9
APARTMENTS 42 132 54 -59.1 68 128 85 -33.6 227 329 44.9
PORT MOODY/BELCARRA
DETACHED 7 23 5 -78.3 10 18 10 -44.4 35 50 42.9
ATTACHED 4 18 16 -11.1 9 16 15 -6.3 32 48 50.0
APARTMENTS 16 36 13 -63.9 22 39 11 -71.8 75 86 14.7
PORT COQUITLAM
DETACHED 10 47 20 -57.4 23 27 20 -25.9 75 78 4.0
ATTACHED 10 31 11 -64.5 10 24 17 -29.2 49 62 26.5
APARTMENTS 21 43 31 -27.9 25 43 32 -25.6 122 141 15.6
RICHMOND
DETACHED 84 211 100 -52.6 59 74 67 -9.5 185 232 25.4
ATTACHED 47 154 66 -57.1 47 84 77 -8.3 170 278 63.5
APARTMENTS 92 257 132 -48.6 129 191 141 -26.2 431 534 23.9
SUNSHINE COAST
DETACHED 26 61 40 -34.4 43 50 49 -2.0 127 164 29.1
ATTACHED 2 8 3 -62.5 3 9 5 -44.4 19 24 26.3
APARTMENTS 4 8 6 -25.0 4 7 6 -14.3 23 24 4.3
SQUAMISH
DETACHED 12 27 14 -48.1 7 22 14 -36.4 32 57 78.1
ATTACHED 4 16 6 -62.5 12 10 18 80.0 41 58 41.5
APARTMENTS 8 20 5 -75.0 16 13 11 -15.4 38 41 7.9
VANCOUVER EAST
DETACHED 86 230 88 -61.7 63 94 88 -6.4 205 288 40.5
ATTACHED 19 85 24 -71.8 25 51 33 -35.3 80 124 55.0
APARTMENTS 51 194 93 -52.1 94 170 116 -31.8 350 436 24.6
VANCOUVER WEST
DETACHED 65 149 72 -51.7 64 83 36 -56.6 210 227 8.1
ATTACHED 18 85 23 -72.9 23 42 26 -38.1 97 122 25.8
APARTMENTS 146 490 229 -53.3 237 380 251 -33.9 832 1023 23.0
WHISTLER/PEMBERTON
DETACHED 15 19 20 5.3 7 19 13 -31.6 37 46 24.3
ATTACHED 21 22 11 -50.0 17 16 19 18.8 92 61 -33.7
APARTMENTS 23 28 20 -28.6 28 23 18 -21.7 116 69 -40.5
WEST VANCOUVER/HOWE SOUND
DETACHED 25 123 35 -71.5 31 37 30 -18.9 79 96 21.5
ATTACHED 5 9 3 -66.7 3 7 1 -85.7 9 15 66.7
APARTMENTS 24 34 10 -70.6 10 13 10 -23.1 34 31 -8.8
GRAND TOTALS
DETACHED 513 1575 675 -57.1 537 832 616 -26.0 1818 2382 31.0
ATTACHED 196 682 295 -56.7 258 446 371 -16.8 1037 1367 31.8
APARTMENTS 602 1849 919 -50.3 915 1508 1028 -31.8 3293 4068 23.5
ResidentialAverageSalePrices-January1977toDecember2017
0
200
400
600
800
1000
1200
1400
1600
1800
2000
1977
1978
1979
1980
1981
1982
1983
1984
1985
1986
1987
1988
1989
1990
1991
1992
1993
1994
1995
1996
1997
1998
1999
2000
2001
2002
2003
2004
2005
2006
2007
2008
2009
2010
2011
2012
2013
2014
2015
2016
2017
DETACHEDCONDOMINIUMATTACHEDAPARTMENTS
INTHOUSANDS($)
NOTE:From1977-1984condominiumaverageswerenotseparatedintoattached&apartment.
$885,587
$676,502
$1,749,766

More Related Content

What's hot

September 2015 rebgv statistics package mike stewart
September 2015 rebgv statistics package mike stewartSeptember 2015 rebgv statistics package mike stewart
September 2015 rebgv statistics package mike stewartMike Stewart
Ā 
REBGV Stats Package June 2016 Mike Stewart Vancouver Realtor
REBGV Stats Package June 2016 Mike Stewart Vancouver RealtorREBGV Stats Package June 2016 Mike Stewart Vancouver Realtor
REBGV Stats Package June 2016 Mike Stewart Vancouver RealtorMike Stewart
Ā 
February 2017 REBGV Statistics Package Mike Stewart Realtor
February 2017 REBGV Statistics Package Mike Stewart RealtorFebruary 2017 REBGV Statistics Package Mike Stewart Realtor
February 2017 REBGV Statistics Package Mike Stewart RealtorMike Stewart
Ā 
January 2016 rebgv stats mike stewart realtor Corrected Feb 5 2016
January 2016 rebgv stats mike stewart realtor Corrected Feb 5 2016January 2016 rebgv stats mike stewart realtor Corrected Feb 5 2016
January 2016 rebgv stats mike stewart realtor Corrected Feb 5 2016Mike Stewart
Ā 
August 2017 REBGV Stats Mike Stewart Realtor
August 2017 REBGV Stats Mike Stewart RealtorAugust 2017 REBGV Stats Mike Stewart Realtor
August 2017 REBGV Stats Mike Stewart RealtorMike Stewart
Ā 
April 2017 Real Estate Board of Greater Vancouver Statistics Package with Charts
April 2017 Real Estate Board of Greater Vancouver Statistics Package with ChartsApril 2017 Real Estate Board of Greater Vancouver Statistics Package with Charts
April 2017 Real Estate Board of Greater Vancouver Statistics Package with ChartsMike Stewart
Ā 
October 2015 Vancouver Real Estate Board Statistics Package Mike Stewart Realtor
October 2015 Vancouver Real Estate Board Statistics Package Mike Stewart RealtorOctober 2015 Vancouver Real Estate Board Statistics Package Mike Stewart Realtor
October 2015 Vancouver Real Estate Board Statistics Package Mike Stewart RealtorMike Stewart
Ā 
June 2015 rebgv stats package mike stewart
June 2015 rebgv stats package mike stewartJune 2015 rebgv stats package mike stewart
June 2015 rebgv stats package mike stewartMike Stewart
Ā 
REBGV November 2015 Statistics Package Mike Stewart Realtor
REBGV November 2015 Statistics Package Mike Stewart RealtorREBGV November 2015 Statistics Package Mike Stewart Realtor
REBGV November 2015 Statistics Package Mike Stewart RealtorMike Stewart
Ā 
May 2016 Real Estate Board of Greater Vancouver Statistics Package
May 2016 Real Estate Board of Greater Vancouver Statistics PackageMay 2016 Real Estate Board of Greater Vancouver Statistics Package
May 2016 Real Estate Board of Greater Vancouver Statistics PackageMike Stewart
Ā 
REBGV STATS PACKAGE JULY 2017
REBGV STATS PACKAGE JULY 2017REBGV STATS PACKAGE JULY 2017
REBGV STATS PACKAGE JULY 2017Marcella Riccardi
Ā 
June 2017 REBGV Statistics Package
June 2017 REBGV Statistics PackageJune 2017 REBGV Statistics Package
June 2017 REBGV Statistics PackageMike Stewart
Ā 
February 2016 REBGV Stats Mike Stewart Realtor
February 2016 REBGV Stats Mike Stewart RealtorFebruary 2016 REBGV Stats Mike Stewart Realtor
February 2016 REBGV Stats Mike Stewart RealtorMike Stewart
Ā 
Real Estate Board of Greater Vancouver Statistics Package October 2021
Real Estate Board of Greater Vancouver Statistics Package October 2021Real Estate Board of Greater Vancouver Statistics Package October 2021
Real Estate Board of Greater Vancouver Statistics Package October 2021VickyAulakh1
Ā 
December 2021 Victoria Real Estate Board Statistics Package
December 2021 Victoria Real Estate Board Statistics Package December 2021 Victoria Real Estate Board Statistics Package
December 2021 Victoria Real Estate Board Statistics Package VickyAulakh1
Ā 
Rebgv stats-pkg-september-2019
Rebgv stats-pkg-september-2019Rebgv stats-pkg-september-2019
Rebgv stats-pkg-september-2019Vicky Aulakh
Ā 
Metro Vancouver Statistics Report October 2021
Metro Vancouver Statistics Report October 2021Metro Vancouver Statistics Report October 2021
Metro Vancouver Statistics Report October 2021VickyAulakh1
Ā 
Rebgv stats-pkg-november-2019-f
Rebgv stats-pkg-november-2019-fRebgv stats-pkg-november-2019-f
Rebgv stats-pkg-november-2019-fVicky Aulakh
Ā 

What's hot (18)

September 2015 rebgv statistics package mike stewart
September 2015 rebgv statistics package mike stewartSeptember 2015 rebgv statistics package mike stewart
September 2015 rebgv statistics package mike stewart
Ā 
REBGV Stats Package June 2016 Mike Stewart Vancouver Realtor
REBGV Stats Package June 2016 Mike Stewart Vancouver RealtorREBGV Stats Package June 2016 Mike Stewart Vancouver Realtor
REBGV Stats Package June 2016 Mike Stewart Vancouver Realtor
Ā 
February 2017 REBGV Statistics Package Mike Stewart Realtor
February 2017 REBGV Statistics Package Mike Stewart RealtorFebruary 2017 REBGV Statistics Package Mike Stewart Realtor
February 2017 REBGV Statistics Package Mike Stewart Realtor
Ā 
January 2016 rebgv stats mike stewart realtor Corrected Feb 5 2016
January 2016 rebgv stats mike stewart realtor Corrected Feb 5 2016January 2016 rebgv stats mike stewart realtor Corrected Feb 5 2016
January 2016 rebgv stats mike stewart realtor Corrected Feb 5 2016
Ā 
August 2017 REBGV Stats Mike Stewart Realtor
August 2017 REBGV Stats Mike Stewart RealtorAugust 2017 REBGV Stats Mike Stewart Realtor
August 2017 REBGV Stats Mike Stewart Realtor
Ā 
April 2017 Real Estate Board of Greater Vancouver Statistics Package with Charts
April 2017 Real Estate Board of Greater Vancouver Statistics Package with ChartsApril 2017 Real Estate Board of Greater Vancouver Statistics Package with Charts
April 2017 Real Estate Board of Greater Vancouver Statistics Package with Charts
Ā 
October 2015 Vancouver Real Estate Board Statistics Package Mike Stewart Realtor
October 2015 Vancouver Real Estate Board Statistics Package Mike Stewart RealtorOctober 2015 Vancouver Real Estate Board Statistics Package Mike Stewart Realtor
October 2015 Vancouver Real Estate Board Statistics Package Mike Stewart Realtor
Ā 
June 2015 rebgv stats package mike stewart
June 2015 rebgv stats package mike stewartJune 2015 rebgv stats package mike stewart
June 2015 rebgv stats package mike stewart
Ā 
REBGV November 2015 Statistics Package Mike Stewart Realtor
REBGV November 2015 Statistics Package Mike Stewart RealtorREBGV November 2015 Statistics Package Mike Stewart Realtor
REBGV November 2015 Statistics Package Mike Stewart Realtor
Ā 
May 2016 Real Estate Board of Greater Vancouver Statistics Package
May 2016 Real Estate Board of Greater Vancouver Statistics PackageMay 2016 Real Estate Board of Greater Vancouver Statistics Package
May 2016 Real Estate Board of Greater Vancouver Statistics Package
Ā 
REBGV STATS PACKAGE JULY 2017
REBGV STATS PACKAGE JULY 2017REBGV STATS PACKAGE JULY 2017
REBGV STATS PACKAGE JULY 2017
Ā 
June 2017 REBGV Statistics Package
June 2017 REBGV Statistics PackageJune 2017 REBGV Statistics Package
June 2017 REBGV Statistics Package
Ā 
February 2016 REBGV Stats Mike Stewart Realtor
February 2016 REBGV Stats Mike Stewart RealtorFebruary 2016 REBGV Stats Mike Stewart Realtor
February 2016 REBGV Stats Mike Stewart Realtor
Ā 
Real Estate Board of Greater Vancouver Statistics Package October 2021
Real Estate Board of Greater Vancouver Statistics Package October 2021Real Estate Board of Greater Vancouver Statistics Package October 2021
Real Estate Board of Greater Vancouver Statistics Package October 2021
Ā 
December 2021 Victoria Real Estate Board Statistics Package
December 2021 Victoria Real Estate Board Statistics Package December 2021 Victoria Real Estate Board Statistics Package
December 2021 Victoria Real Estate Board Statistics Package
Ā 
Rebgv stats-pkg-september-2019
Rebgv stats-pkg-september-2019Rebgv stats-pkg-september-2019
Rebgv stats-pkg-september-2019
Ā 
Metro Vancouver Statistics Report October 2021
Metro Vancouver Statistics Report October 2021Metro Vancouver Statistics Report October 2021
Metro Vancouver Statistics Report October 2021
Ā 
Rebgv stats-pkg-november-2019-f
Rebgv stats-pkg-november-2019-fRebgv stats-pkg-november-2019-f
Rebgv stats-pkg-november-2019-f
Ā 

Similar to 2017 Real Estate Board of Greater Vancouver Statistics Package with Charts & Graphs

September 2017 rebgv statistics package mike stewart realtor
September 2017 rebgv statistics package mike stewart realtorSeptember 2017 rebgv statistics package mike stewart realtor
September 2017 rebgv statistics package mike stewart realtorMike Stewart
Ā 
July 2017 Real Estate Board of Greater Vancouver Stats Package Mike Stewart r...
July 2017 Real Estate Board of Greater Vancouver Stats Package Mike Stewart r...July 2017 Real Estate Board of Greater Vancouver Stats Package Mike Stewart r...
July 2017 Real Estate Board of Greater Vancouver Stats Package Mike Stewart r...Mike Stewart
Ā 
201807 rebgv-stats-package-for-media
201807 rebgv-stats-package-for-media201807 rebgv-stats-package-for-media
201807 rebgv-stats-package-for-mediaKathryn Huang
Ā 
May-2019 Stats Package for Greater Vancouver
May-2019 Stats Package for Greater VancouverMay-2019 Stats Package for Greater Vancouver
May-2019 Stats Package for Greater VancouverBC PRIME Realty
Ā 
Rebgv stats-pkg-may-2019
Rebgv stats-pkg-may-2019Rebgv stats-pkg-may-2019
Rebgv stats-pkg-may-2019Kathryn Huang
Ā 
October 2017 REBGV Stats Mike Stewart Vancouver Realtor
October 2017 REBGV Stats Mike Stewart Vancouver RealtorOctober 2017 REBGV Stats Mike Stewart Vancouver Realtor
October 2017 REBGV Stats Mike Stewart Vancouver RealtorMike Stewart
Ā 
REBGV Statistic Package December 2020
REBGV Statistic Package December 2020REBGV Statistic Package December 2020
REBGV Statistic Package December 2020Vicky Aulakh
Ā 
Rebgv stats-pkg-june-2018
Rebgv stats-pkg-june-2018Rebgv stats-pkg-june-2018
Rebgv stats-pkg-june-2018Kathryn Huang
Ā 
Rebgv stats-pkg-january-2018 2
Rebgv stats-pkg-january-2018 2Rebgv stats-pkg-january-2018 2
Rebgv stats-pkg-january-2018 2Kathryn Huang
Ā 
REBGV STATS PACKAGE JUNE 2017
REBGV STATS PACKAGE JUNE 2017REBGV STATS PACKAGE JUNE 2017
REBGV STATS PACKAGE JUNE 2017vanrealtor1
Ā 
Rebgv stats-pkg-september-2018
Rebgv stats-pkg-september-2018Rebgv stats-pkg-september-2018
Rebgv stats-pkg-september-2018Kathryn Huang
Ā 
Rebgv stats-pkg-august-2018
Rebgv stats-pkg-august-2018Rebgv stats-pkg-august-2018
Rebgv stats-pkg-august-2018Kathryn Huang
Ā 
REBGV Statistics Package November 2022
REBGV Statistics Package November 2022REBGV Statistics Package November 2022
REBGV Statistics Package November 2022VickyAulakh1
Ā 
Rebgv stats-pkg-october-2018 .pdf
Rebgv stats-pkg-october-2018 .pdf Rebgv stats-pkg-october-2018 .pdf
Rebgv stats-pkg-october-2018 .pdf Kathryn Huang
Ā 
2018 dec-stats-pkg
2018 dec-stats-pkg2018 dec-stats-pkg
2018 dec-stats-pkgSherryl Jacobs
Ā 
Rebgv stats-pkg-december-2018
Rebgv stats-pkg-december-2018Rebgv stats-pkg-december-2018
Rebgv stats-pkg-december-2018Kathryn Huang
Ā 
Rebgv stats-pkg-may-2018
Rebgv stats-pkg-may-2018Rebgv stats-pkg-may-2018
Rebgv stats-pkg-may-2018Kathryn Huang
Ā 
REBGV Statistics Package October 2020
REBGV Statistics Package October 2020REBGV Statistics Package October 2020
REBGV Statistics Package October 2020Vicky Aulakh
Ā 
Rebgv stats-pkg-july-2019
Rebgv stats-pkg-july-2019Rebgv stats-pkg-july-2019
Rebgv stats-pkg-july-2019Vicky Aulakh
Ā 

Similar to 2017 Real Estate Board of Greater Vancouver Statistics Package with Charts & Graphs (20)

September 2017 rebgv statistics package mike stewart realtor
September 2017 rebgv statistics package mike stewart realtorSeptember 2017 rebgv statistics package mike stewart realtor
September 2017 rebgv statistics package mike stewart realtor
Ā 
July 2017 Real Estate Board of Greater Vancouver Stats Package Mike Stewart r...
July 2017 Real Estate Board of Greater Vancouver Stats Package Mike Stewart r...July 2017 Real Estate Board of Greater Vancouver Stats Package Mike Stewart r...
July 2017 Real Estate Board of Greater Vancouver Stats Package Mike Stewart r...
Ā 
201807 rebgv-stats-package-for-media
201807 rebgv-stats-package-for-media201807 rebgv-stats-package-for-media
201807 rebgv-stats-package-for-media
Ā 
May-2019 Stats Package for Greater Vancouver
May-2019 Stats Package for Greater VancouverMay-2019 Stats Package for Greater Vancouver
May-2019 Stats Package for Greater Vancouver
Ā 
Rebgv stats-pkg-may-2019
Rebgv stats-pkg-may-2019Rebgv stats-pkg-may-2019
Rebgv stats-pkg-may-2019
Ā 
October 2017 REBGV Stats Mike Stewart Vancouver Realtor
October 2017 REBGV Stats Mike Stewart Vancouver RealtorOctober 2017 REBGV Stats Mike Stewart Vancouver Realtor
October 2017 REBGV Stats Mike Stewart Vancouver Realtor
Ā 
REBGV Statistic Package December 2020
REBGV Statistic Package December 2020REBGV Statistic Package December 2020
REBGV Statistic Package December 2020
Ā 
Rebgv stats-pkg-june-2018
Rebgv stats-pkg-june-2018Rebgv stats-pkg-june-2018
Rebgv stats-pkg-june-2018
Ā 
Rebgv stats-pkg-january-2018 2
Rebgv stats-pkg-january-2018 2Rebgv stats-pkg-january-2018 2
Rebgv stats-pkg-january-2018 2
Ā 
REBGV STATS PACKAGE JUNE 2017
REBGV STATS PACKAGE JUNE 2017REBGV STATS PACKAGE JUNE 2017
REBGV STATS PACKAGE JUNE 2017
Ā 
Rebgv stats-pkg-september-2018
Rebgv stats-pkg-september-2018Rebgv stats-pkg-september-2018
Rebgv stats-pkg-september-2018
Ā 
Rebgv stats-pkg-august-2018
Rebgv stats-pkg-august-2018Rebgv stats-pkg-august-2018
Rebgv stats-pkg-august-2018
Ā 
REBGV Statistics Package November 2022
REBGV Statistics Package November 2022REBGV Statistics Package November 2022
REBGV Statistics Package November 2022
Ā 
Rebgv stats-pkg-october-2018 .pdf
Rebgv stats-pkg-october-2018 .pdf Rebgv stats-pkg-october-2018 .pdf
Rebgv stats-pkg-october-2018 .pdf
Ā 
2018 dec-stats-pkg
2018 dec-stats-pkg2018 dec-stats-pkg
2018 dec-stats-pkg
Ā 
Rebgv stats-pkg-december-2018
Rebgv stats-pkg-december-2018Rebgv stats-pkg-december-2018
Rebgv stats-pkg-december-2018
Ā 
Rebgv stats-pkg-may-2018
Rebgv stats-pkg-may-2018Rebgv stats-pkg-may-2018
Rebgv stats-pkg-may-2018
Ā 
REBGV Statistics Package October 2020
REBGV Statistics Package October 2020REBGV Statistics Package October 2020
REBGV Statistics Package October 2020
Ā 
Rebgv stats-pkg-october-2020
Rebgv stats-pkg-october-2020Rebgv stats-pkg-october-2020
Rebgv stats-pkg-october-2020
Ā 
Rebgv stats-pkg-july-2019
Rebgv stats-pkg-july-2019Rebgv stats-pkg-july-2019
Rebgv stats-pkg-july-2019
Ā 

More from Kathryn Huang

Disclosureof representationintradingservices english-recbc (4)
Disclosureof representationintradingservices english-recbc (4)Disclosureof representationintradingservices english-recbc (4)
Disclosureof representationintradingservices english-recbc (4)Kathryn Huang
Ā 
Property disclosure statement strata title properties mike stewart prec
Property disclosure statement strata title properties mike stewart precProperty disclosure statement strata title properties mike stewart prec
Property disclosure statement strata title properties mike stewart precKathryn Huang
Ā 
Rebgv stats-pkg-april-2019
Rebgv stats-pkg-april-2019Rebgv stats-pkg-april-2019
Rebgv stats-pkg-april-2019Kathryn Huang
Ā 
Privacy noticeandconsent (3)
Privacy noticeandconsent (3)Privacy noticeandconsent (3)
Privacy noticeandconsent (3)Kathryn Huang
Ā 
Rebgv stats-pkg-march-2019
Rebgv stats-pkg-march-2019Rebgv stats-pkg-march-2019
Rebgv stats-pkg-march-2019Kathryn Huang
Ā 
Rebgv stats-pkg-february-2019
Rebgv stats-pkg-february-2019Rebgv stats-pkg-february-2019
Rebgv stats-pkg-february-2019Kathryn Huang
Ā 
Rebgv stats-pkg-january-2019
Rebgv stats-pkg-january-2019Rebgv stats-pkg-january-2019
Rebgv stats-pkg-january-2019Kathryn Huang
Ā 
Rebgv stats-pkg-november-2018
Rebgv stats-pkg-november-2018Rebgv stats-pkg-november-2018
Rebgv stats-pkg-november-2018Kathryn Huang
Ā 
Broadway corridor-planning-program-presentation-may-2018
Broadway corridor-planning-program-presentation-may-2018Broadway corridor-planning-program-presentation-may-2018
Broadway corridor-planning-program-presentation-may-2018Kathryn Huang
Ā 
Rebgv stats-pkg-april-2018
Rebgv stats-pkg-april-2018Rebgv stats-pkg-april-2018
Rebgv stats-pkg-april-2018Kathryn Huang
Ā 
2018 03-metro-vancouver
2018 03-metro-vancouver 2018 03-metro-vancouver
2018 03-metro-vancouver Kathryn Huang
Ā 
Rebgv stats-pkg-february-2018
Rebgv stats-pkg-february-2018Rebgv stats-pkg-february-2018
Rebgv stats-pkg-february-2018Kathryn Huang
Ā 

More from Kathryn Huang (14)

Disclosureof representationintradingservices english-recbc (4)
Disclosureof representationintradingservices english-recbc (4)Disclosureof representationintradingservices english-recbc (4)
Disclosureof representationintradingservices english-recbc (4)
Ā 
Property disclosure statement strata title properties mike stewart prec
Property disclosure statement strata title properties mike stewart precProperty disclosure statement strata title properties mike stewart prec
Property disclosure statement strata title properties mike stewart prec
Ā 
Rebgv stats-pkg-april-2019
Rebgv stats-pkg-april-2019Rebgv stats-pkg-april-2019
Rebgv stats-pkg-april-2019
Ā 
2516 bc
2516 bc2516 bc
2516 bc
Ā 
Privacy noticeandconsent (3)
Privacy noticeandconsent (3)Privacy noticeandconsent (3)
Privacy noticeandconsent (3)
Ā 
Rebgv stats-pkg-march-2019
Rebgv stats-pkg-march-2019Rebgv stats-pkg-march-2019
Rebgv stats-pkg-march-2019
Ā 
Rebgv stats-pkg-february-2019
Rebgv stats-pkg-february-2019Rebgv stats-pkg-february-2019
Rebgv stats-pkg-february-2019
Ā 
Rebgv stats-pkg-january-2019
Rebgv stats-pkg-january-2019Rebgv stats-pkg-january-2019
Rebgv stats-pkg-january-2019
Ā 
Rebgv stats-pkg-november-2018
Rebgv stats-pkg-november-2018Rebgv stats-pkg-november-2018
Rebgv stats-pkg-november-2018
Ā 
2440 bc
2440 bc2440 bc
2440 bc
Ā 
Broadway corridor-planning-program-presentation-may-2018
Broadway corridor-planning-program-presentation-may-2018Broadway corridor-planning-program-presentation-may-2018
Broadway corridor-planning-program-presentation-may-2018
Ā 
Rebgv stats-pkg-april-2018
Rebgv stats-pkg-april-2018Rebgv stats-pkg-april-2018
Rebgv stats-pkg-april-2018
Ā 
2018 03-metro-vancouver
2018 03-metro-vancouver 2018 03-metro-vancouver
2018 03-metro-vancouver
Ā 
Rebgv stats-pkg-february-2018
Rebgv stats-pkg-february-2018Rebgv stats-pkg-february-2018
Rebgv stats-pkg-february-2018
Ā 

Recently uploaded

Call Girls in Nehru Place Delhi šŸ’ÆCall Us šŸ”8264348440šŸ”
Call Girls in Nehru Place Delhi šŸ’ÆCall Us šŸ”8264348440šŸ”Call Girls in Nehru Place Delhi šŸ’ÆCall Us šŸ”8264348440šŸ”
Call Girls in Nehru Place Delhi šŸ’ÆCall Us šŸ”8264348440šŸ”soniya singh
Ā 
SVN Live 4.22.24 Weekly Property Broadcast
SVN Live 4.22.24 Weekly Property BroadcastSVN Live 4.22.24 Weekly Property Broadcast
SVN Live 4.22.24 Weekly Property BroadcastSVN International Corp.
Ā 
Call Girls In Madipur Metro Delhiź§ +91)8447779280ź§‚Low Rate 2 short 2000 full ...
Call Girls In Madipur Metro Delhiź§ +91)8447779280ź§‚Low Rate 2 short 2000 full ...Call Girls In Madipur Metro Delhiź§ +91)8447779280ź§‚Low Rate 2 short 2000 full ...
Call Girls In Madipur Metro Delhiź§ +91)8447779280ź§‚Low Rate 2 short 2000 full ...asmaqueen5
Ā 
Call Girls In Sahibabad Ghaziabad ā¤ļø8860477959 Low Rate Escorts Service In 24...
Call Girls In Sahibabad Ghaziabad ā¤ļø8860477959 Low Rate Escorts Service In 24...Call Girls In Sahibabad Ghaziabad ā¤ļø8860477959 Low Rate Escorts Service In 24...
Call Girls In Sahibabad Ghaziabad ā¤ļø8860477959 Low Rate Escorts Service In 24...lizamodels9
Ā 
The Omaxe State Dwarka Delhi-broucher.pdf.pdf
The Omaxe State Dwarka Delhi-broucher.pdf.pdfThe Omaxe State Dwarka Delhi-broucher.pdf.pdf
The Omaxe State Dwarka Delhi-broucher.pdf.pdfkratirudram
Ā 
8 Key Elements for Comfortable Farmland Living
8 Key Elements for Comfortable Farmland Living 8 Key Elements for Comfortable Farmland Living
8 Key Elements for Comfortable Farmland Living Farmland Bazaar
Ā 
Eco-Efficient Living: Redefining Sustainability through Leech's Green Design ...
Eco-Efficient Living: Redefining Sustainability through Leech's Green Design ...Eco-Efficient Living: Redefining Sustainability through Leech's Green Design ...
Eco-Efficient Living: Redefining Sustainability through Leech's Green Design ...Newman George Leech
Ā 
Omaxe Dwarka In Delhi E Brochure Pdf
Omaxe Dwarka In Delhi E Brochure     PdfOmaxe Dwarka In Delhi E Brochure     Pdf
Omaxe Dwarka In Delhi E Brochure Pdfashiyadav24
Ā 
SSPL The Strand Abodes Kharadi Pune Brochure.pdf
SSPL The Strand Abodes Kharadi Pune Brochure.pdfSSPL The Strand Abodes Kharadi Pune Brochure.pdf
SSPL The Strand Abodes Kharadi Pune Brochure.pdfabbu831446
Ā 
call girls in Shahdara (DELHI) šŸ” >ą¼’9953330565šŸ” genuine Escort Service šŸ”āœ”ļøāœ”ļø
call girls in Shahdara (DELHI) šŸ” >ą¼’9953330565šŸ” genuine Escort Service šŸ”āœ”ļøāœ”ļøcall girls in Shahdara (DELHI) šŸ” >ą¼’9953330565šŸ” genuine Escort Service šŸ”āœ”ļøāœ”ļø
call girls in Shahdara (DELHI) šŸ” >ą¼’9953330565šŸ” genuine Escort Service šŸ”āœ”ļøāœ”ļø9953056974 Low Rate Call Girls In Saket, Delhi NCR
Ā 
9711199012 Call {Girls Delhi} Very Low rate Vaishali DownLoad PDF
9711199012 Call {Girls Delhi} Very Low rate Vaishali DownLoad PDF9711199012 Call {Girls Delhi} Very Low rate Vaishali DownLoad PDF
9711199012 Call {Girls Delhi} Very Low rate Vaishali DownLoad PDFMs Riya
Ā 
Call Girls In The Lalit New Delhi ā¤ļø8860477959 Good Looking Escorts In 24/7 D...
Call Girls In The Lalit New Delhi ā¤ļø8860477959 Good Looking Escorts In 24/7 D...Call Girls In The Lalit New Delhi ā¤ļø8860477959 Good Looking Escorts In 24/7 D...
Call Girls In The Lalit New Delhi ā¤ļø8860477959 Good Looking Escorts In 24/7 D...lizamodels9
Ā 
Building Dreams: Newman Leech's Visionary Approach to Real Estate Investment
Building Dreams: Newman Leech's Visionary Approach to Real Estate InvestmentBuilding Dreams: Newman Leech's Visionary Approach to Real Estate Investment
Building Dreams: Newman Leech's Visionary Approach to Real Estate InvestmentNewman George Leech
Ā 
Call Girls in Model Town Delhi šŸ’ÆCall Us šŸ”8264348440šŸ”
Call Girls in Model Town Delhi šŸ’ÆCall Us šŸ”8264348440šŸ”Call Girls in Model Town Delhi šŸ’ÆCall Us šŸ”8264348440šŸ”
Call Girls in Model Town Delhi šŸ’ÆCall Us šŸ”8264348440šŸ”soniya singh
Ā 
Call Girls in laxmi Nagar Delhi šŸ’ÆCall Us šŸ” 9582086666šŸ” South Delhi Escorts Se...
Call Girls in laxmi Nagar Delhi šŸ’ÆCall Us šŸ” 9582086666šŸ” South Delhi Escorts Se...Call Girls in laxmi Nagar Delhi šŸ’ÆCall Us šŸ” 9582086666šŸ” South Delhi Escorts Se...
Call Girls in laxmi Nagar Delhi šŸ’ÆCall Us šŸ” 9582086666šŸ” South Delhi Escorts Se...delhimodel235
Ā 
Call Girls In Mayur Vihar-1 Delhi ā¤ļø8860477959 Good Looking Escorts In 24/7 D...
Call Girls In Mayur Vihar-1 Delhi ā¤ļø8860477959 Good Looking Escorts In 24/7 D...Call Girls In Mayur Vihar-1 Delhi ā¤ļø8860477959 Good Looking Escorts In 24/7 D...
Call Girls In Mayur Vihar-1 Delhi ā¤ļø8860477959 Good Looking Escorts In 24/7 D...lizamodels9
Ā 
Call girls in Jeewan Park .Delhiā†«8447779280ā†¬ ź§‚Escorts Service In Delhi Ncr
Call girls in Jeewan Park .Delhiā†«8447779280ā†¬ ź§‚Escorts Service In Delhi NcrCall girls in Jeewan Park .Delhiā†«8447779280ā†¬ ź§‚Escorts Service In Delhi Ncr
Call girls in Jeewan Park .Delhiā†«8447779280ā†¬ ź§‚Escorts Service In Delhi Ncrasmaqueen5
Ā 

Recently uploaded (20)

Call Girls in Nehru Place Delhi šŸ’ÆCall Us šŸ”8264348440šŸ”
Call Girls in Nehru Place Delhi šŸ’ÆCall Us šŸ”8264348440šŸ”Call Girls in Nehru Place Delhi šŸ’ÆCall Us šŸ”8264348440šŸ”
Call Girls in Nehru Place Delhi šŸ’ÆCall Us šŸ”8264348440šŸ”
Ā 
SVN Live 4.22.24 Weekly Property Broadcast
SVN Live 4.22.24 Weekly Property BroadcastSVN Live 4.22.24 Weekly Property Broadcast
SVN Live 4.22.24 Weekly Property Broadcast
Ā 
Call Girls In Madipur Metro Delhiź§ +91)8447779280ź§‚Low Rate 2 short 2000 full ...
Call Girls In Madipur Metro Delhiź§ +91)8447779280ź§‚Low Rate 2 short 2000 full ...Call Girls In Madipur Metro Delhiź§ +91)8447779280ź§‚Low Rate 2 short 2000 full ...
Call Girls In Madipur Metro Delhiź§ +91)8447779280ź§‚Low Rate 2 short 2000 full ...
Ā 
Call Girls In Sahibabad Ghaziabad ā¤ļø8860477959 Low Rate Escorts Service In 24...
Call Girls In Sahibabad Ghaziabad ā¤ļø8860477959 Low Rate Escorts Service In 24...Call Girls In Sahibabad Ghaziabad ā¤ļø8860477959 Low Rate Escorts Service In 24...
Call Girls In Sahibabad Ghaziabad ā¤ļø8860477959 Low Rate Escorts Service In 24...
Ā 
The Omaxe State Dwarka Delhi-broucher.pdf.pdf
The Omaxe State Dwarka Delhi-broucher.pdf.pdfThe Omaxe State Dwarka Delhi-broucher.pdf.pdf
The Omaxe State Dwarka Delhi-broucher.pdf.pdf
Ā 
Call Girls in Mahavir Nagar whatsaap call US +919953056974
Call Girls in Mahavir Nagar  whatsaap call US  +919953056974Call Girls in Mahavir Nagar  whatsaap call US  +919953056974
Call Girls in Mahavir Nagar whatsaap call US +919953056974
Ā 
8 Key Elements for Comfortable Farmland Living
8 Key Elements for Comfortable Farmland Living 8 Key Elements for Comfortable Farmland Living
8 Key Elements for Comfortable Farmland Living
Ā 
Eco-Efficient Living: Redefining Sustainability through Leech's Green Design ...
Eco-Efficient Living: Redefining Sustainability through Leech's Green Design ...Eco-Efficient Living: Redefining Sustainability through Leech's Green Design ...
Eco-Efficient Living: Redefining Sustainability through Leech's Green Design ...
Ā 
Omaxe Dwarka In Delhi E Brochure Pdf
Omaxe Dwarka In Delhi E Brochure     PdfOmaxe Dwarka In Delhi E Brochure     Pdf
Omaxe Dwarka In Delhi E Brochure Pdf
Ā 
SSPL The Strand Abodes Kharadi Pune Brochure.pdf
SSPL The Strand Abodes Kharadi Pune Brochure.pdfSSPL The Strand Abodes Kharadi Pune Brochure.pdf
SSPL The Strand Abodes Kharadi Pune Brochure.pdf
Ā 
call girls in Shahdara (DELHI) šŸ” >ą¼’9953330565šŸ” genuine Escort Service šŸ”āœ”ļøāœ”ļø
call girls in Shahdara (DELHI) šŸ” >ą¼’9953330565šŸ” genuine Escort Service šŸ”āœ”ļøāœ”ļøcall girls in Shahdara (DELHI) šŸ” >ą¼’9953330565šŸ” genuine Escort Service šŸ”āœ”ļøāœ”ļø
call girls in Shahdara (DELHI) šŸ” >ą¼’9953330565šŸ” genuine Escort Service šŸ”āœ”ļøāœ”ļø
Ā 
9711199012 Call {Girls Delhi} Very Low rate Vaishali DownLoad PDF
9711199012 Call {Girls Delhi} Very Low rate Vaishali DownLoad PDF9711199012 Call {Girls Delhi} Very Low rate Vaishali DownLoad PDF
9711199012 Call {Girls Delhi} Very Low rate Vaishali DownLoad PDF
Ā 
Call Girls In The Lalit New Delhi ā¤ļø8860477959 Good Looking Escorts In 24/7 D...
Call Girls In The Lalit New Delhi ā¤ļø8860477959 Good Looking Escorts In 24/7 D...Call Girls In The Lalit New Delhi ā¤ļø8860477959 Good Looking Escorts In 24/7 D...
Call Girls In The Lalit New Delhi ā¤ļø8860477959 Good Looking Escorts In 24/7 D...
Ā 
Building Dreams: Newman Leech's Visionary Approach to Real Estate Investment
Building Dreams: Newman Leech's Visionary Approach to Real Estate InvestmentBuilding Dreams: Newman Leech's Visionary Approach to Real Estate Investment
Building Dreams: Newman Leech's Visionary Approach to Real Estate Investment
Ā 
Call Girls in Model Town Delhi šŸ’ÆCall Us šŸ”8264348440šŸ”
Call Girls in Model Town Delhi šŸ’ÆCall Us šŸ”8264348440šŸ”Call Girls in Model Town Delhi šŸ’ÆCall Us šŸ”8264348440šŸ”
Call Girls in Model Town Delhi šŸ’ÆCall Us šŸ”8264348440šŸ”
Ā 
Hot call girls in Moti BaghšŸ” 9953056974 šŸ” escort Service
Hot call girls in Moti BaghšŸ” 9953056974 šŸ” escort ServiceHot call girls in Moti BaghšŸ” 9953056974 šŸ” escort Service
Hot call girls in Moti BaghšŸ” 9953056974 šŸ” escort Service
Ā 
Call Girls in laxmi Nagar Delhi šŸ’ÆCall Us šŸ” 9582086666šŸ” South Delhi Escorts Se...
Call Girls in laxmi Nagar Delhi šŸ’ÆCall Us šŸ” 9582086666šŸ” South Delhi Escorts Se...Call Girls in laxmi Nagar Delhi šŸ’ÆCall Us šŸ” 9582086666šŸ” South Delhi Escorts Se...
Call Girls in laxmi Nagar Delhi šŸ’ÆCall Us šŸ” 9582086666šŸ” South Delhi Escorts Se...
Ā 
Call Girls In Mayur Vihar-1 Delhi ā¤ļø8860477959 Good Looking Escorts In 24/7 D...
Call Girls In Mayur Vihar-1 Delhi ā¤ļø8860477959 Good Looking Escorts In 24/7 D...Call Girls In Mayur Vihar-1 Delhi ā¤ļø8860477959 Good Looking Escorts In 24/7 D...
Call Girls In Mayur Vihar-1 Delhi ā¤ļø8860477959 Good Looking Escorts In 24/7 D...
Ā 
Low Rate Call Girls in Triveni Complex Delhi Call 9873940964
Low Rate Call Girls in Triveni Complex Delhi Call 9873940964Low Rate Call Girls in Triveni Complex Delhi Call 9873940964
Low Rate Call Girls in Triveni Complex Delhi Call 9873940964
Ā 
Call girls in Jeewan Park .Delhiā†«8447779280ā†¬ ź§‚Escorts Service In Delhi Ncr
Call girls in Jeewan Park .Delhiā†«8447779280ā†¬ ź§‚Escorts Service In Delhi NcrCall girls in Jeewan Park .Delhiā†«8447779280ā†¬ ź§‚Escorts Service In Delhi Ncr
Call girls in Jeewan Park .Delhiā†«8447779280ā†¬ ź§‚Escorts Service In Delhi Ncr
Ā 

2017 Real Estate Board of Greater Vancouver Statistics Package with Charts & Graphs