Downloaded 1,183 times
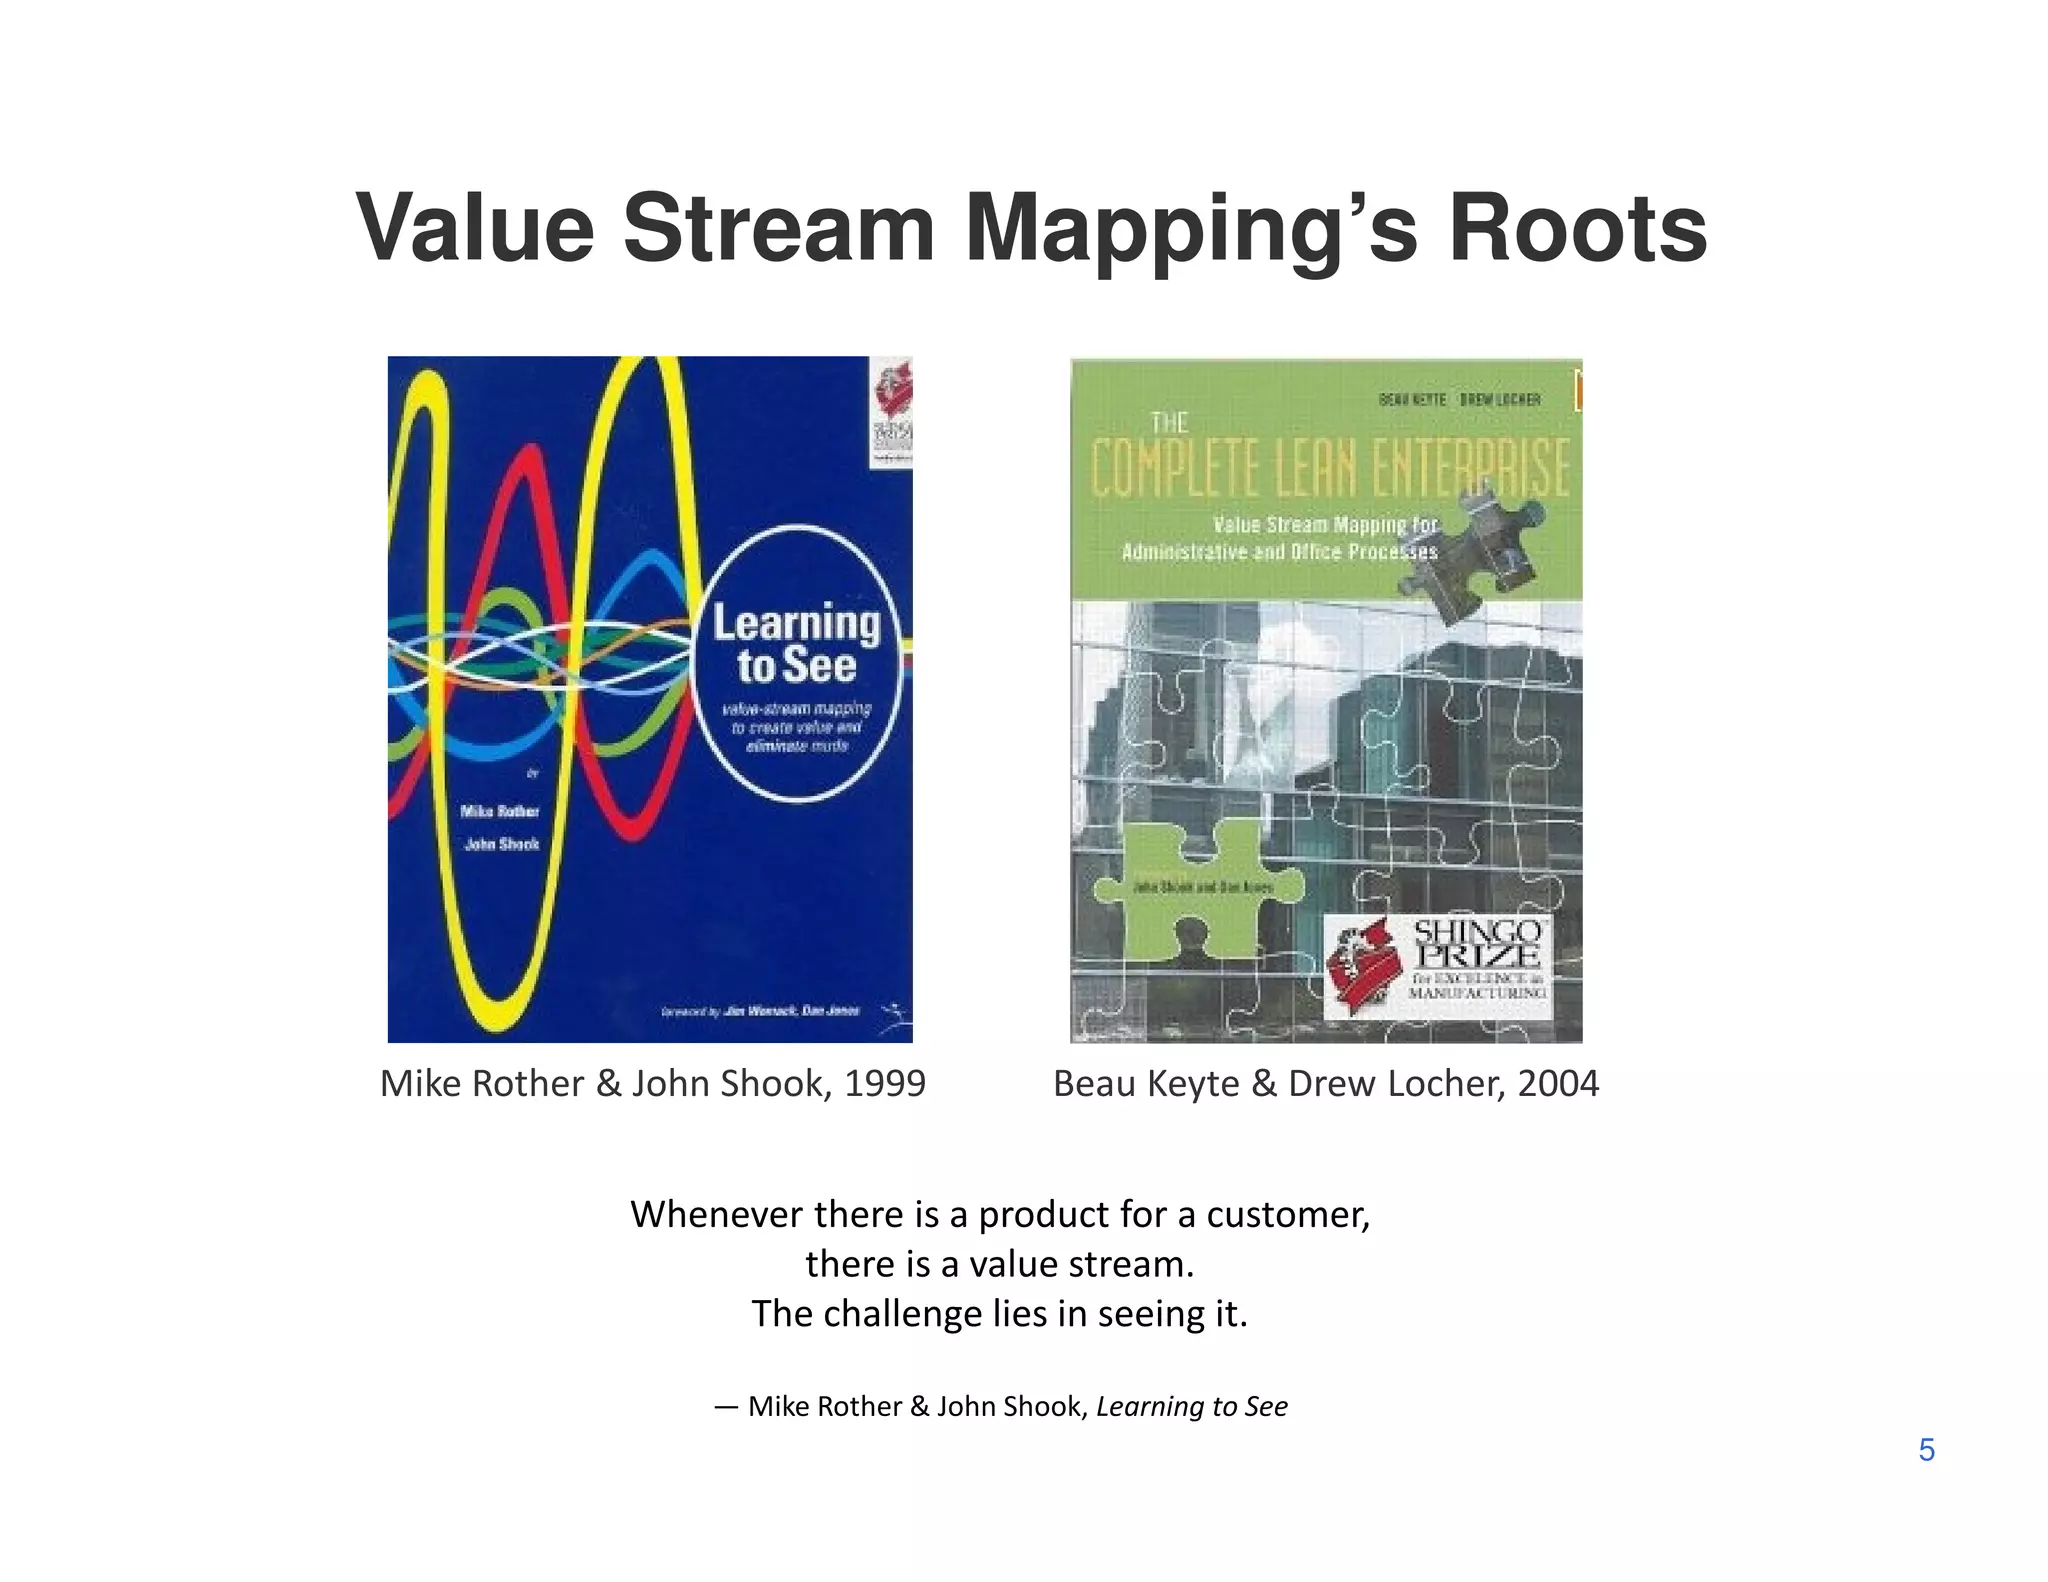
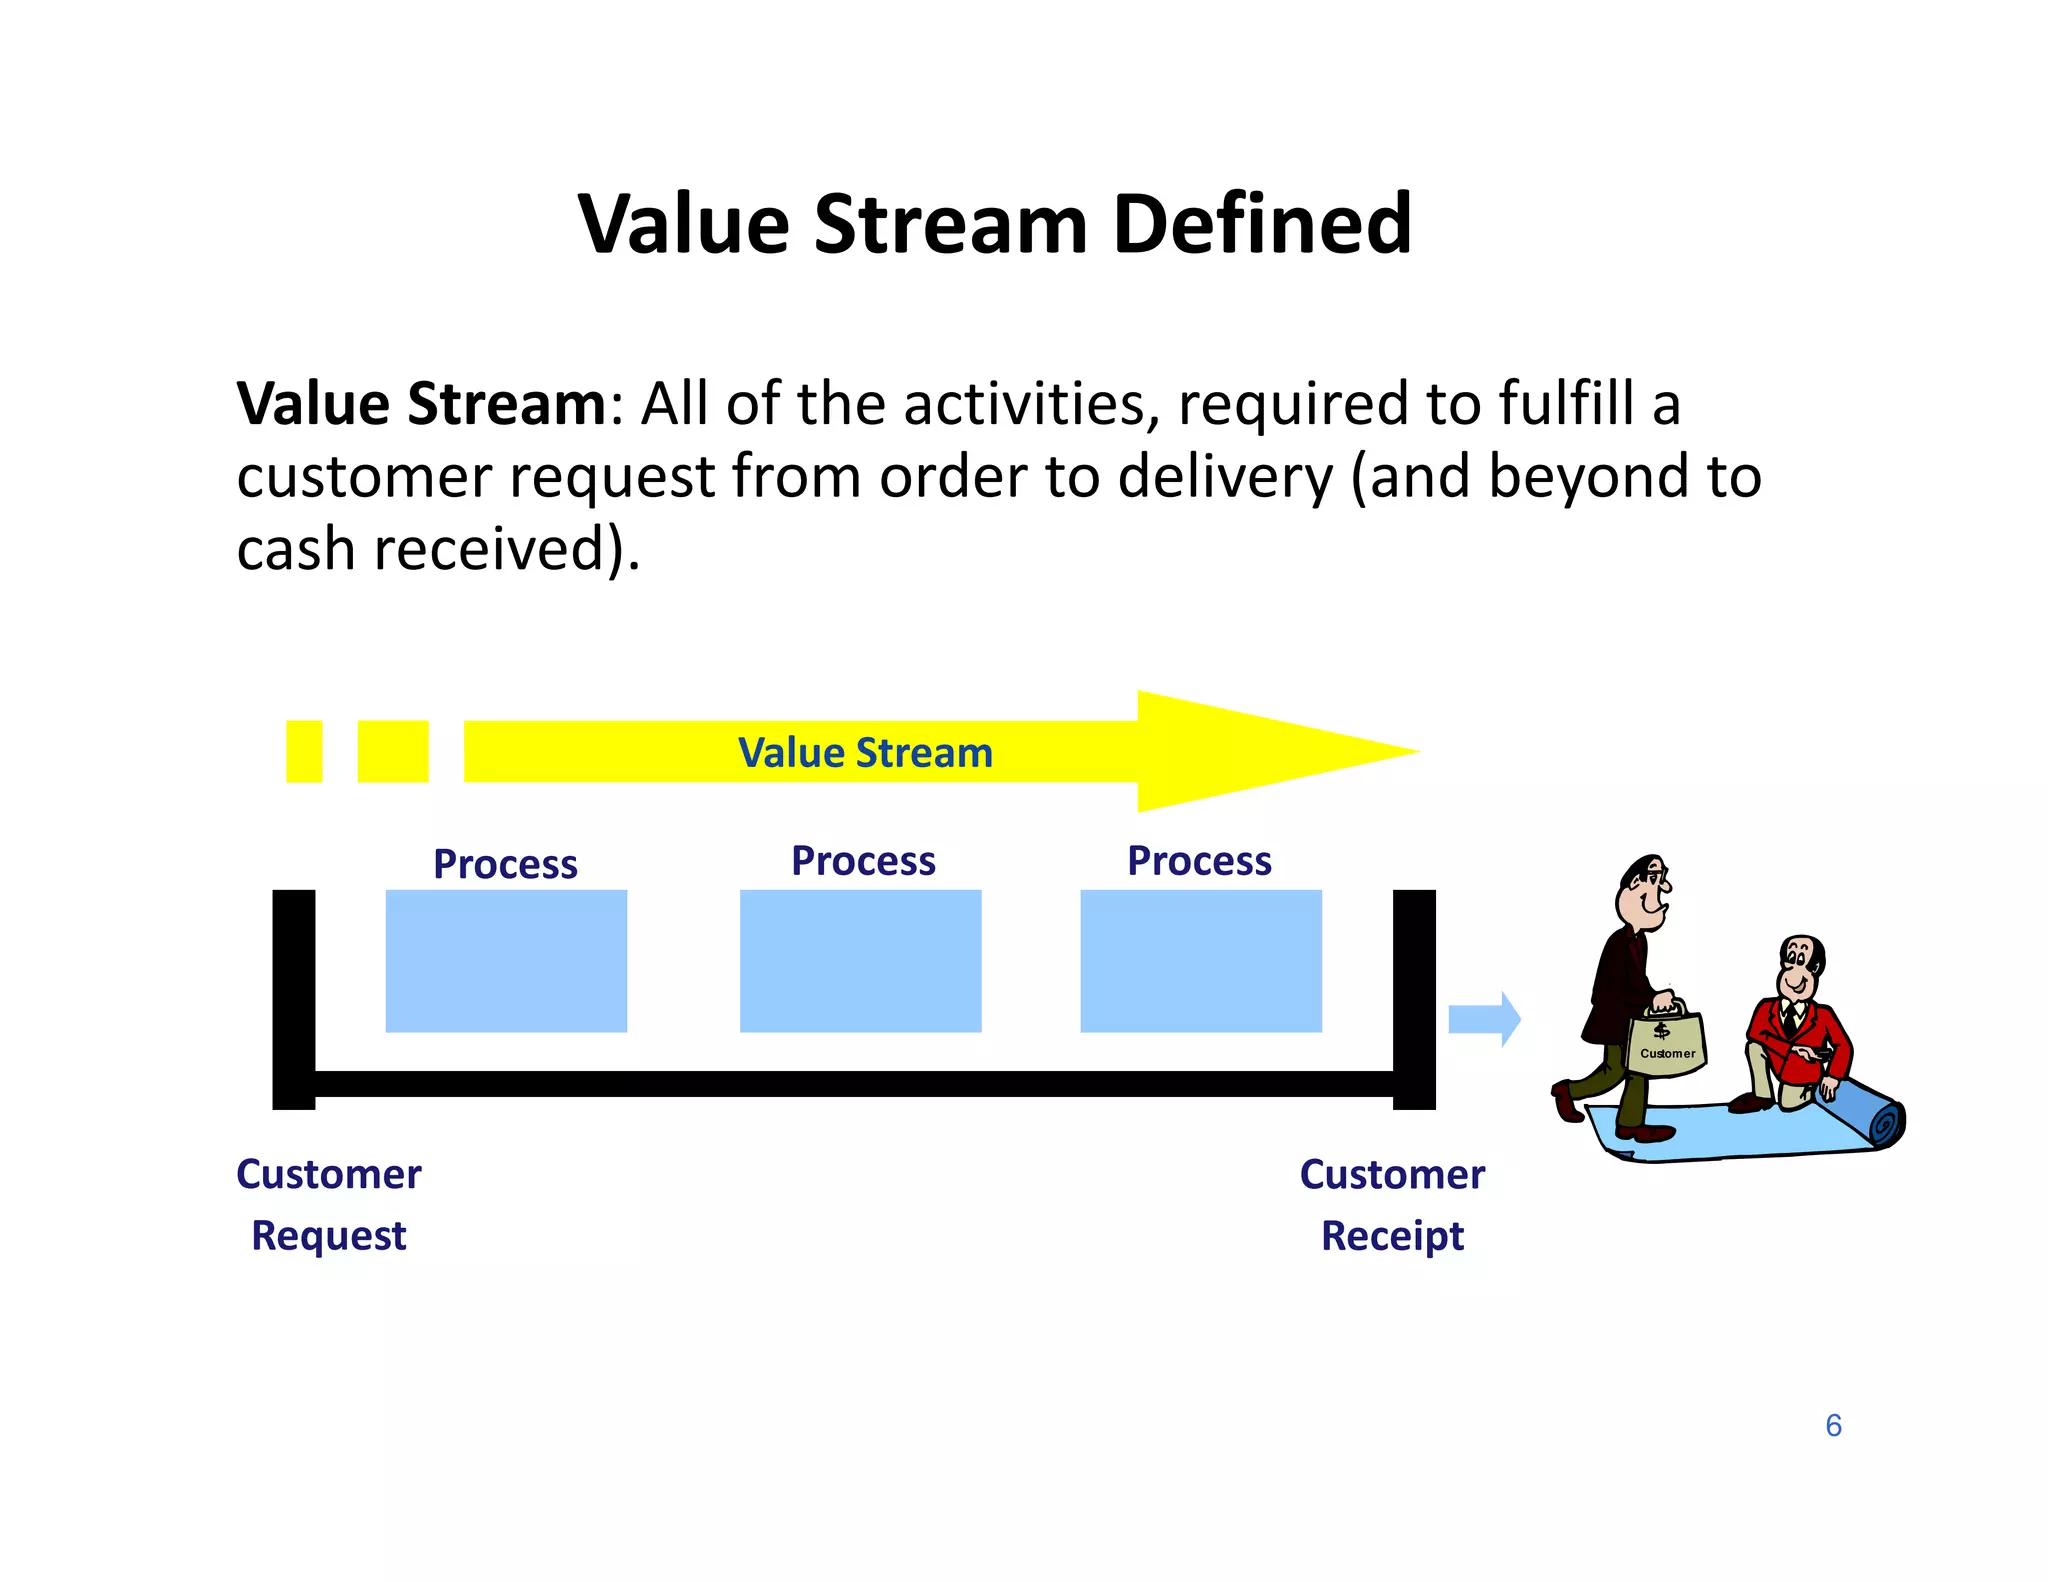
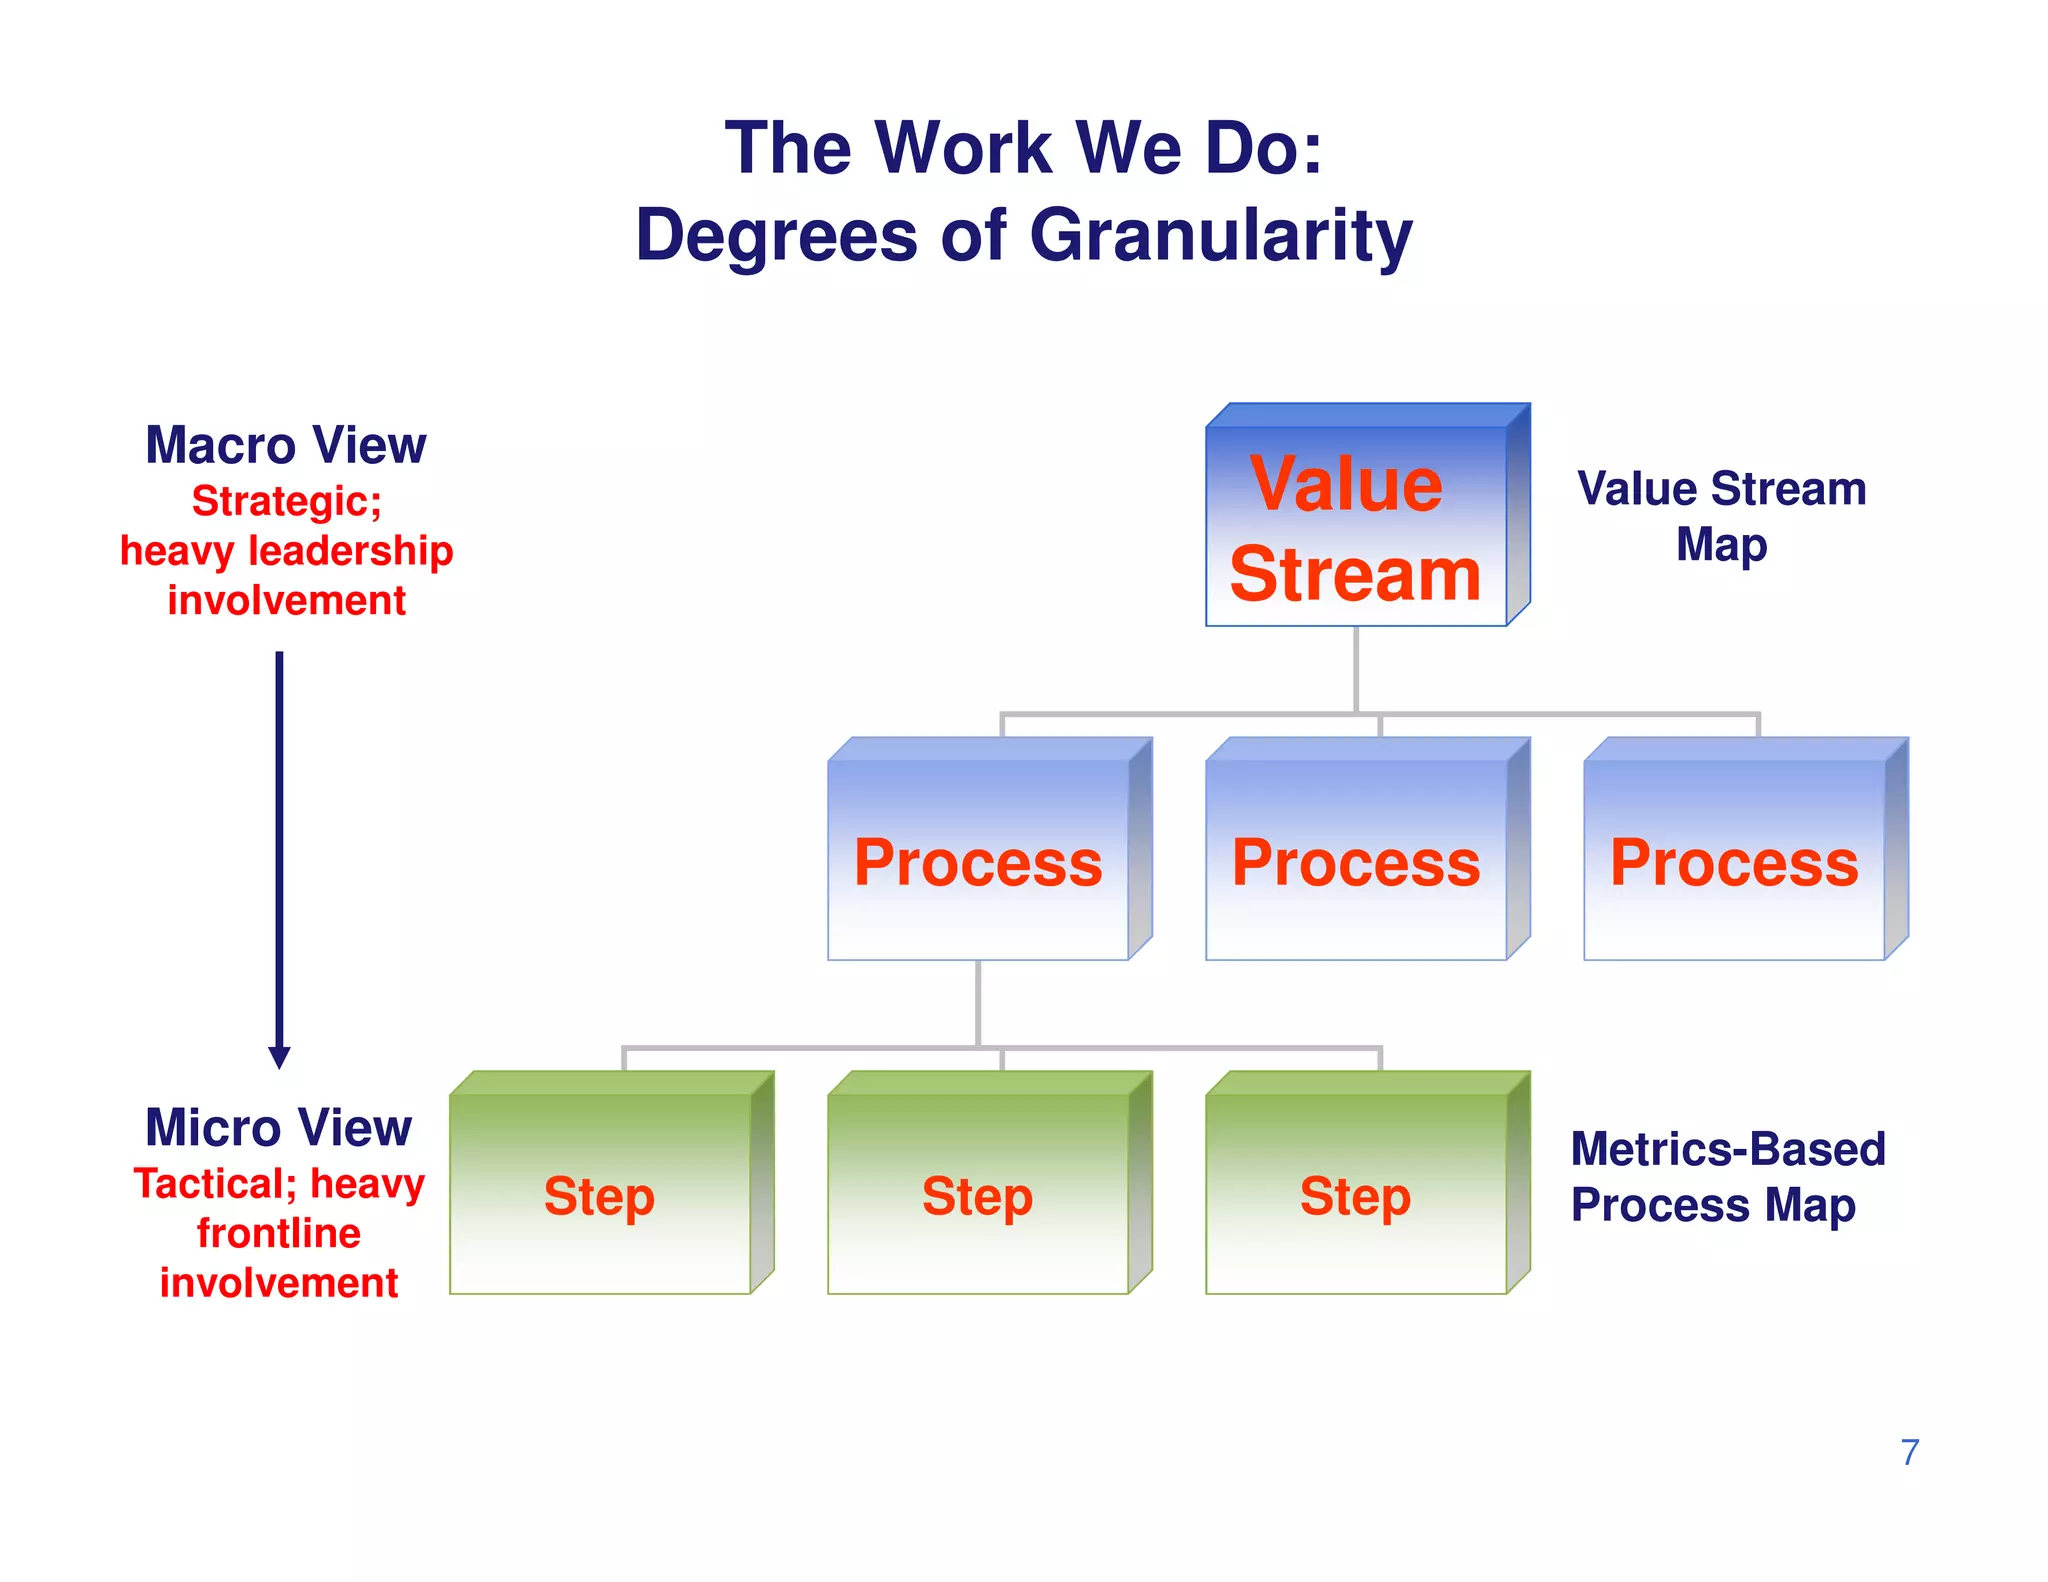
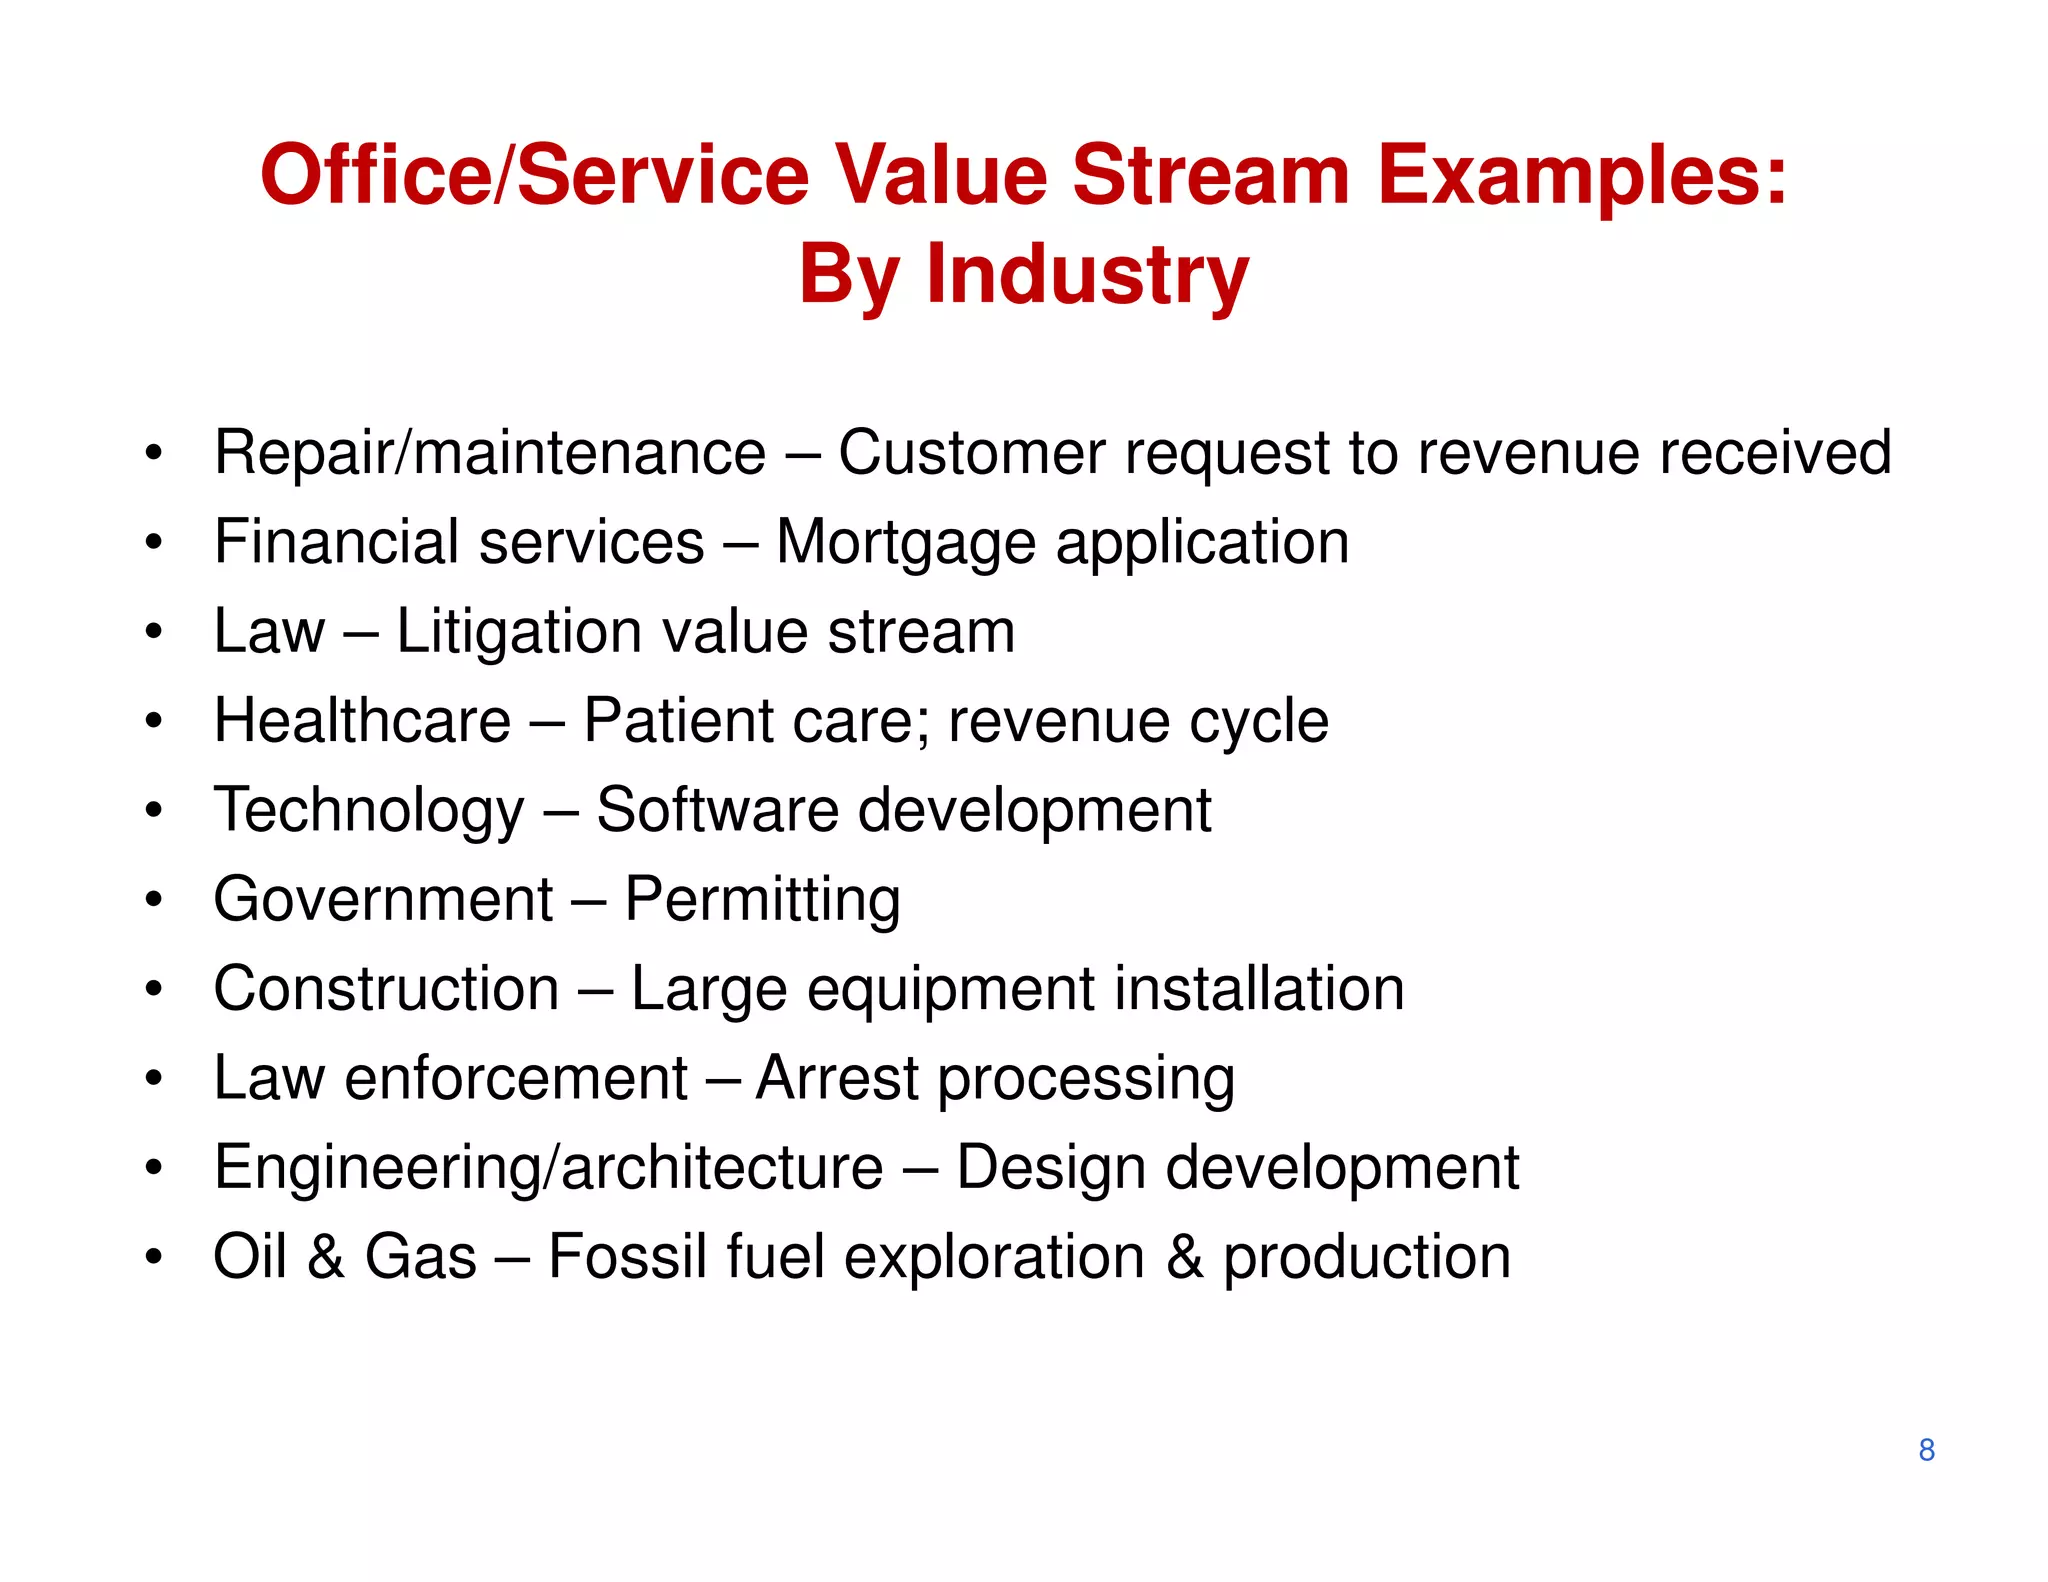
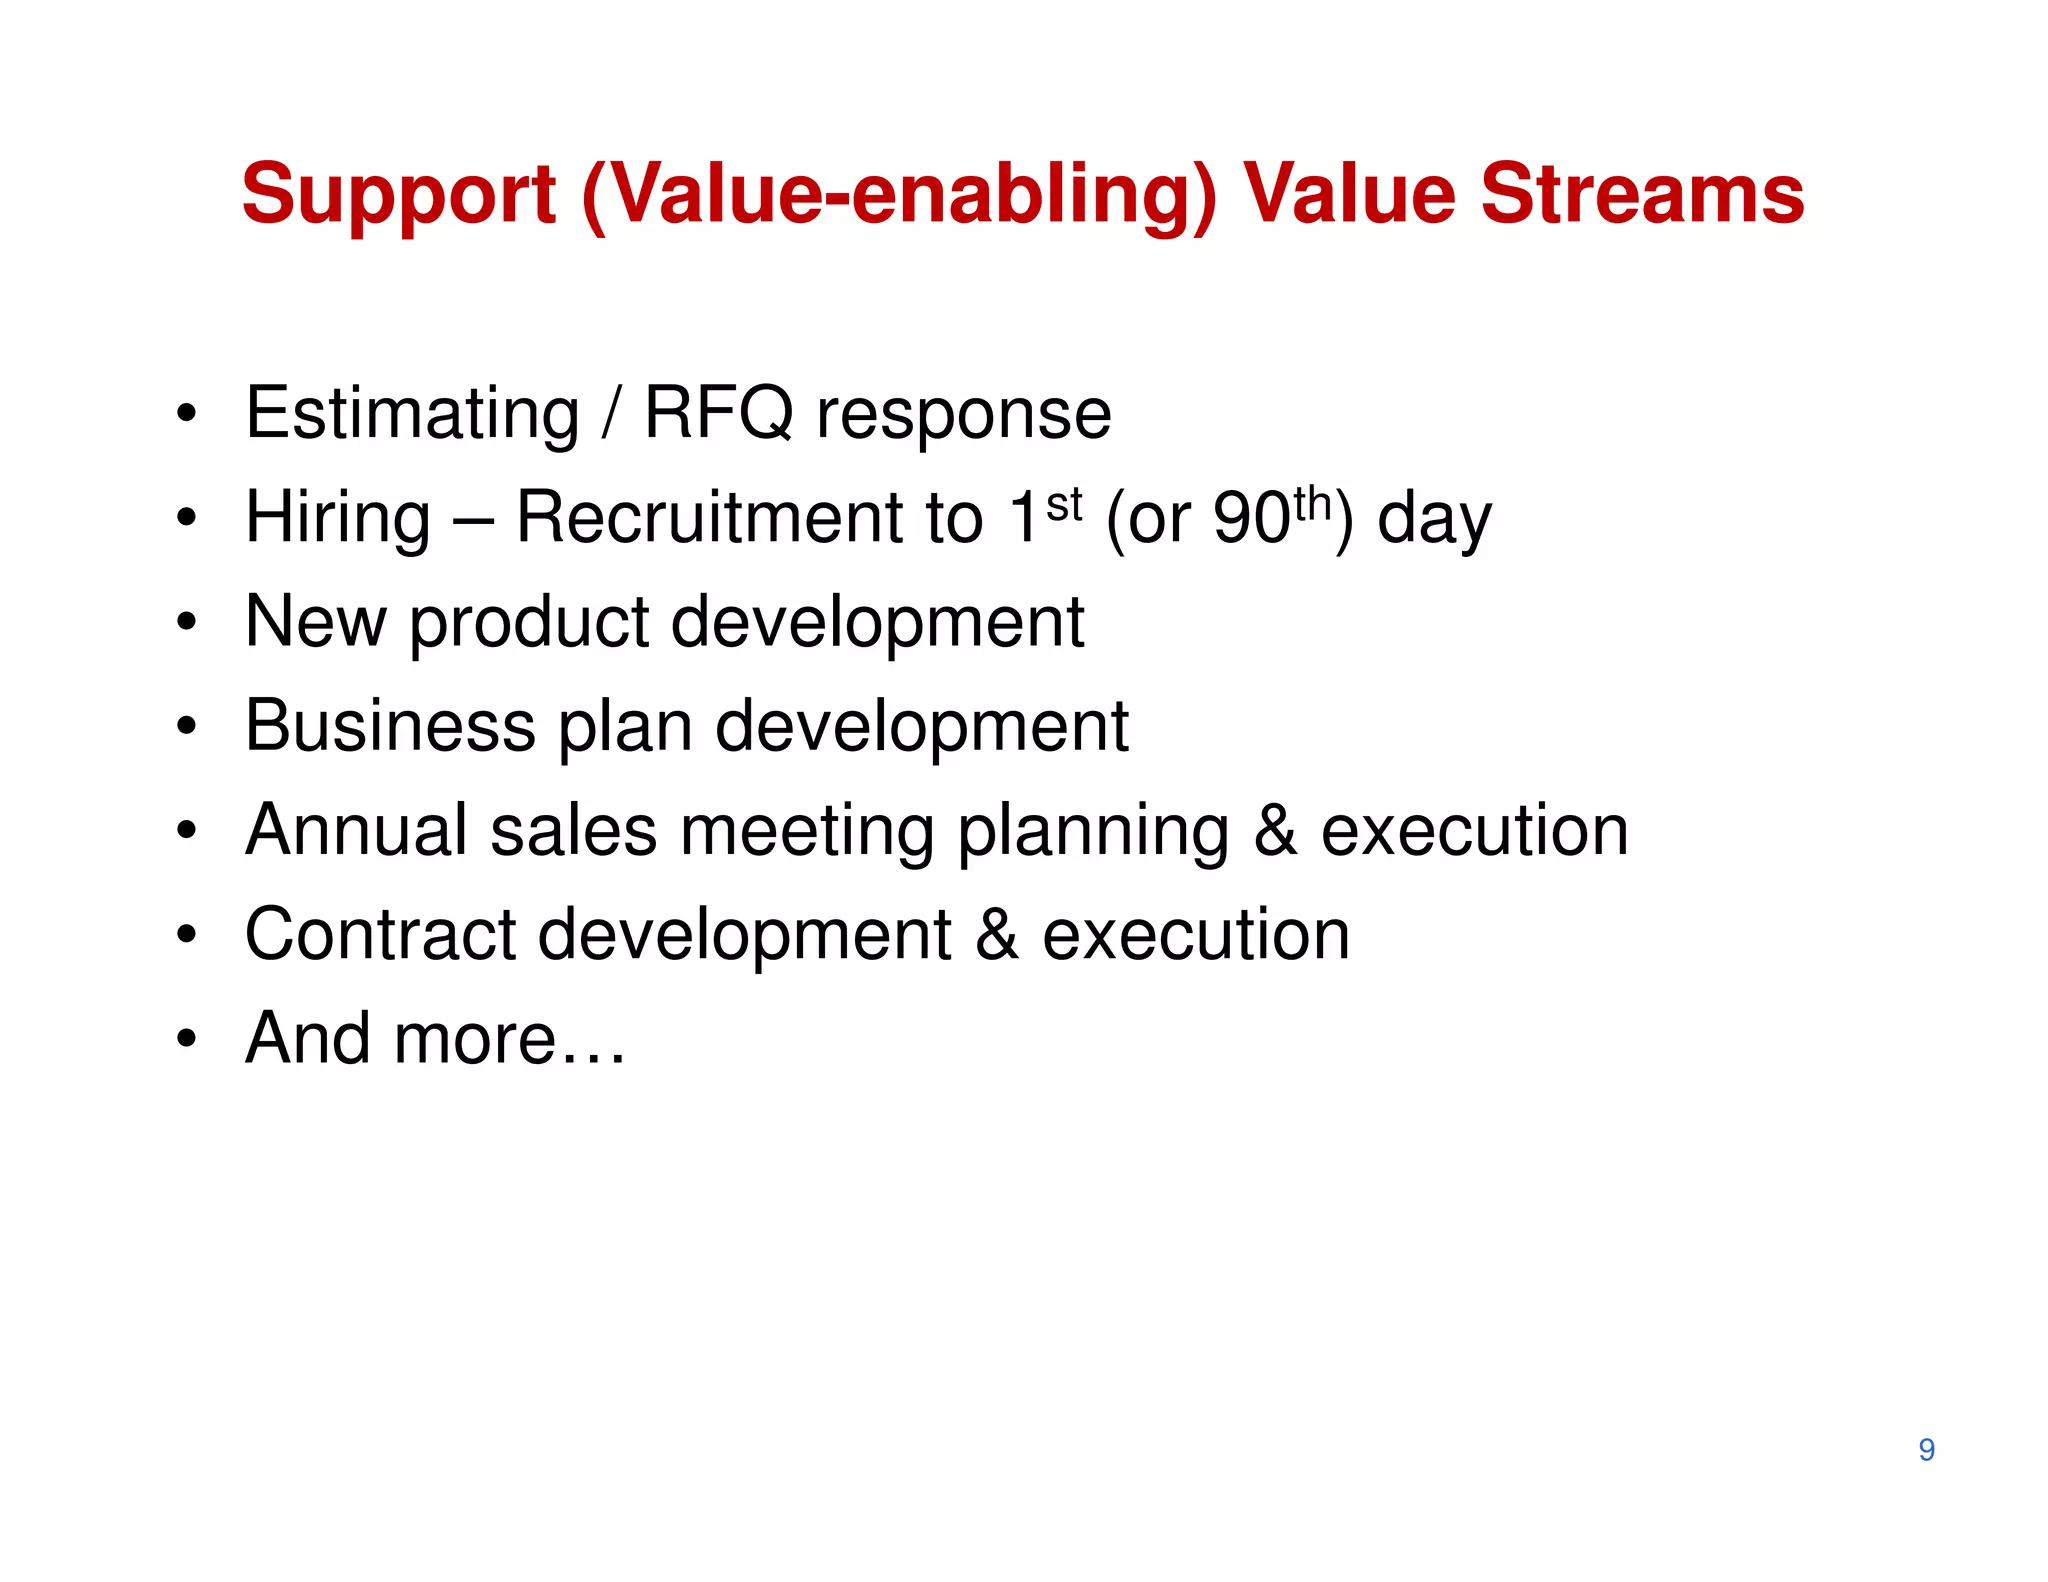

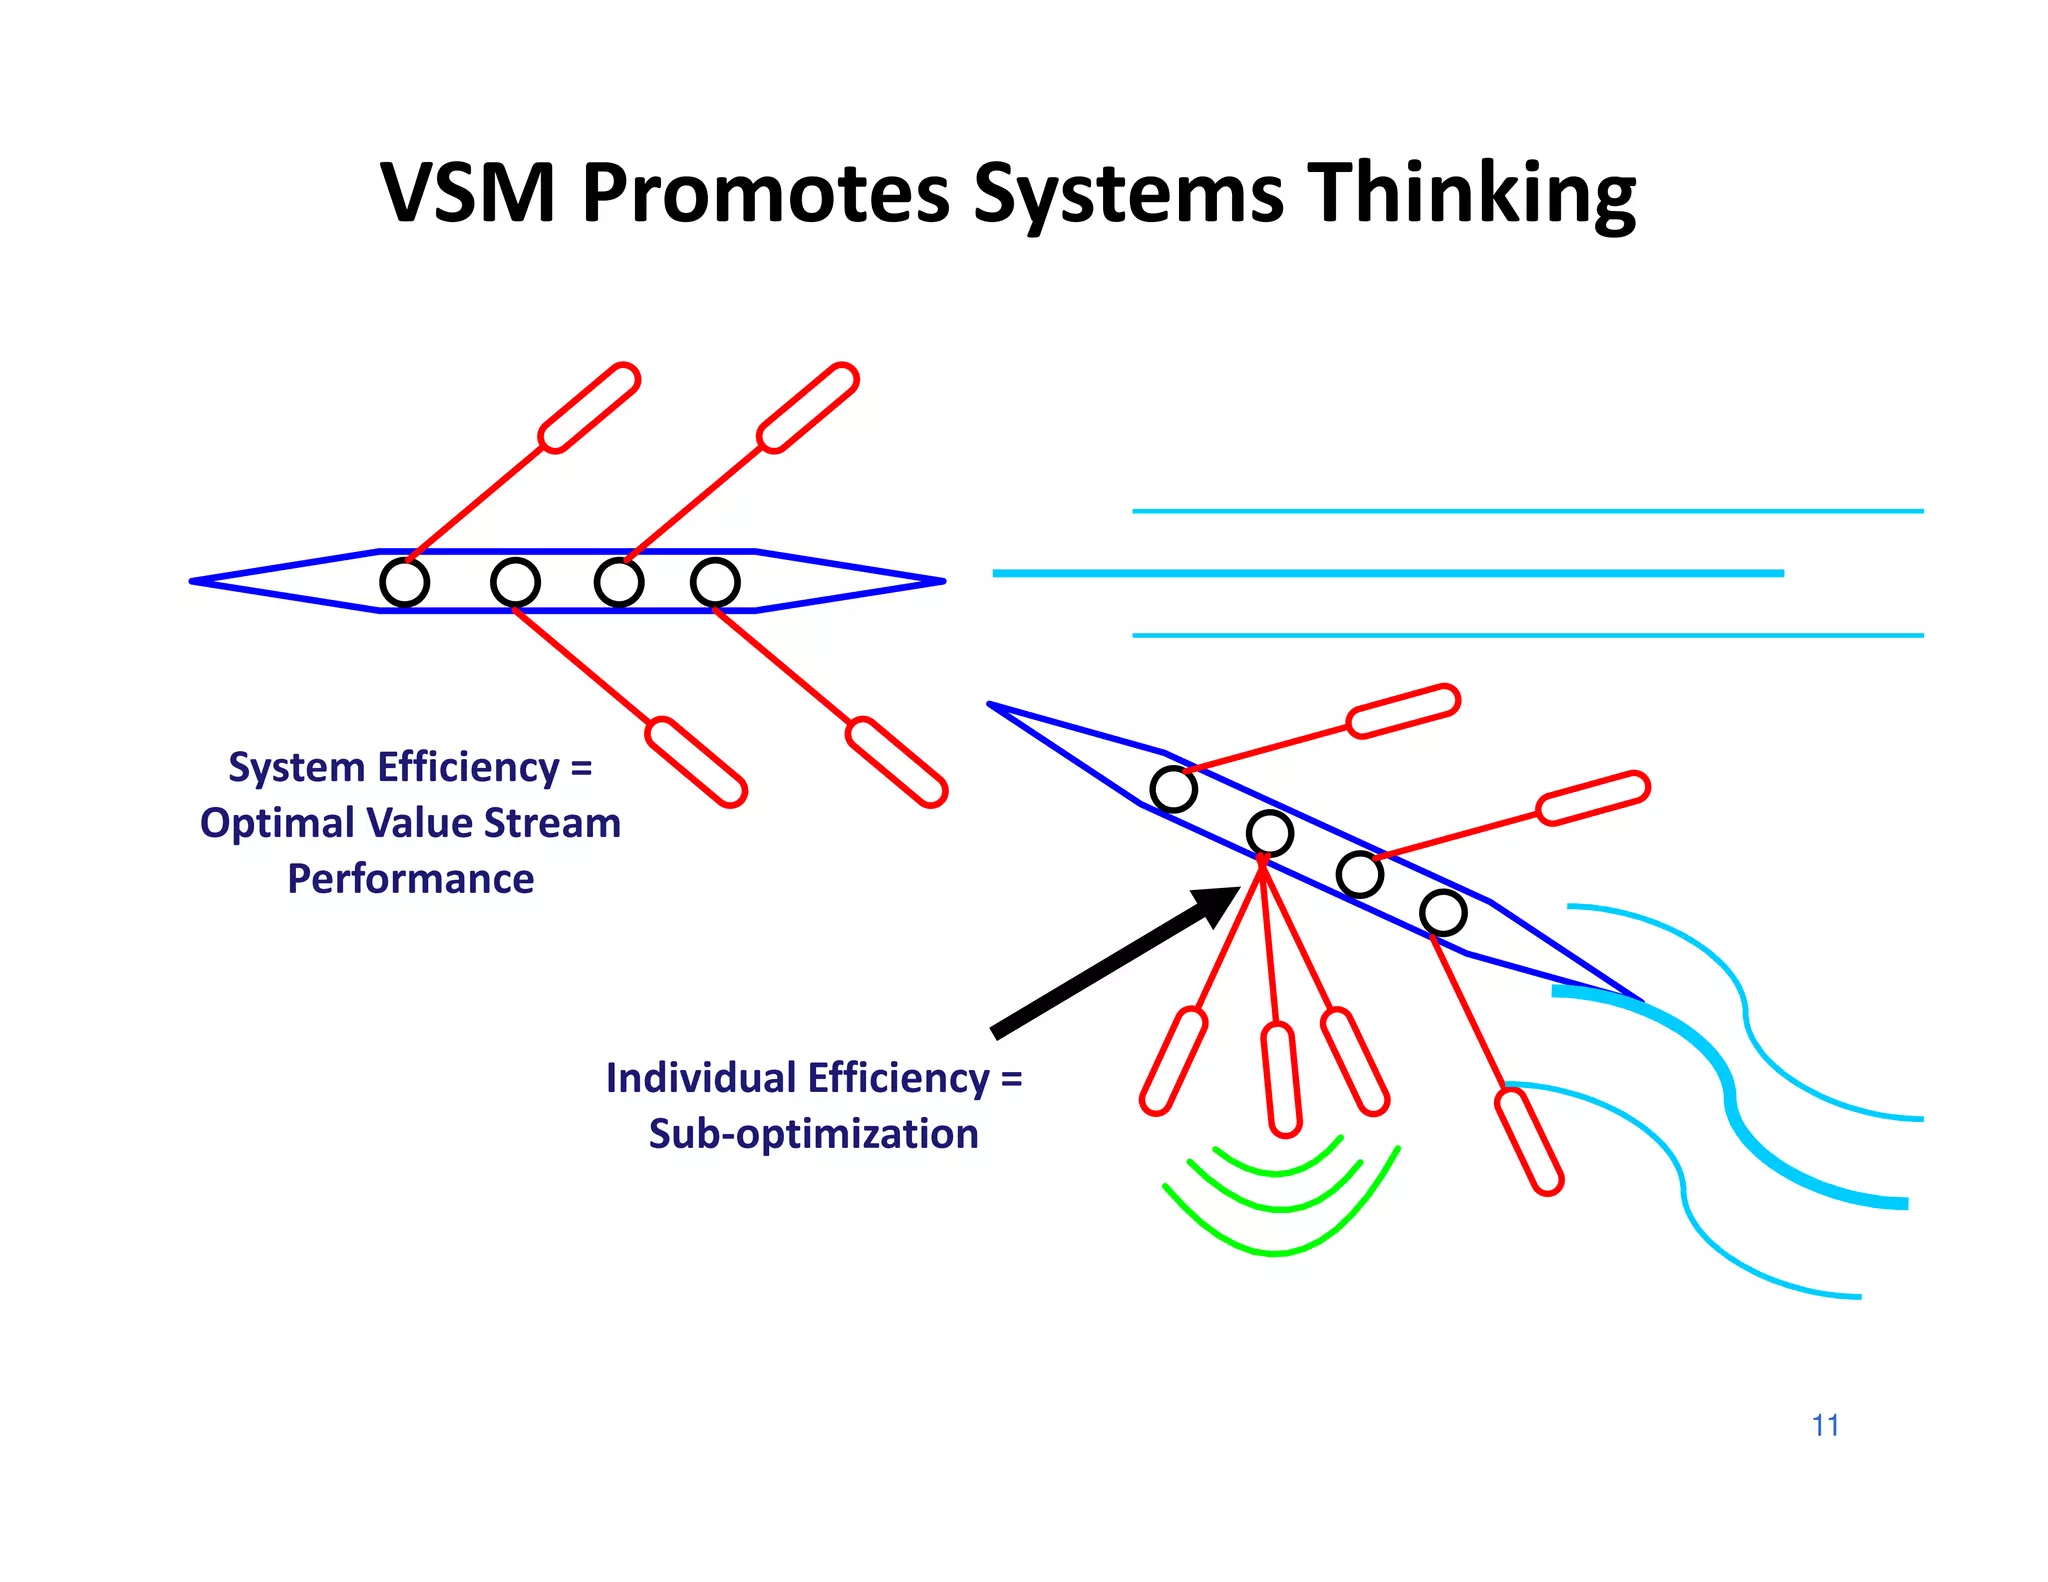
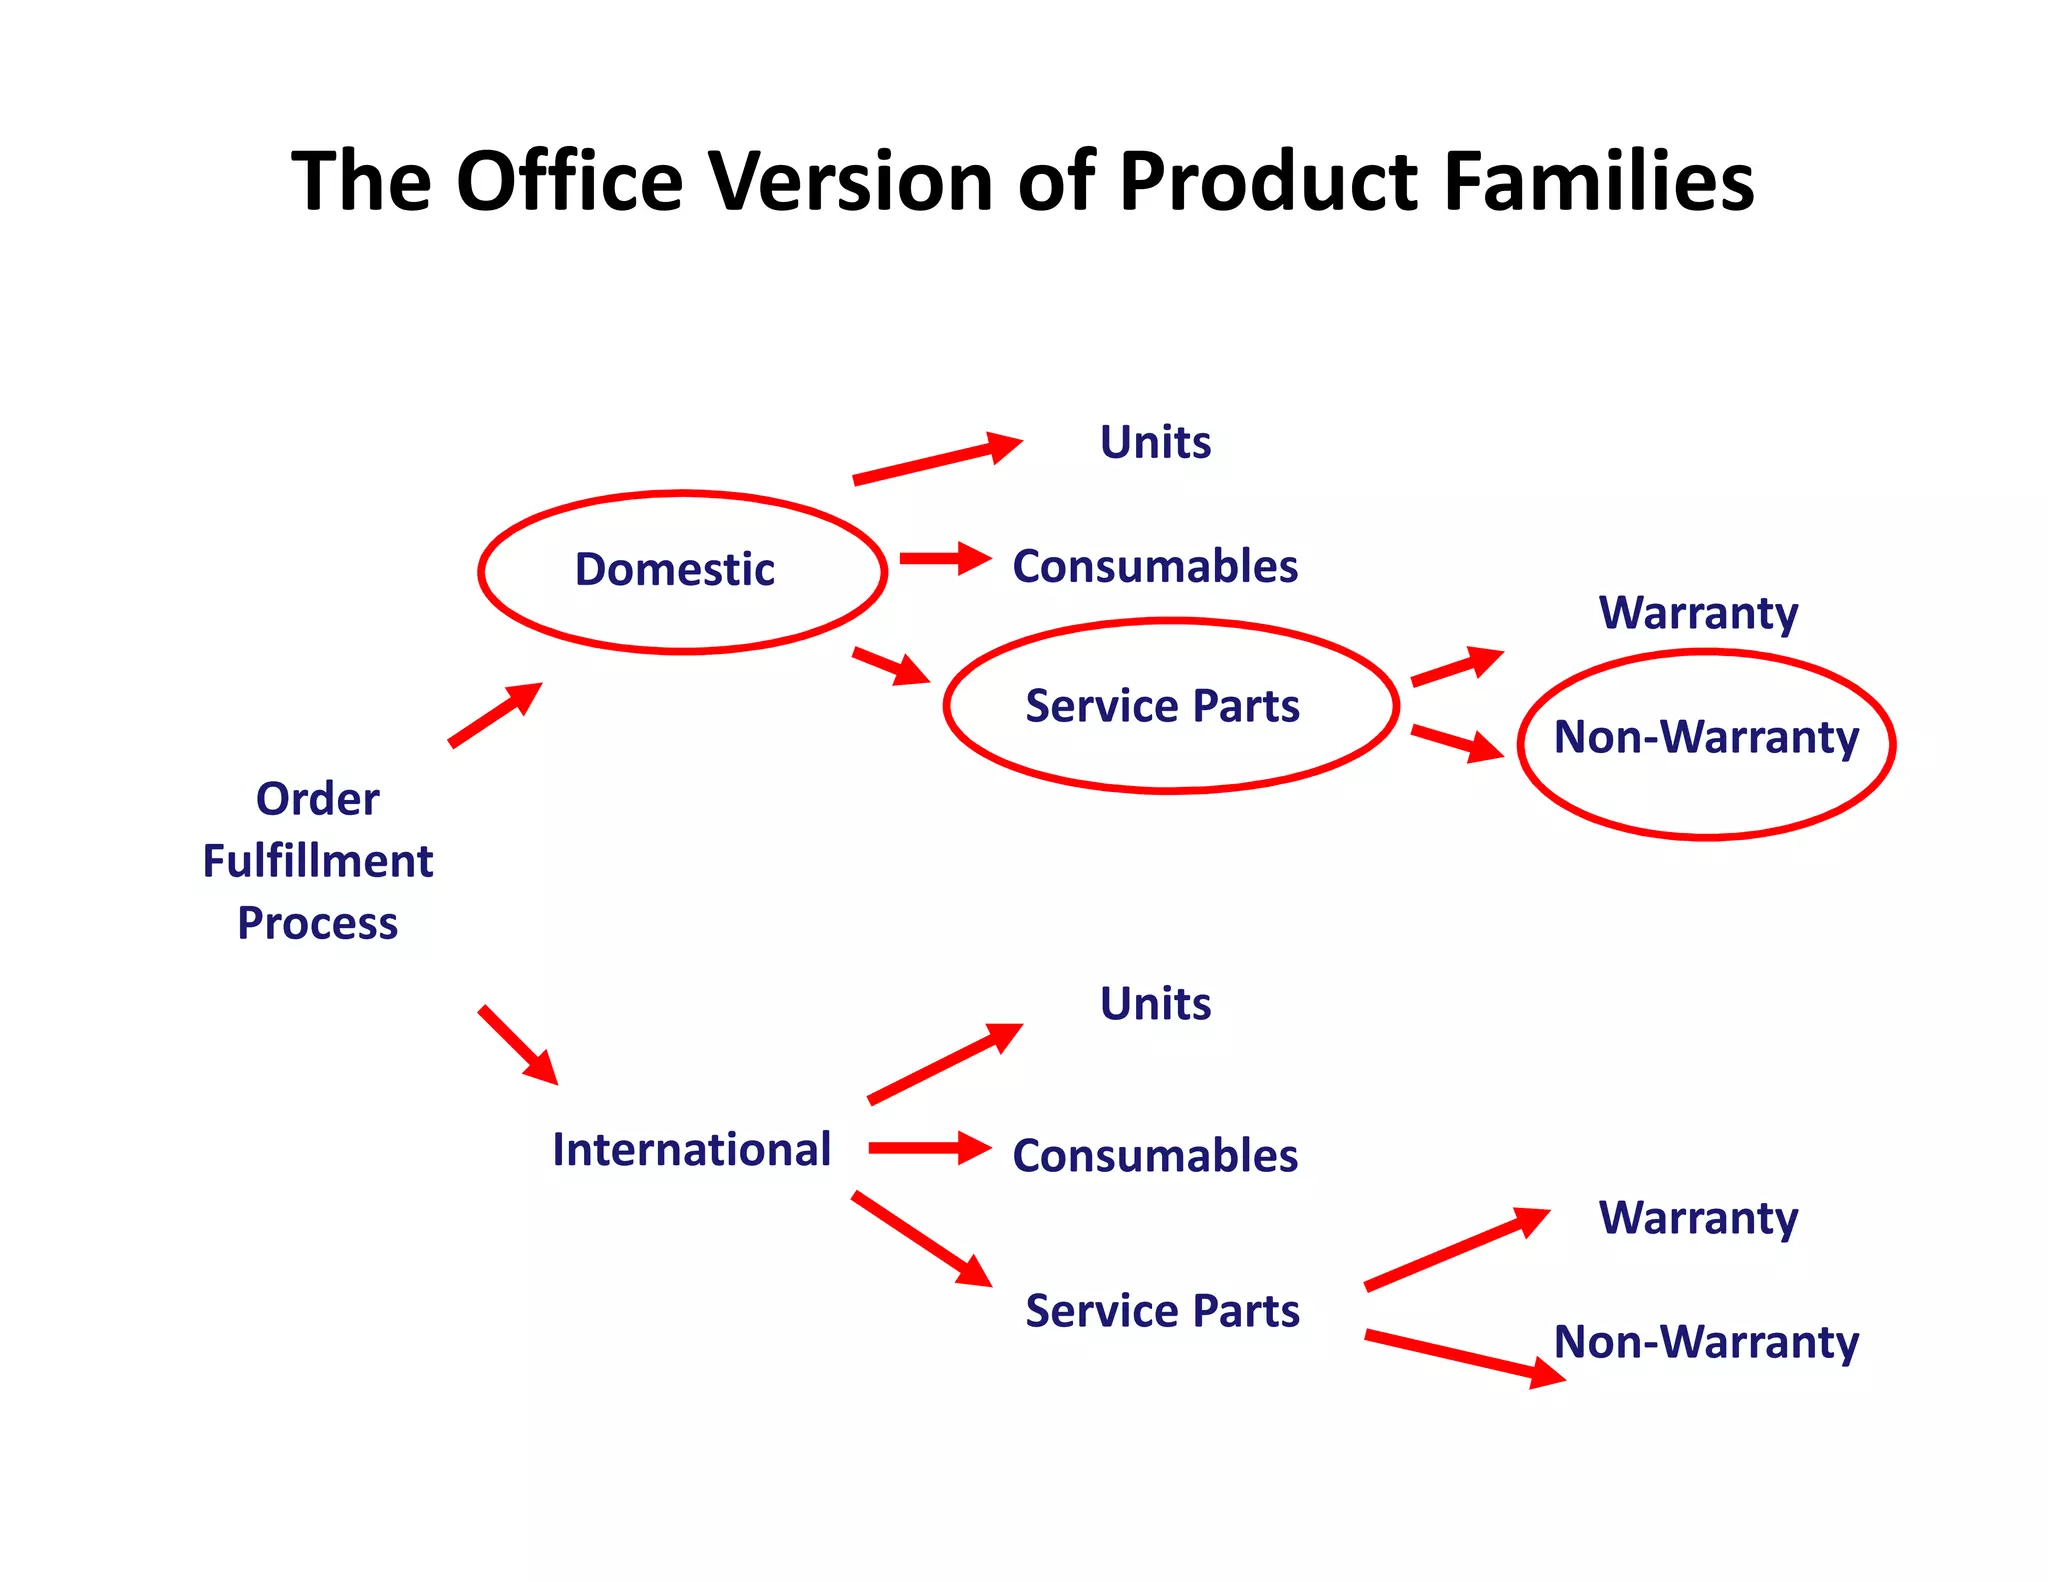
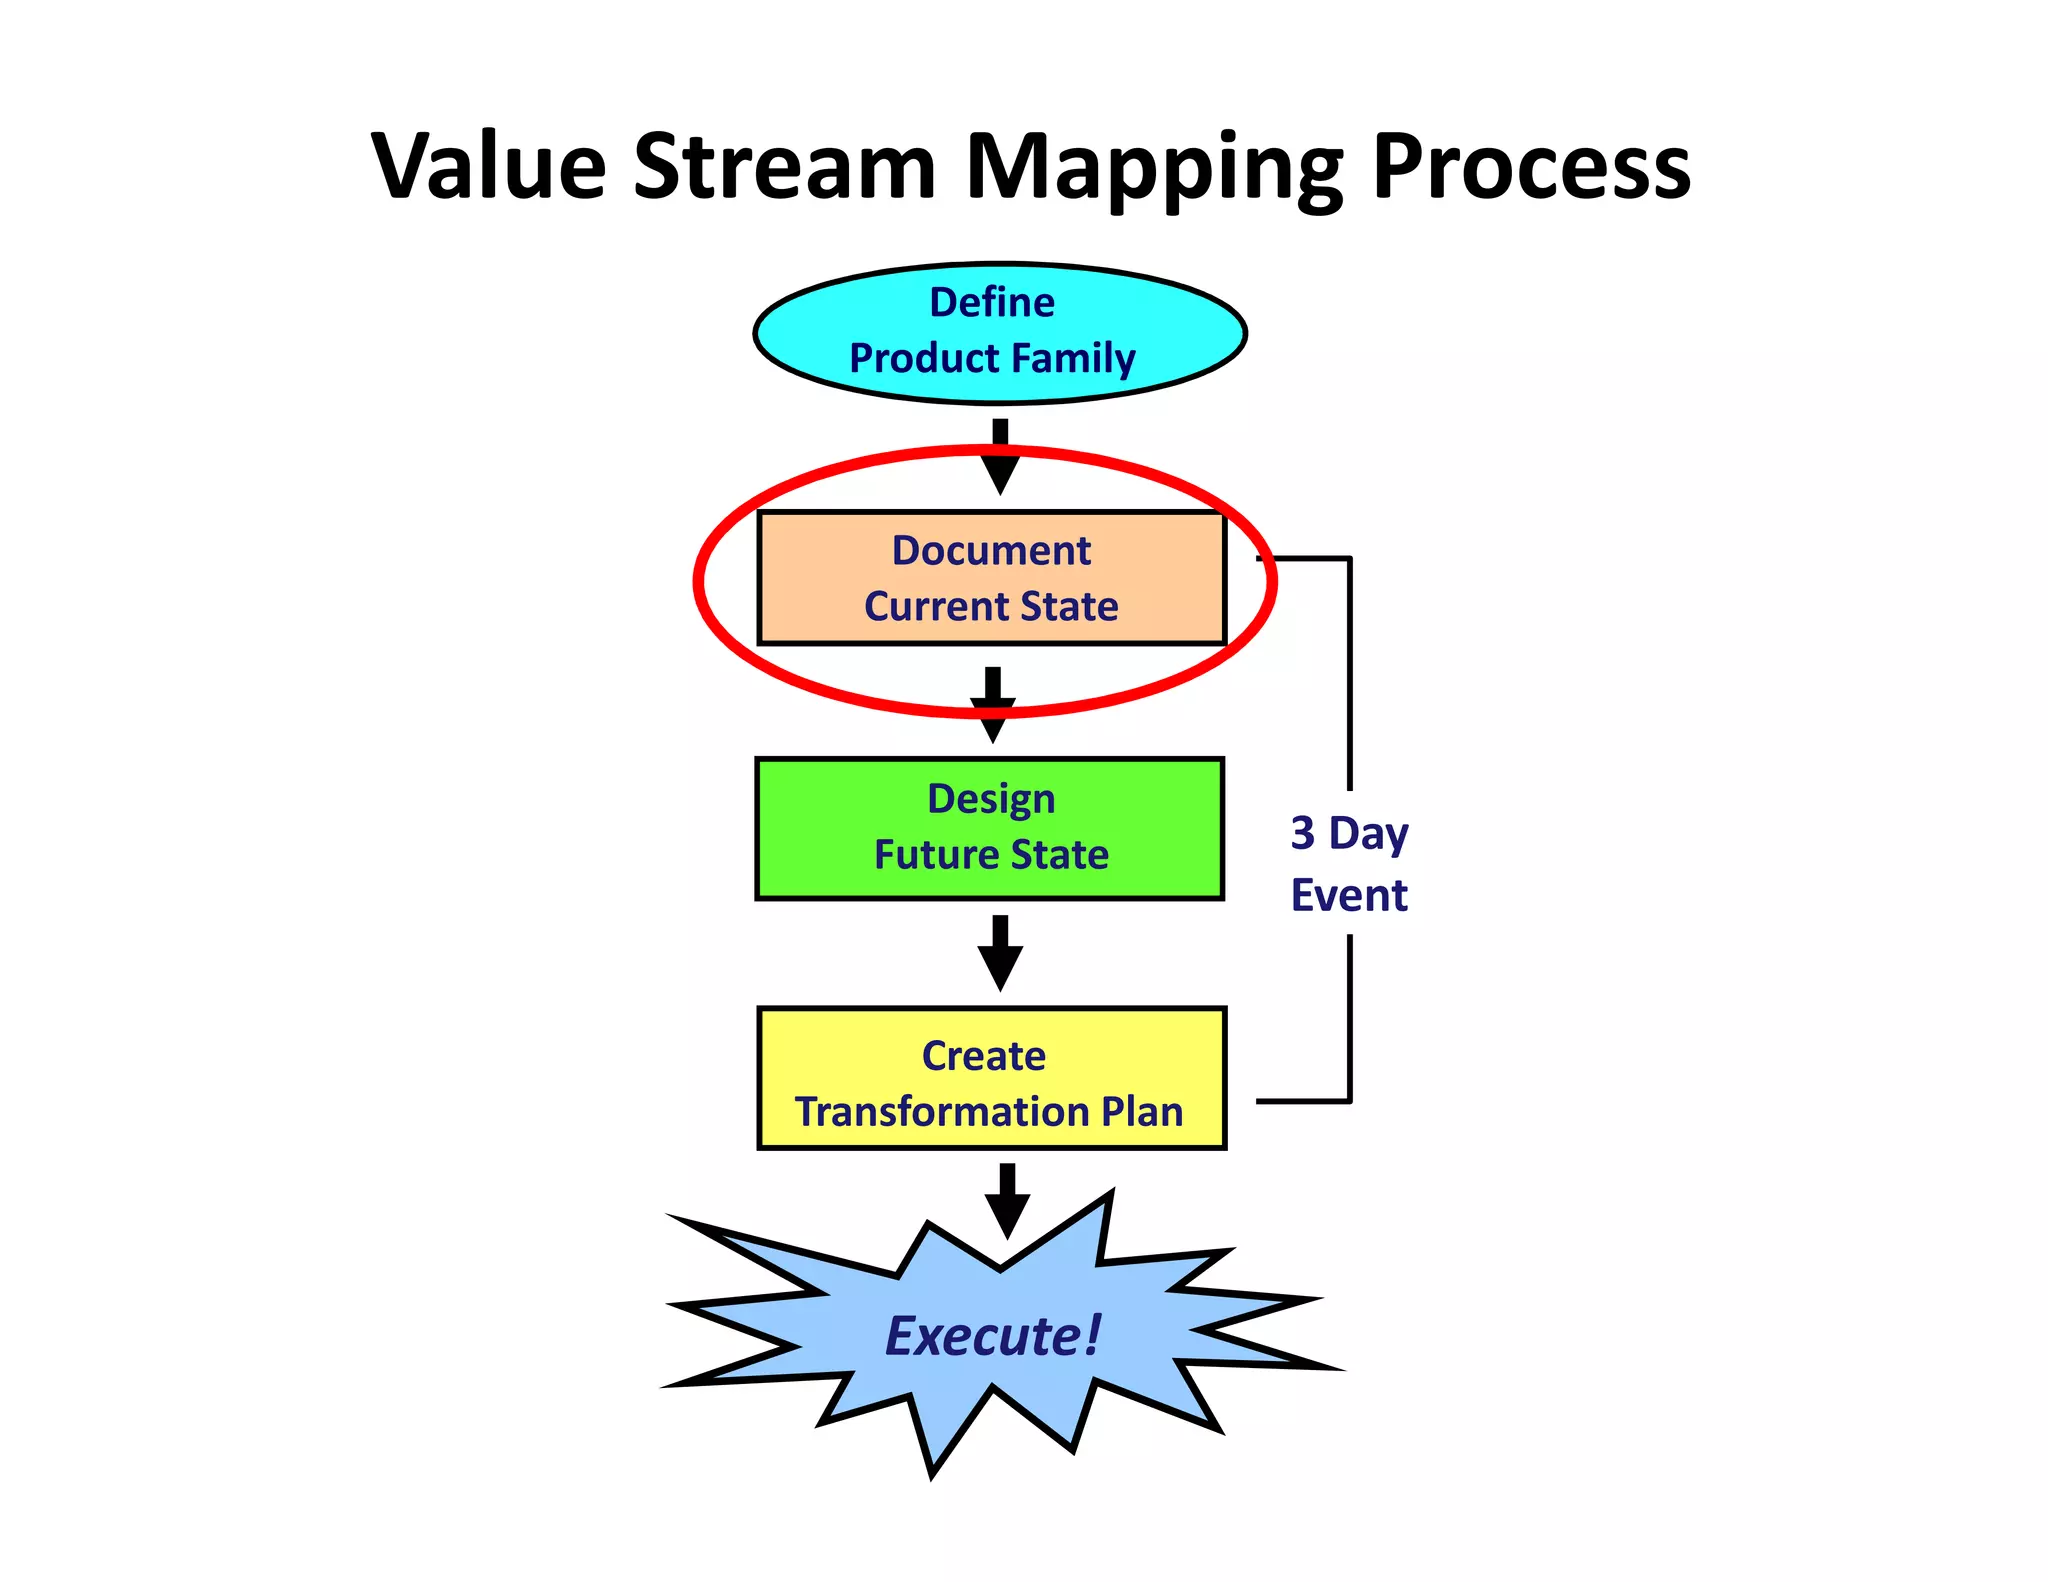
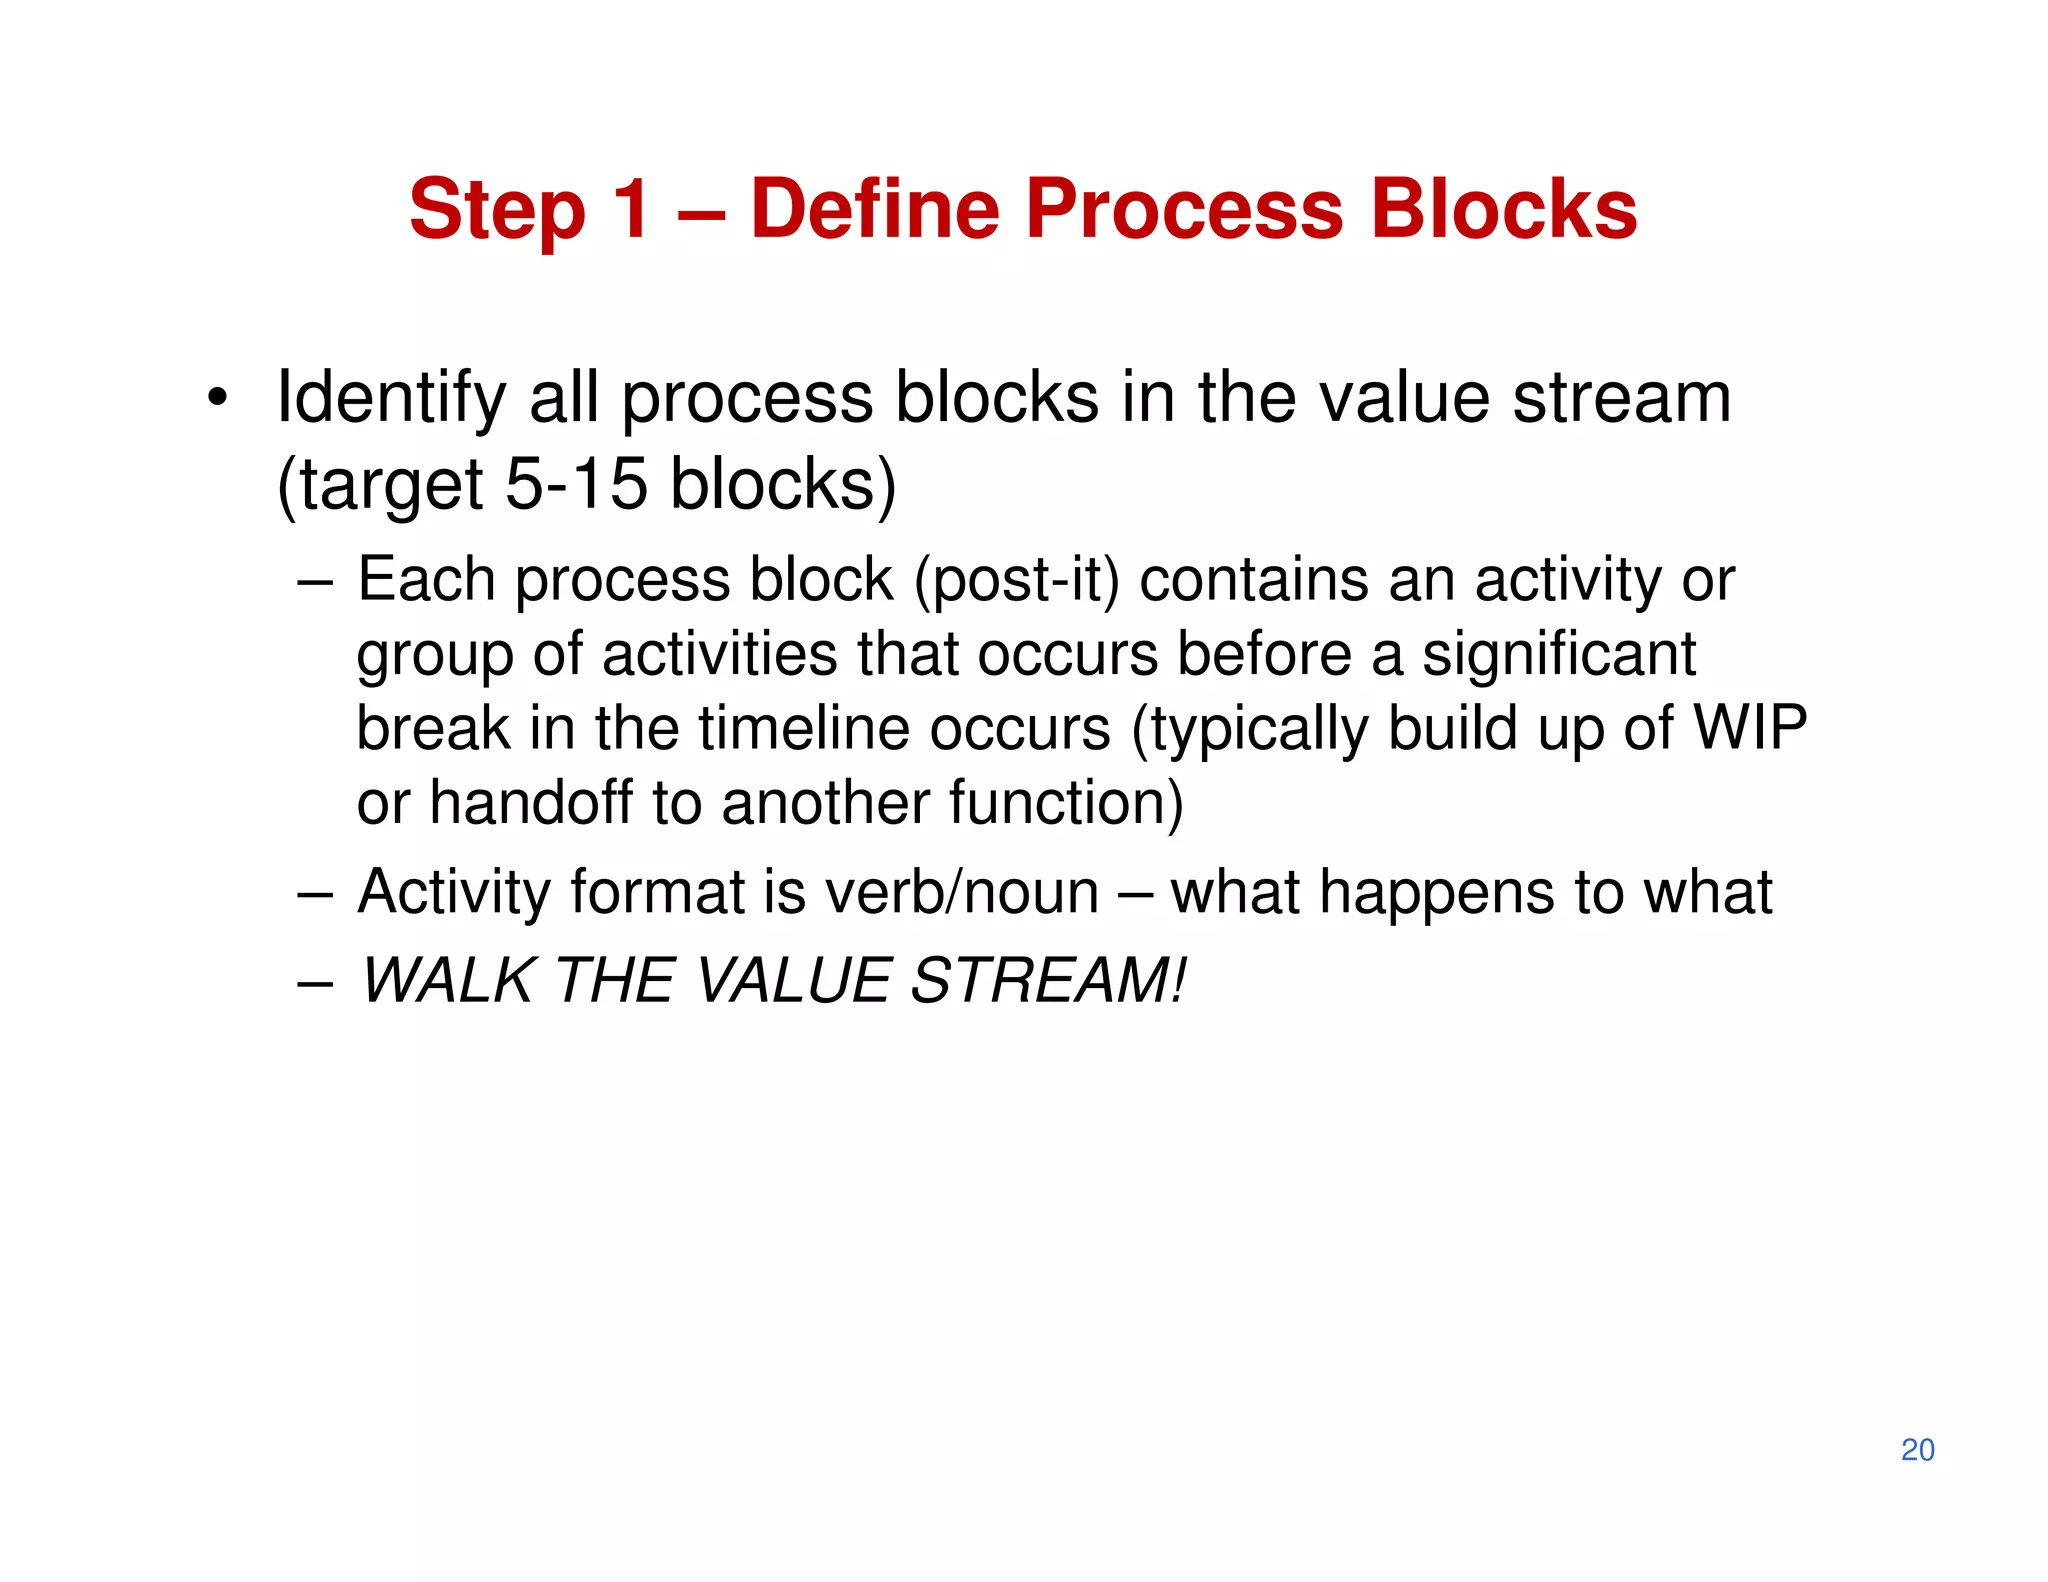
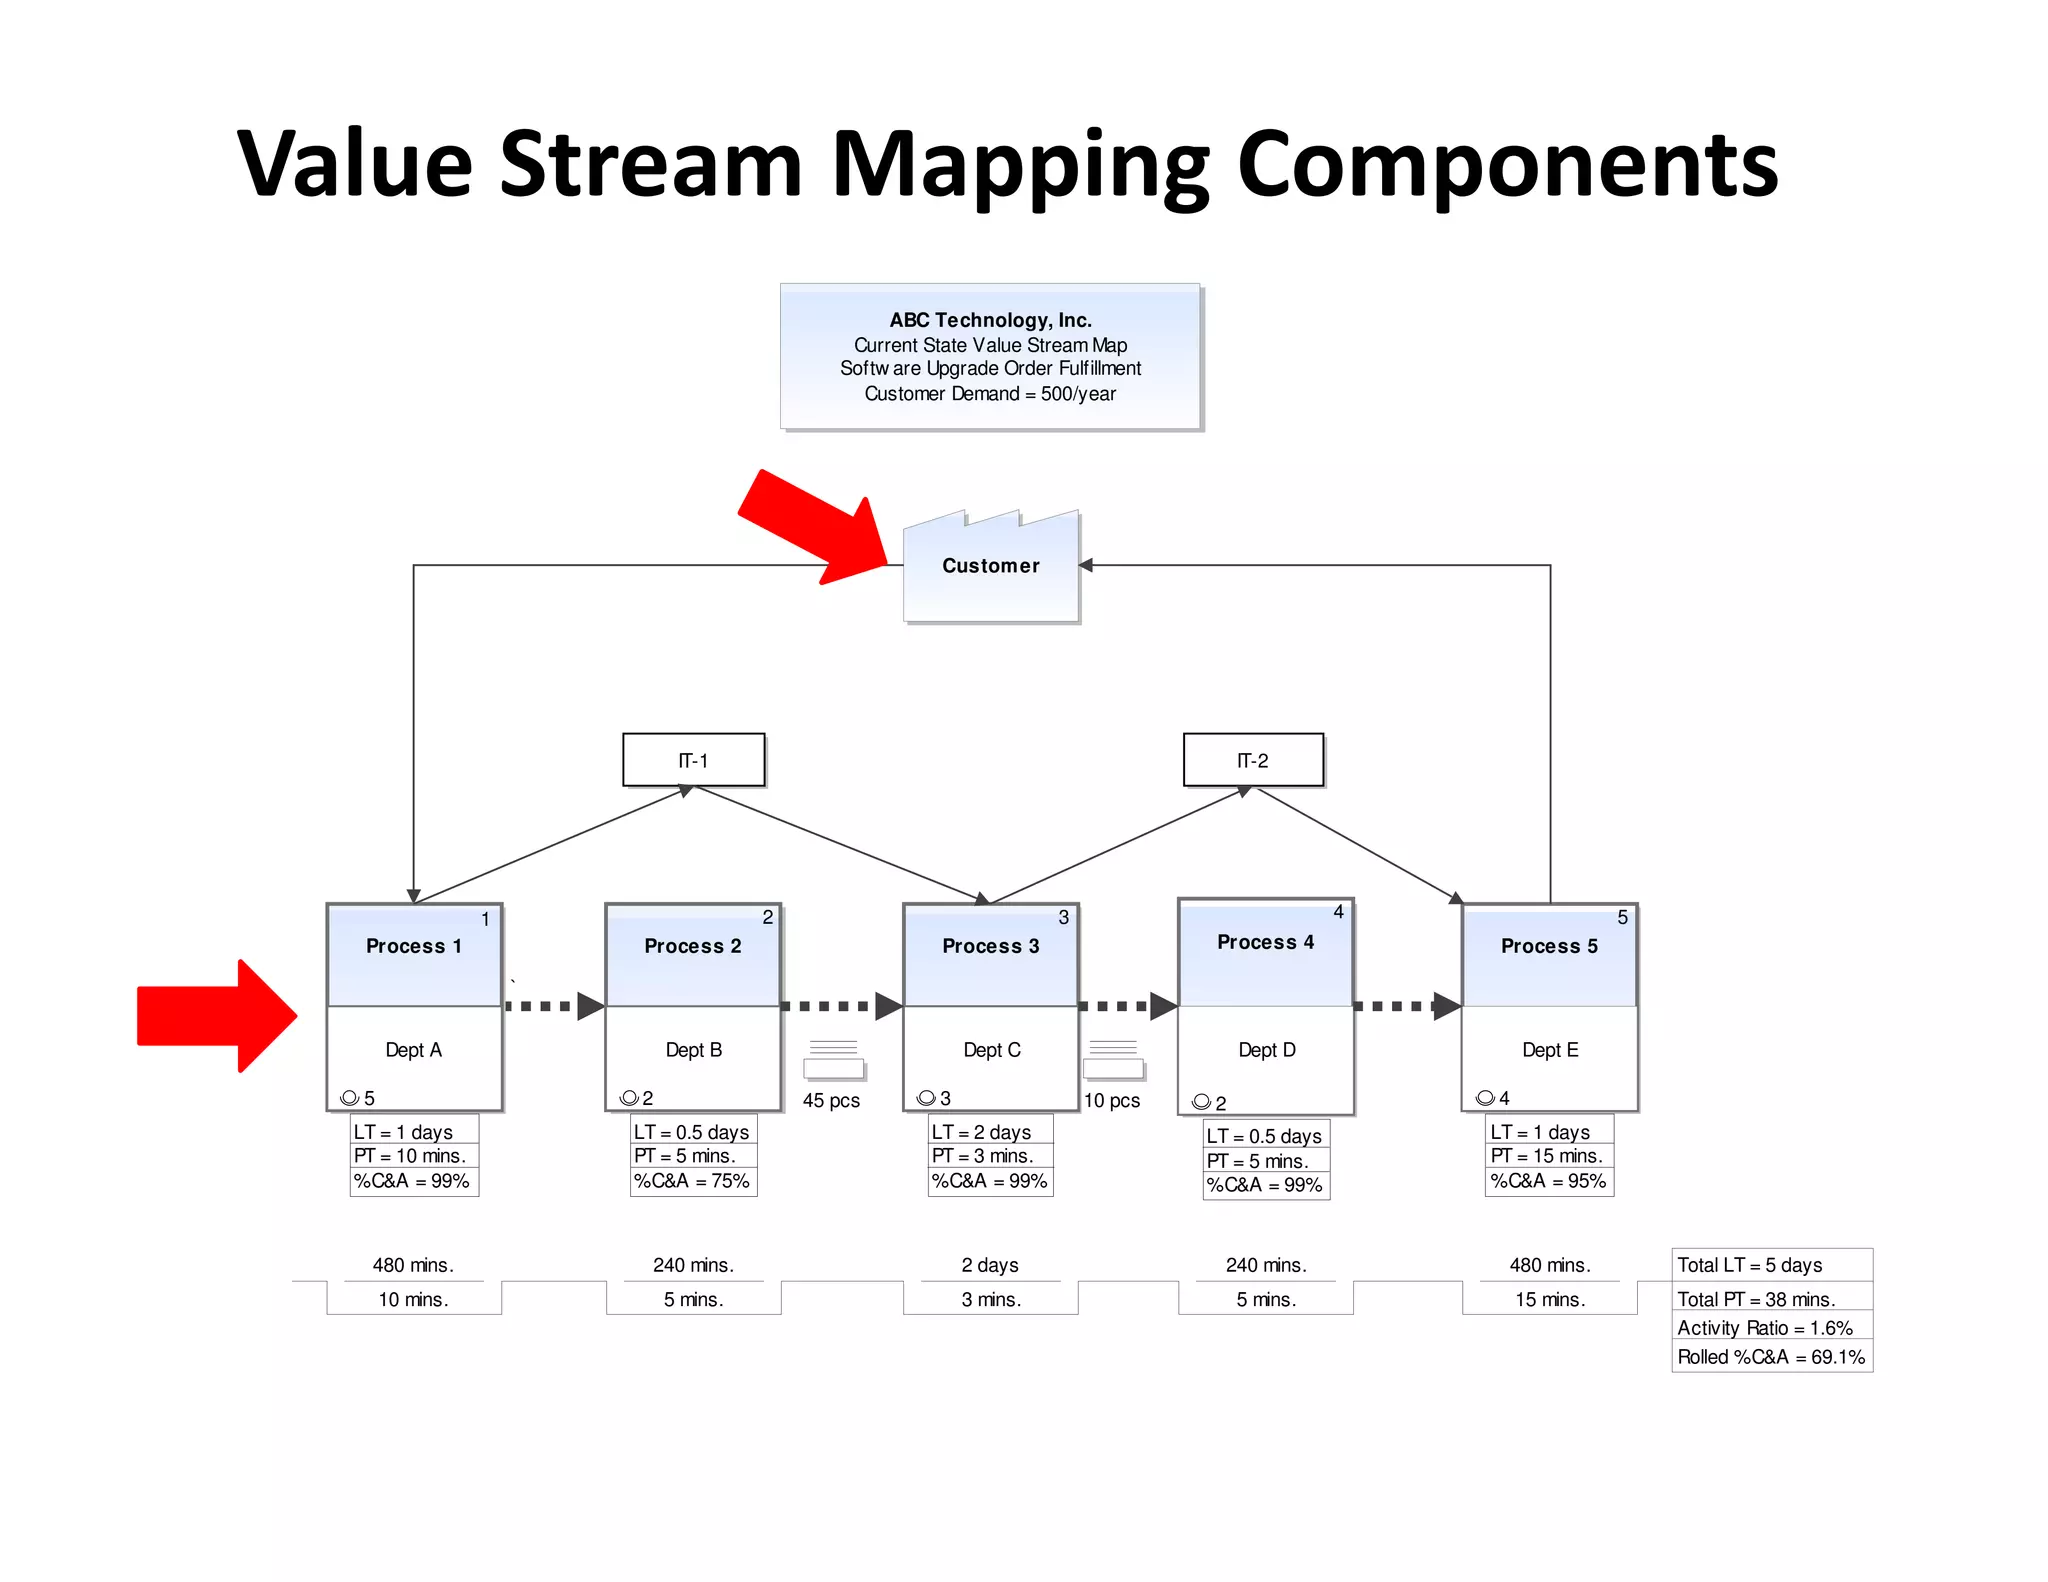

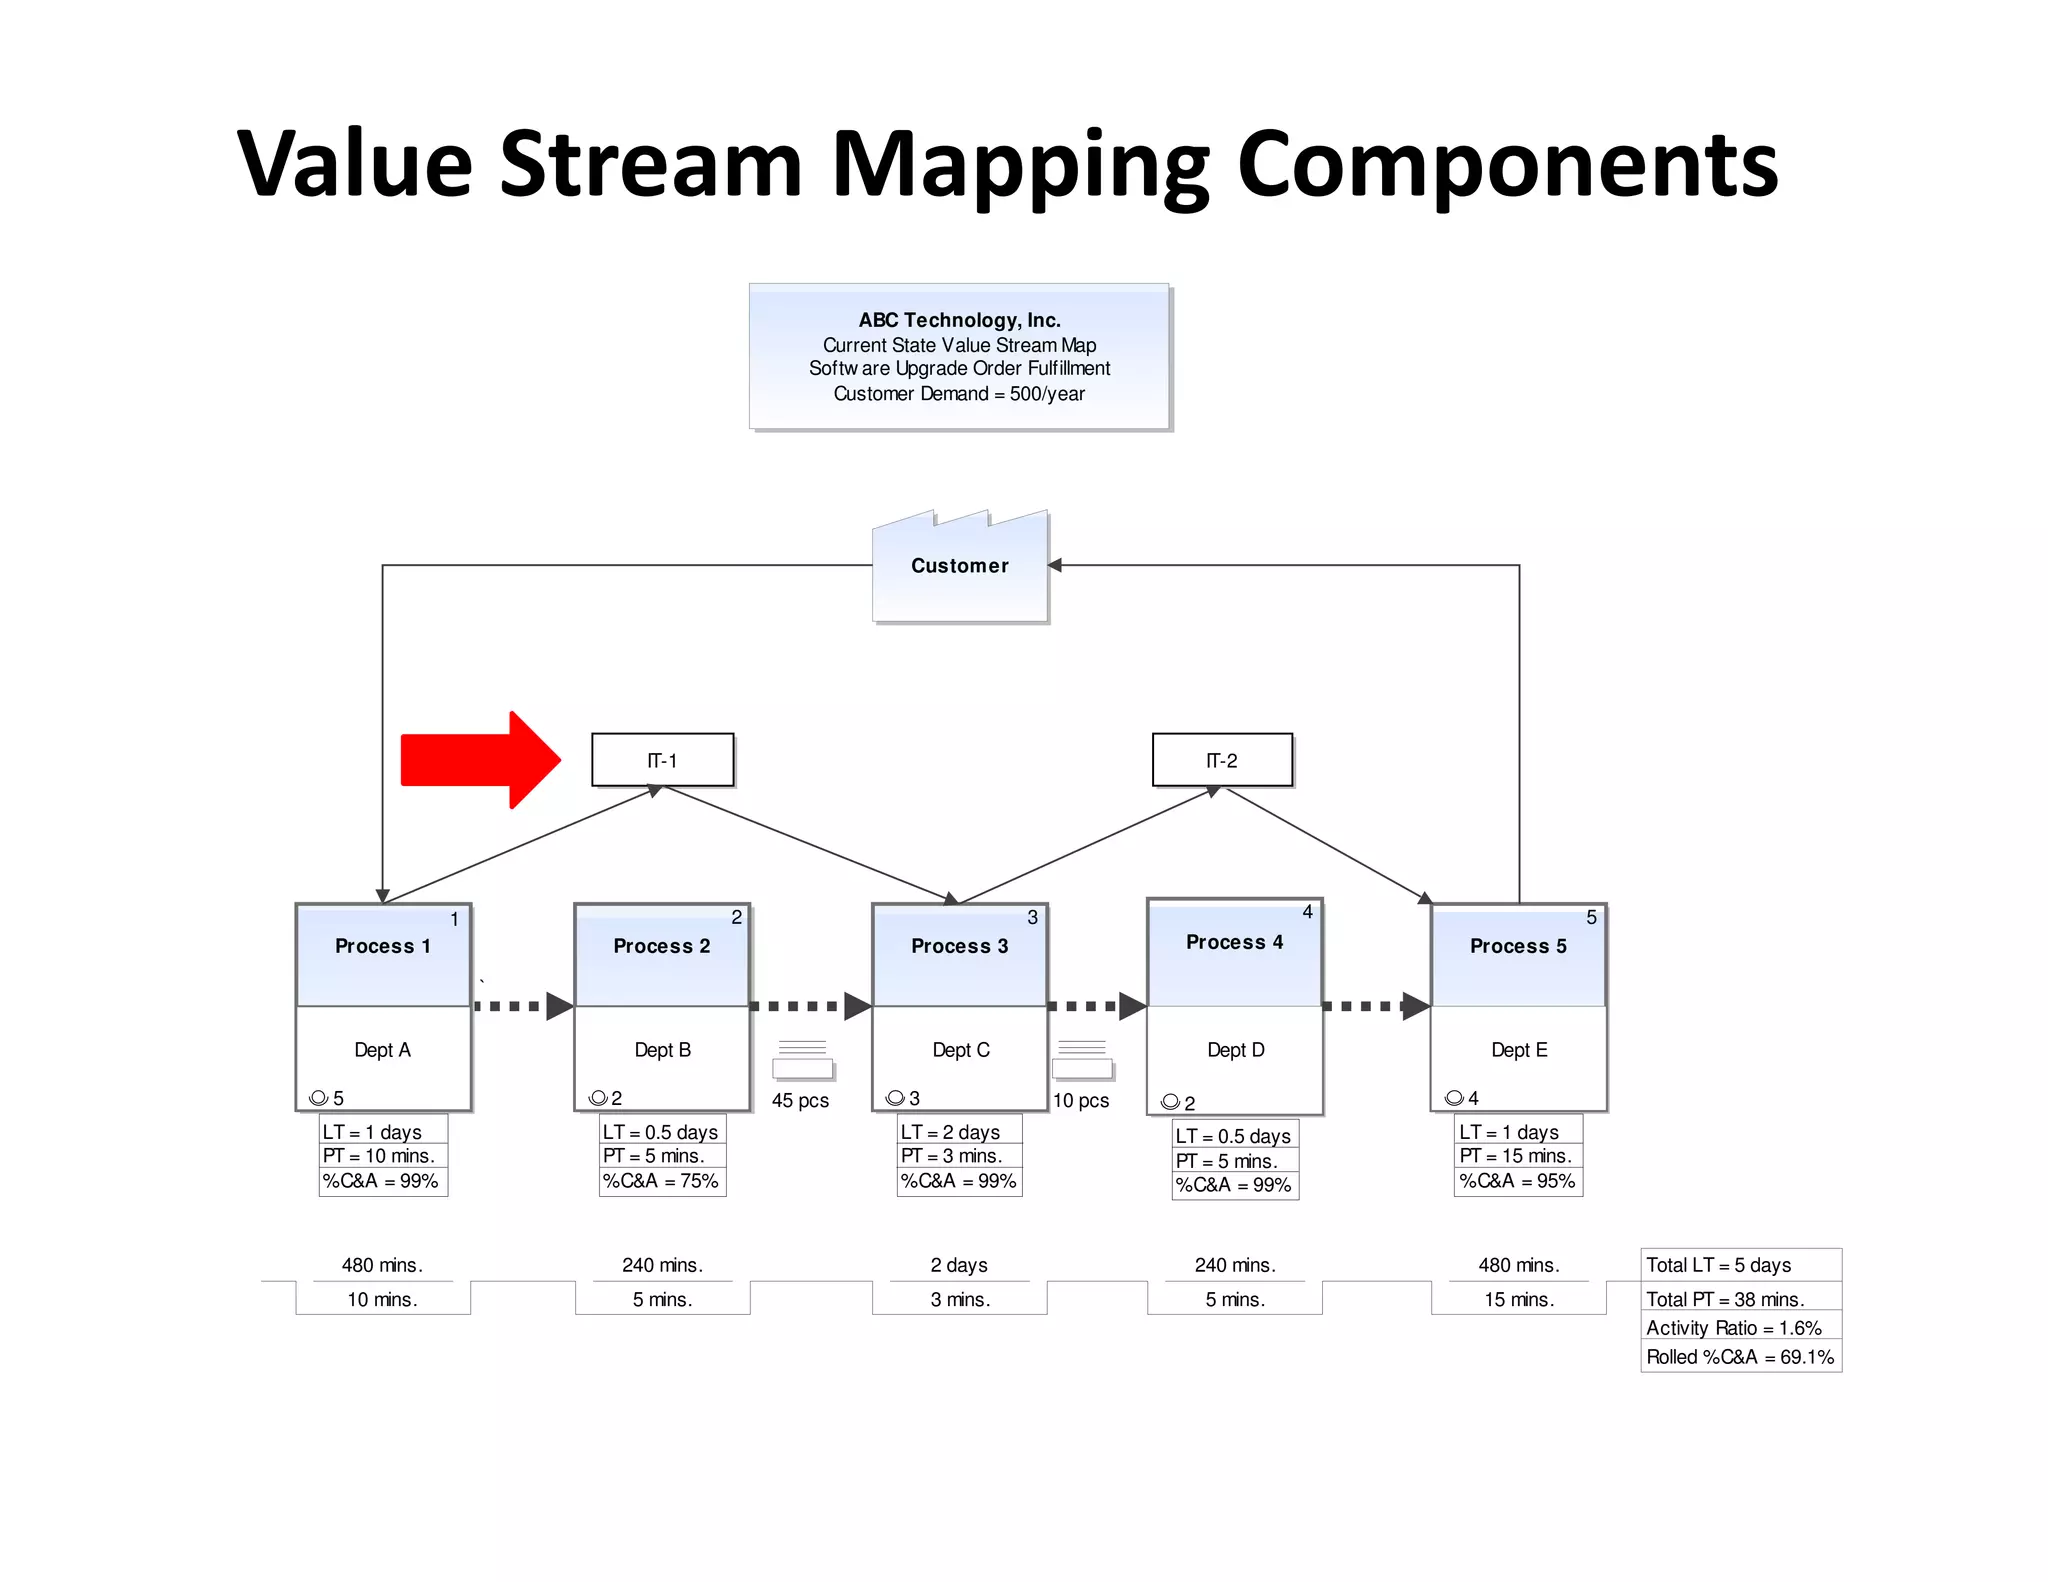
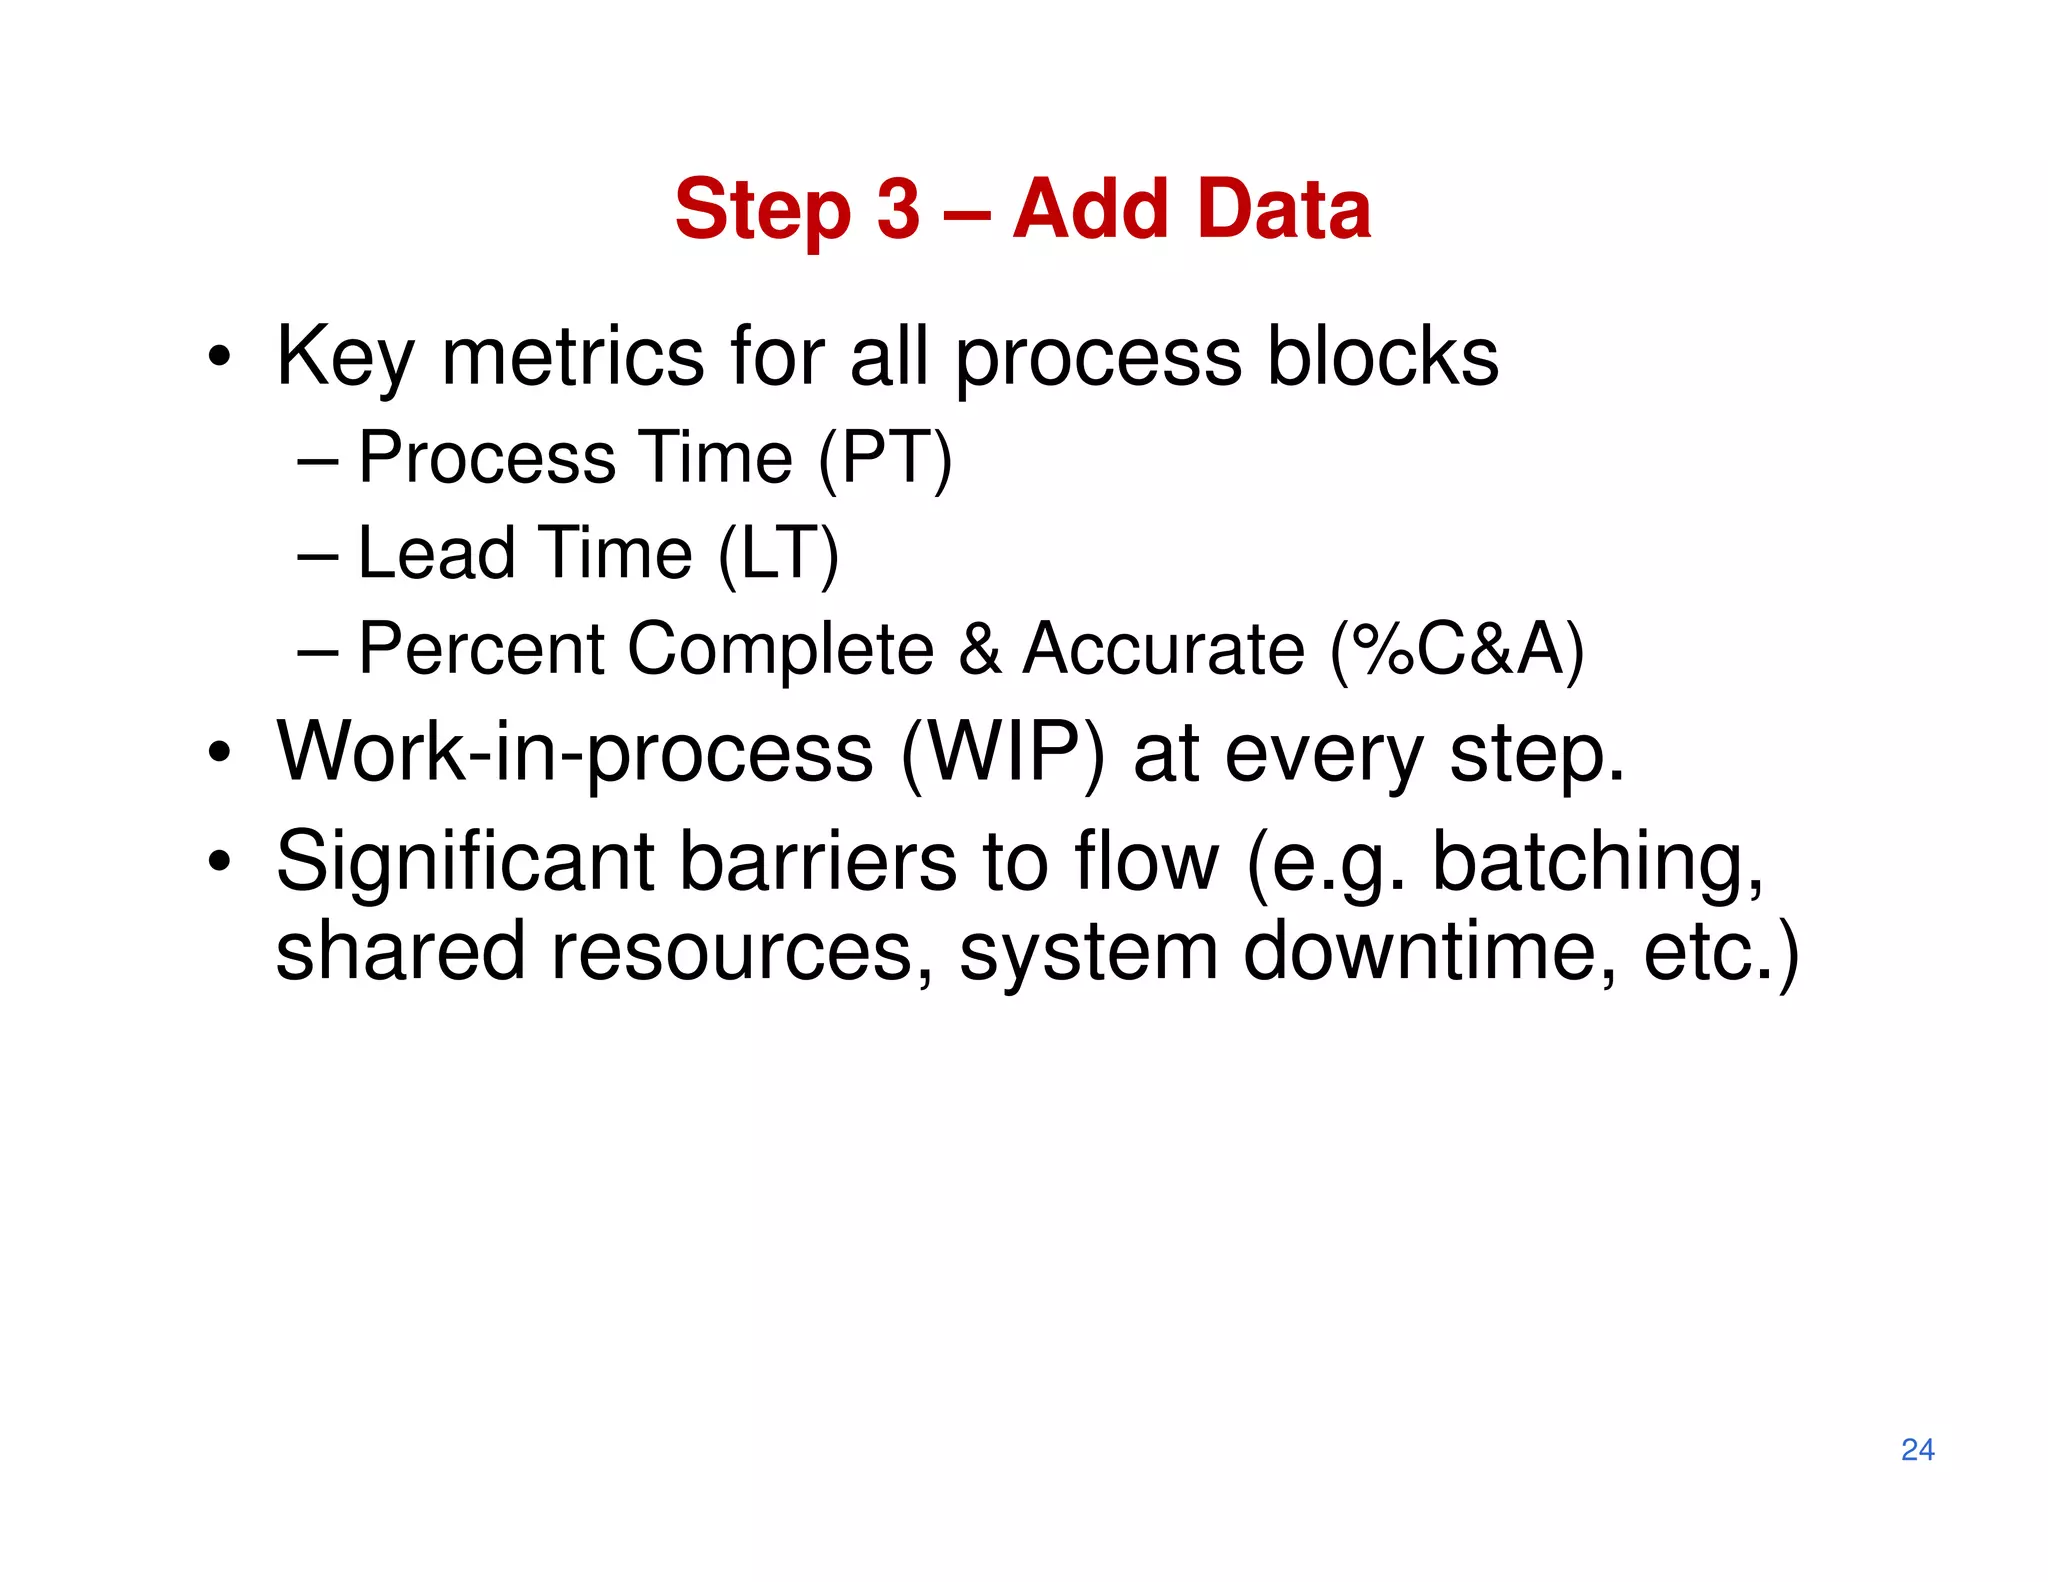
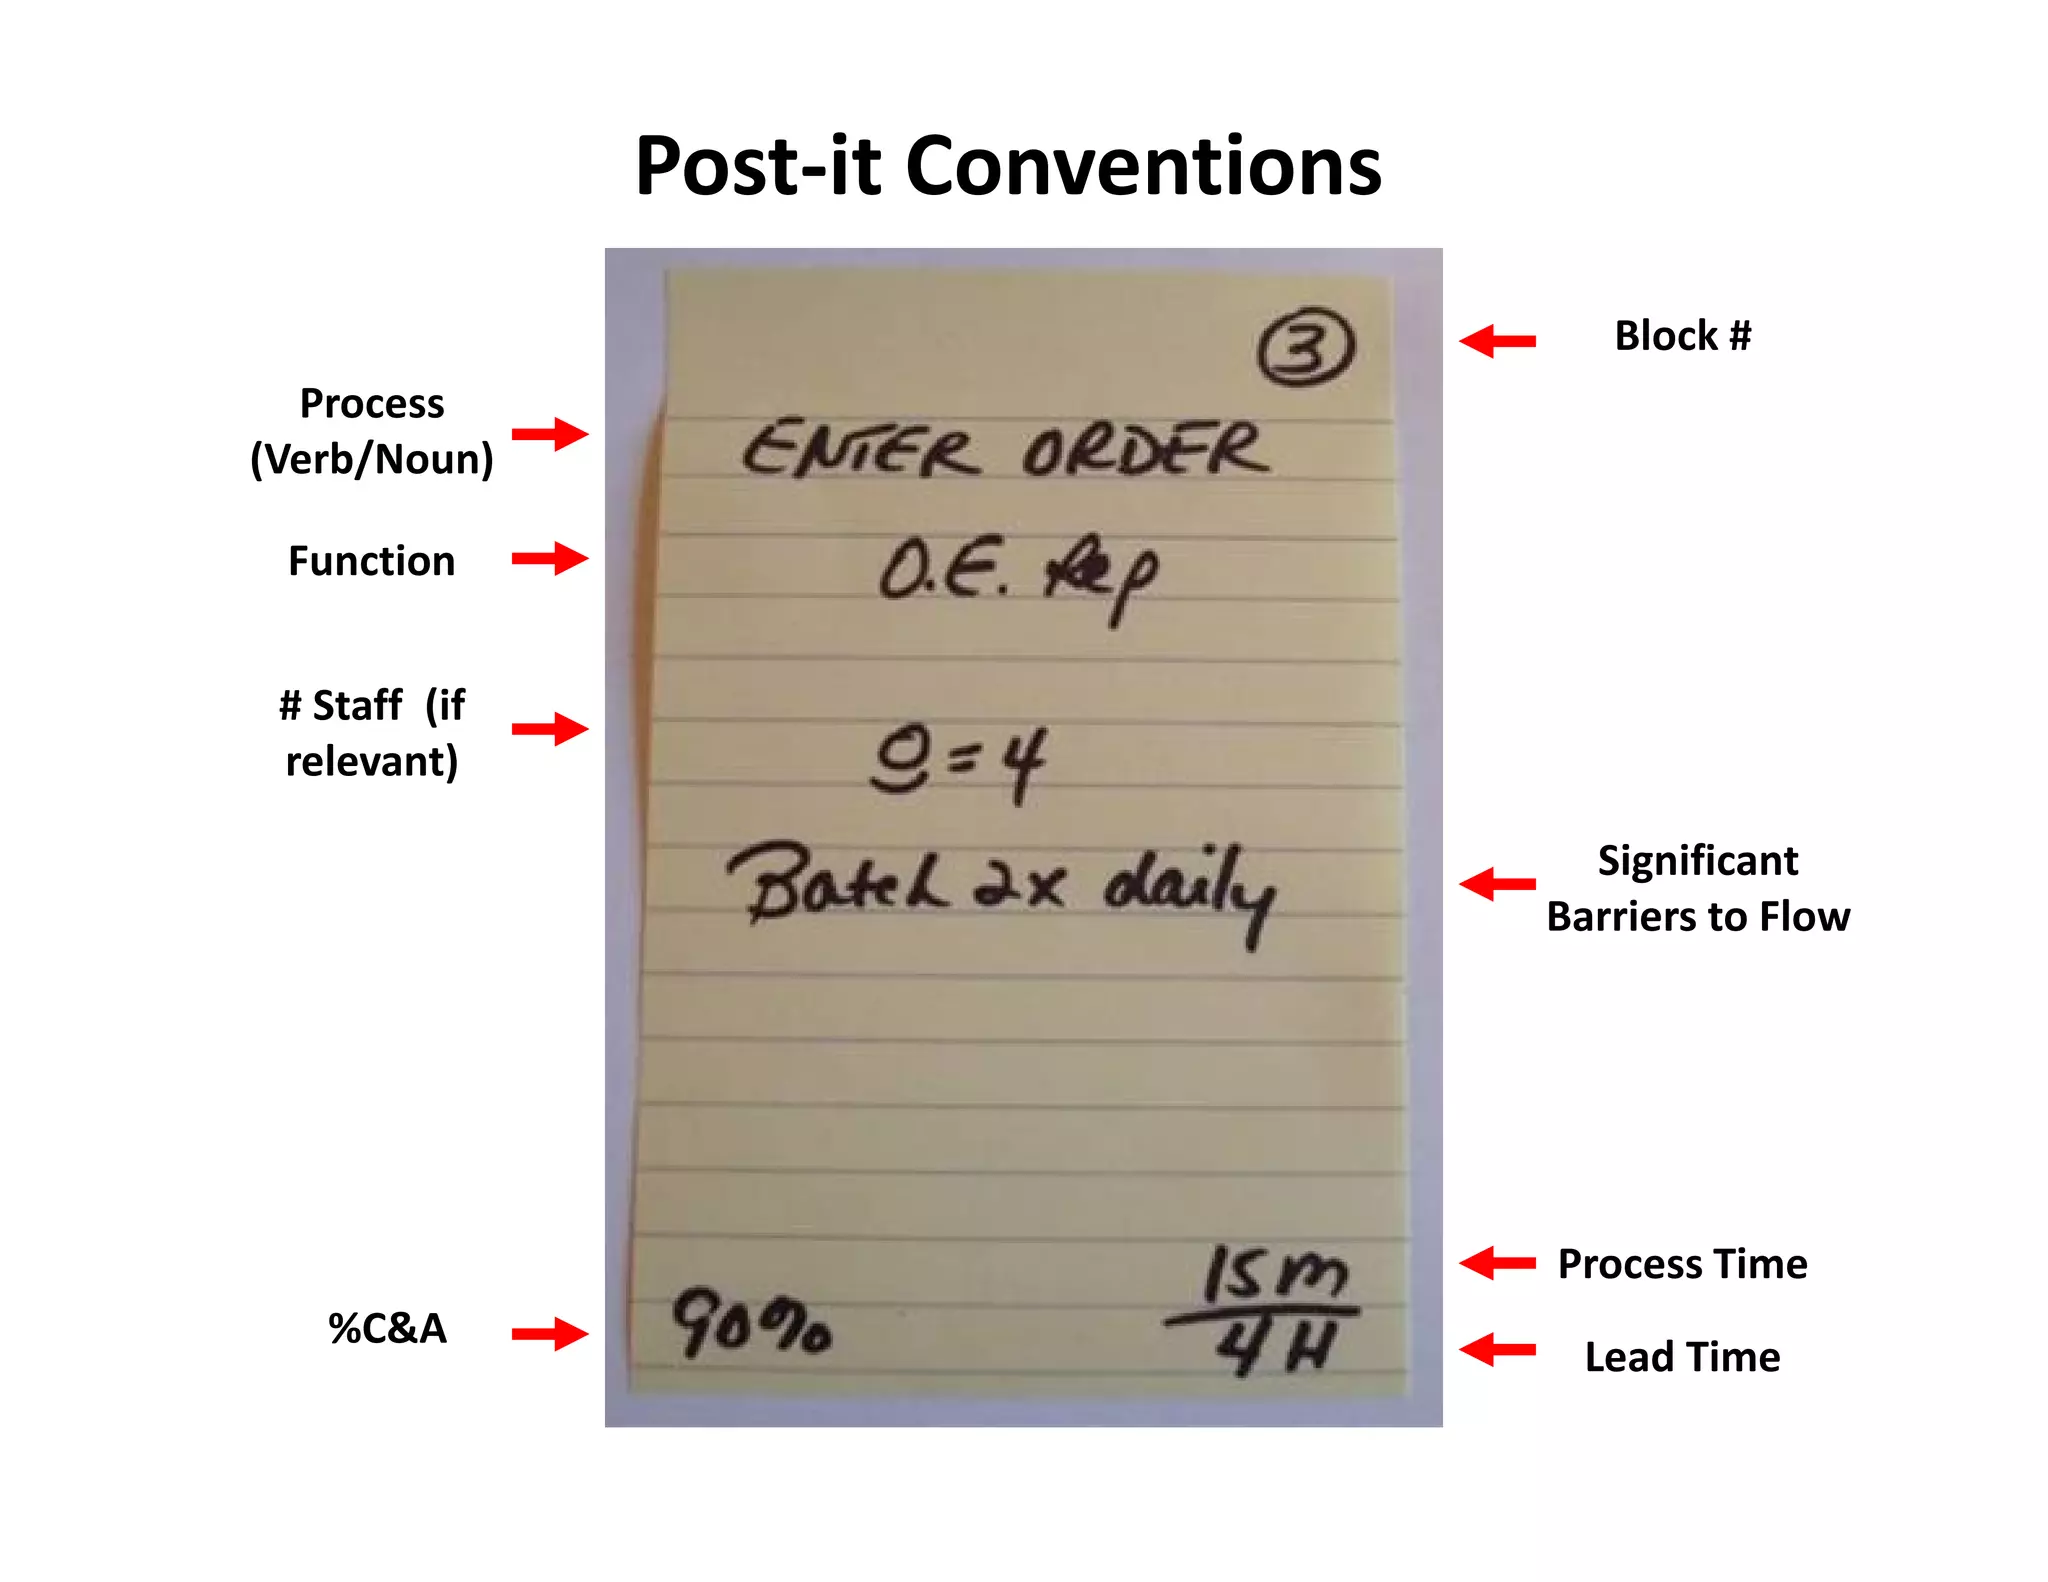
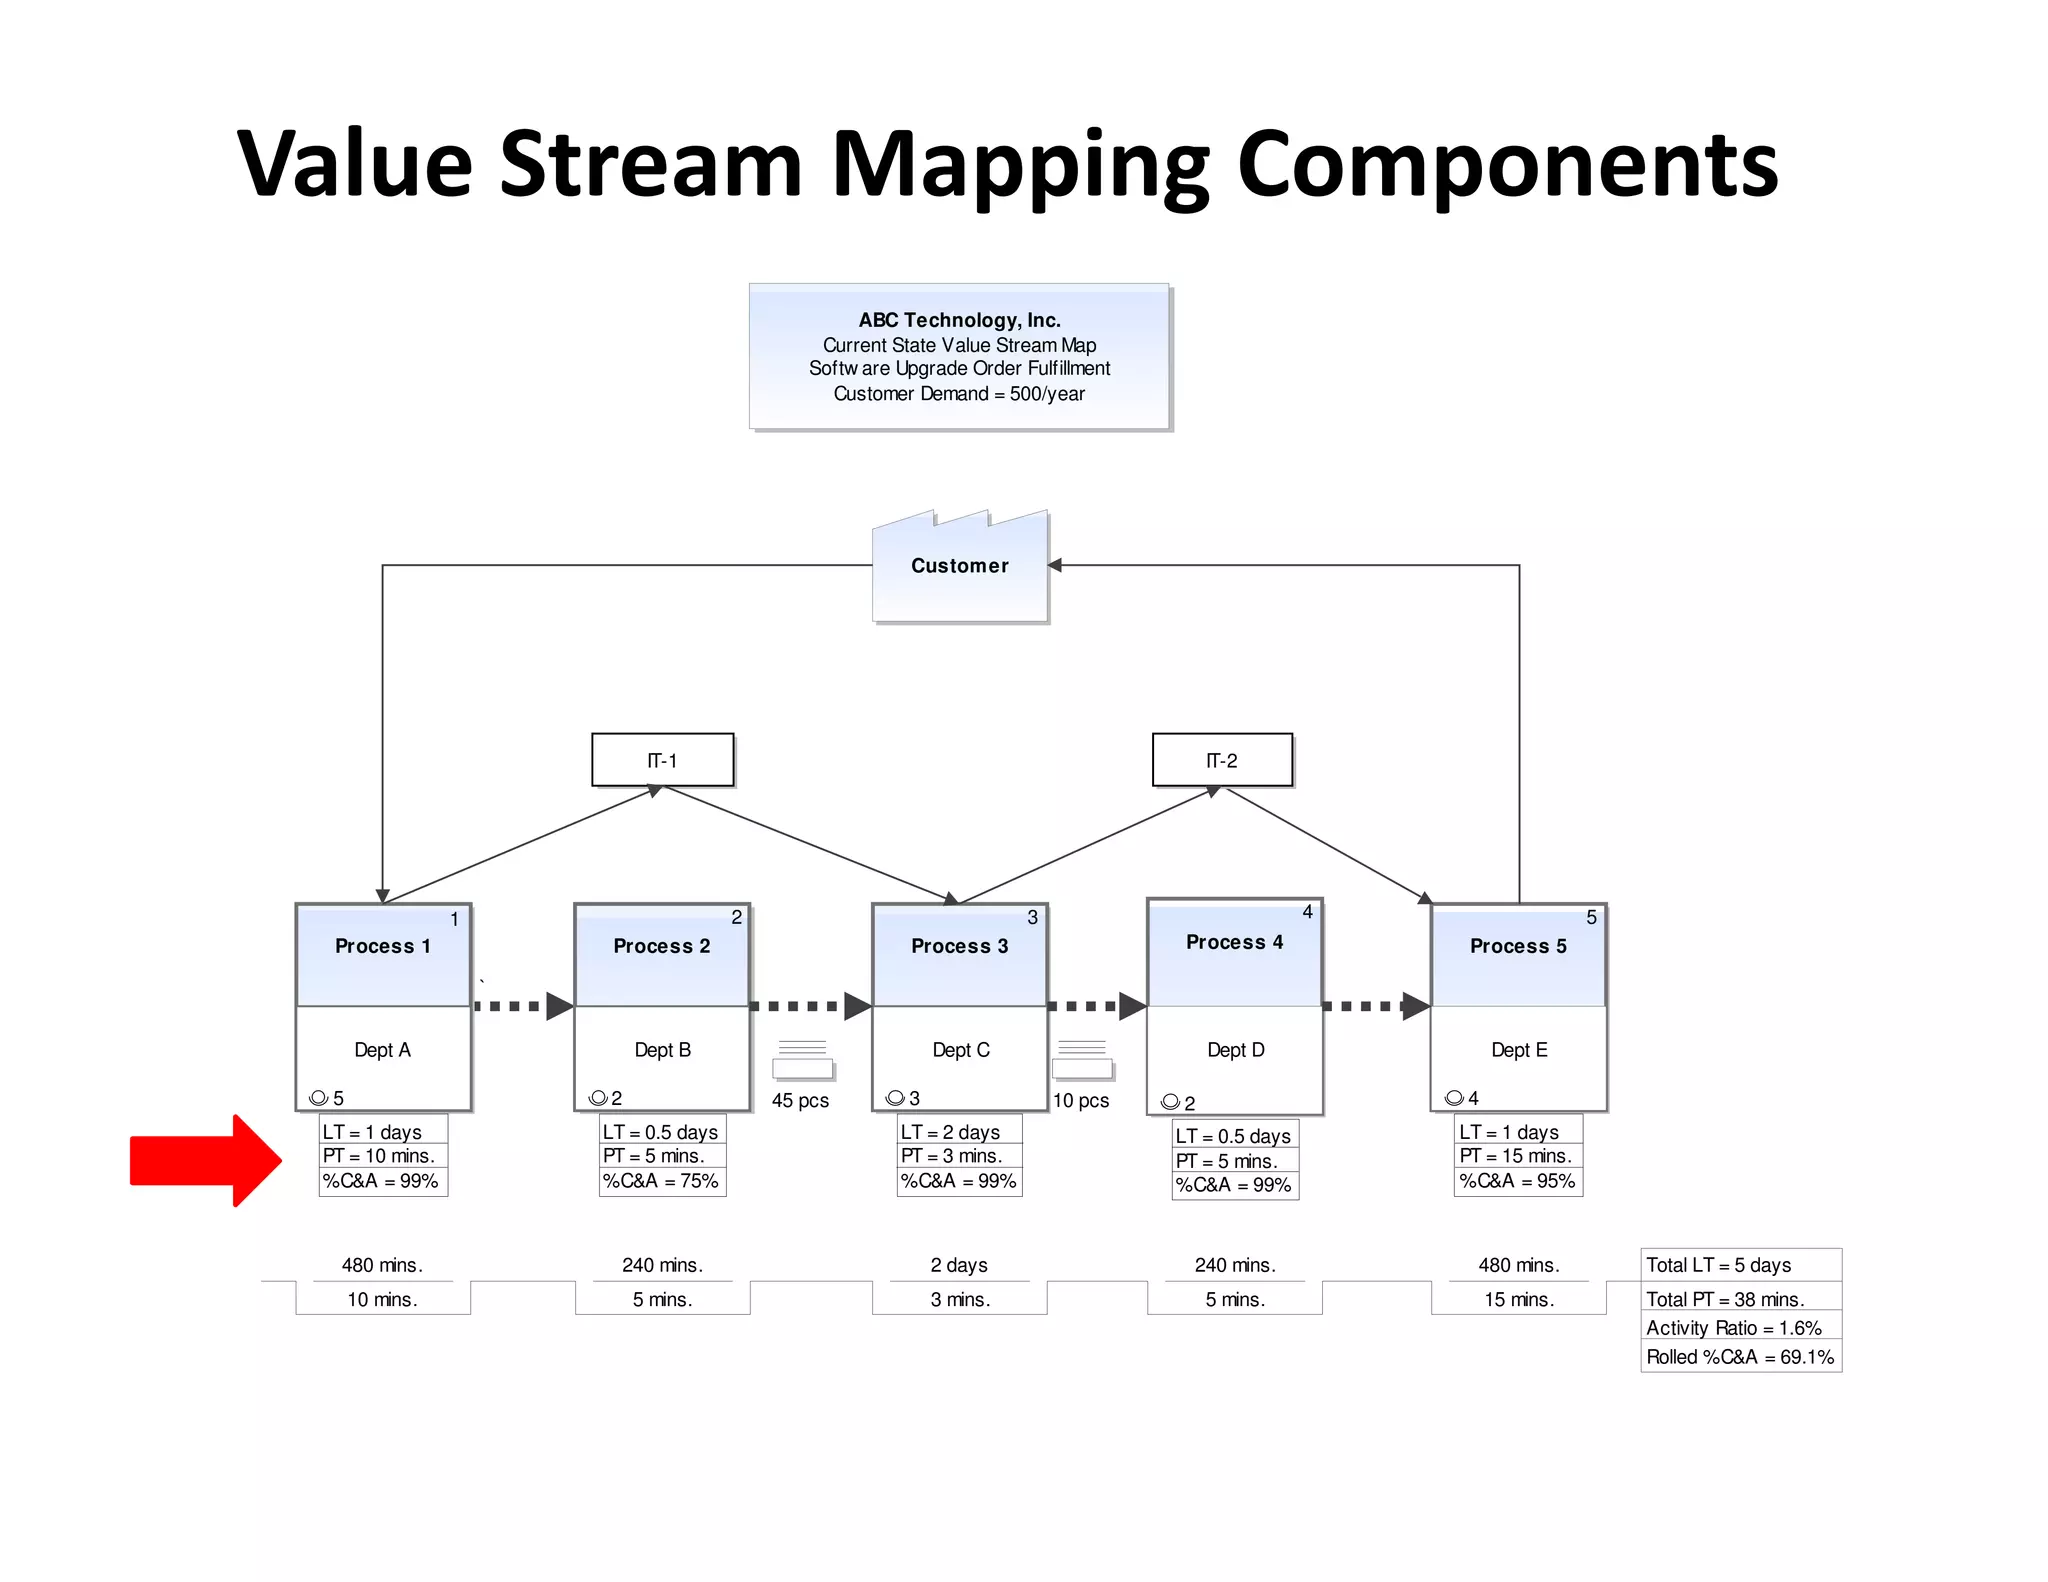
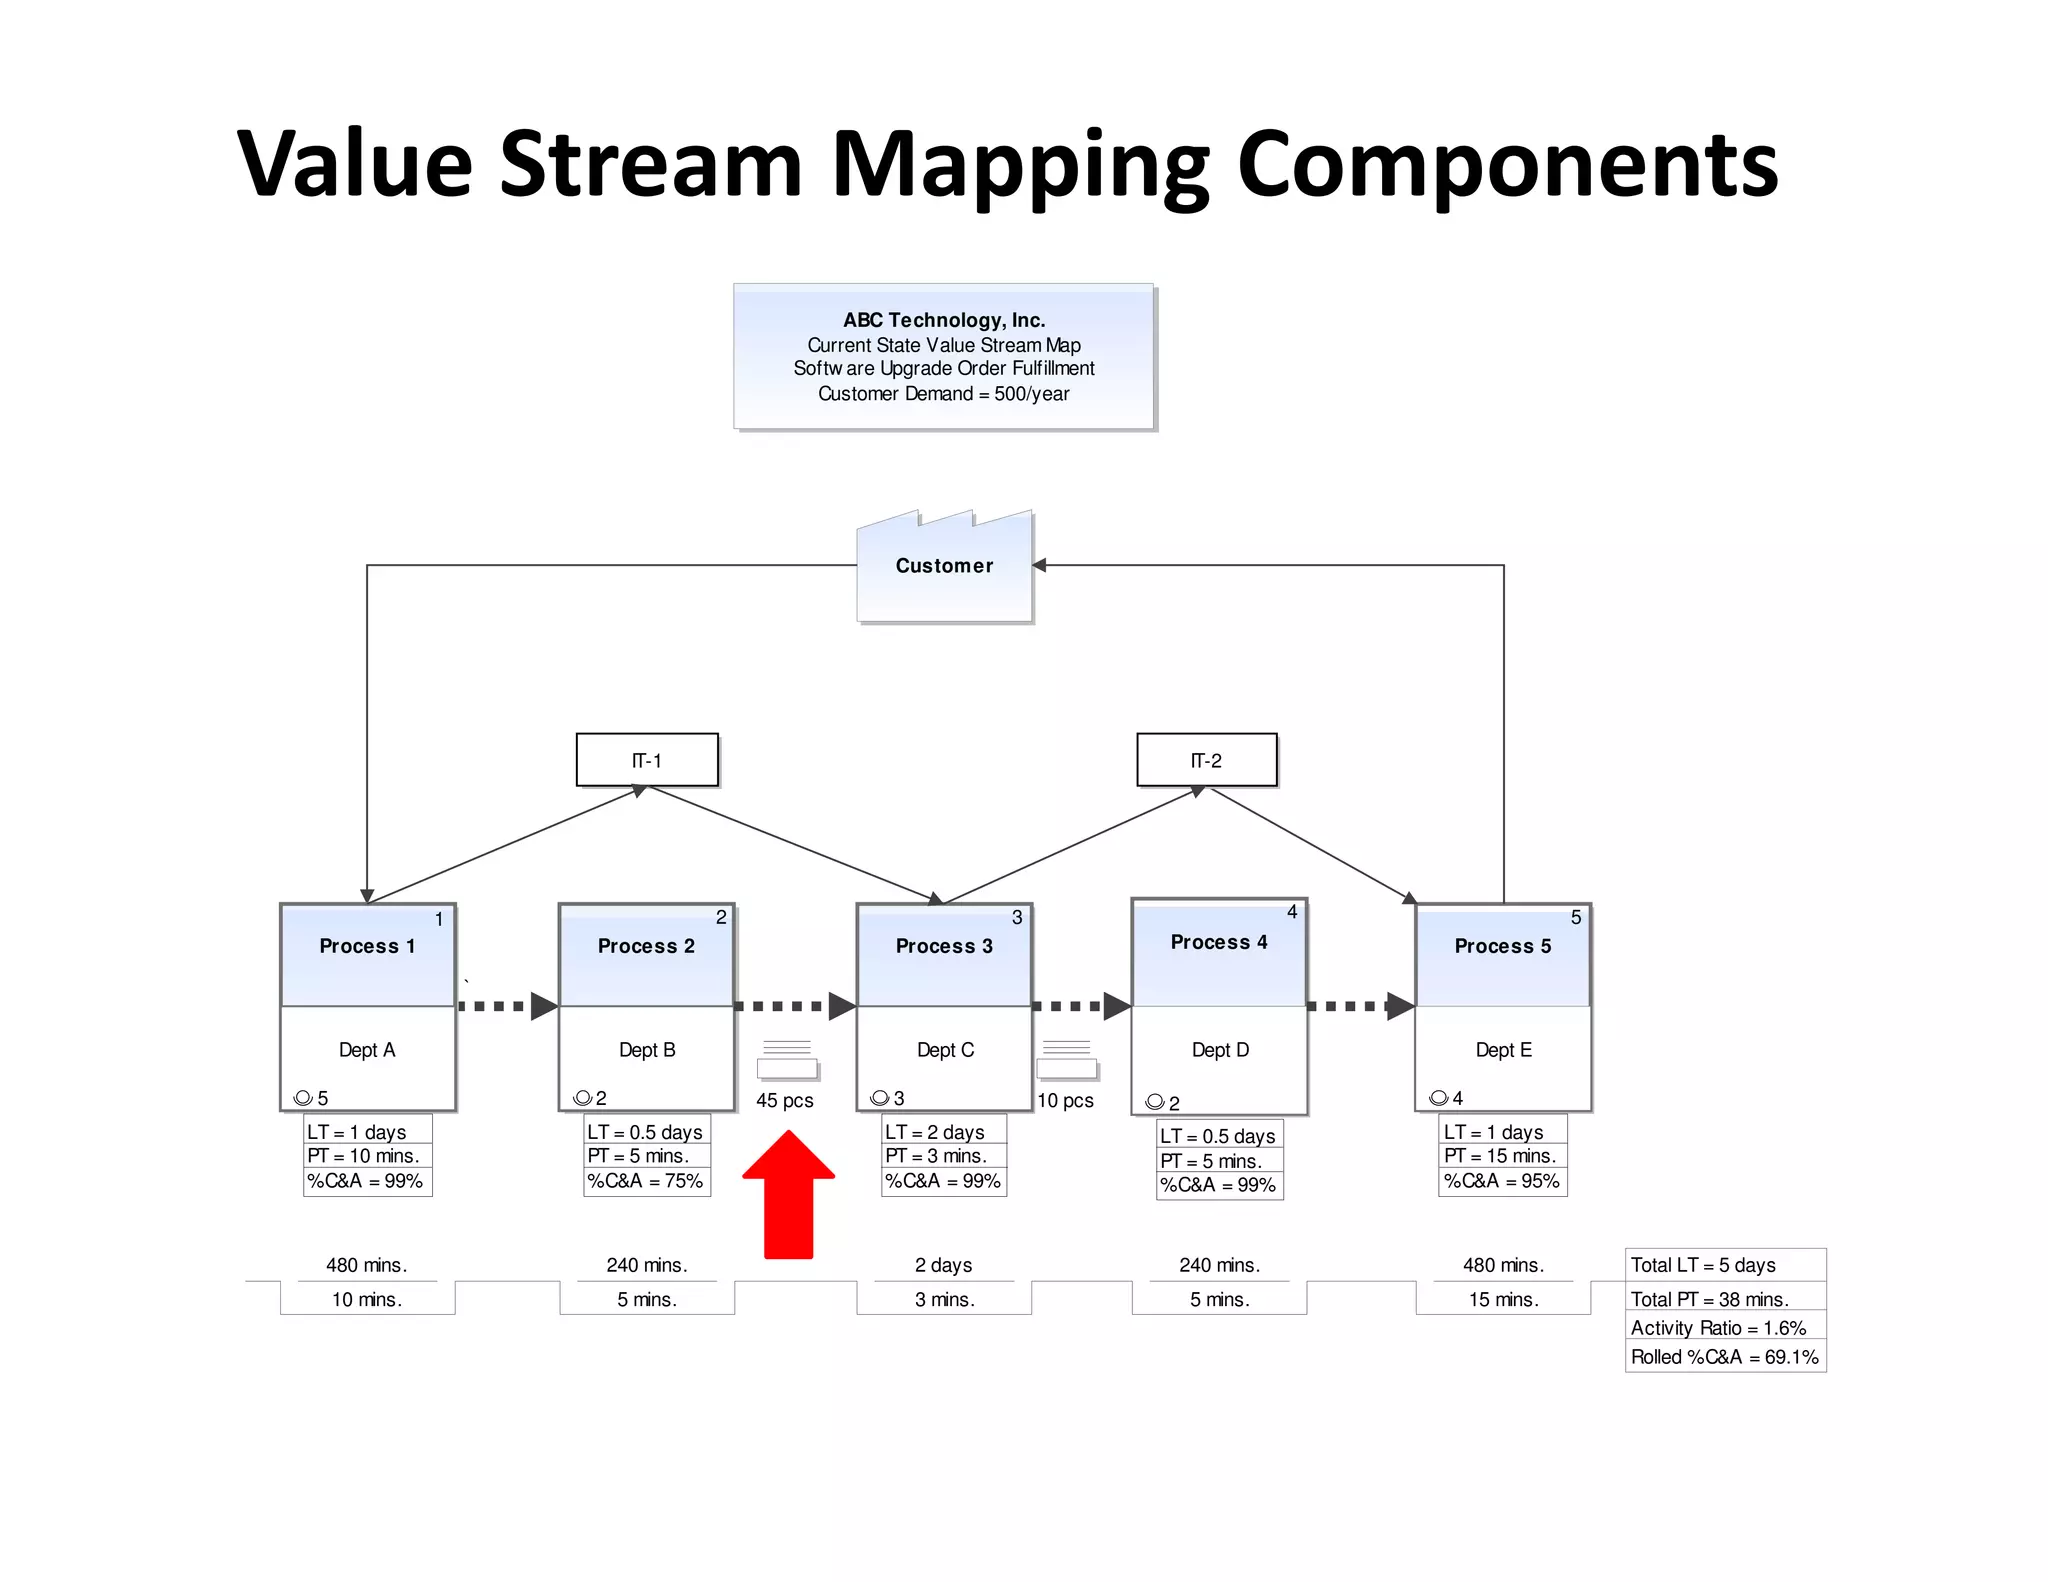
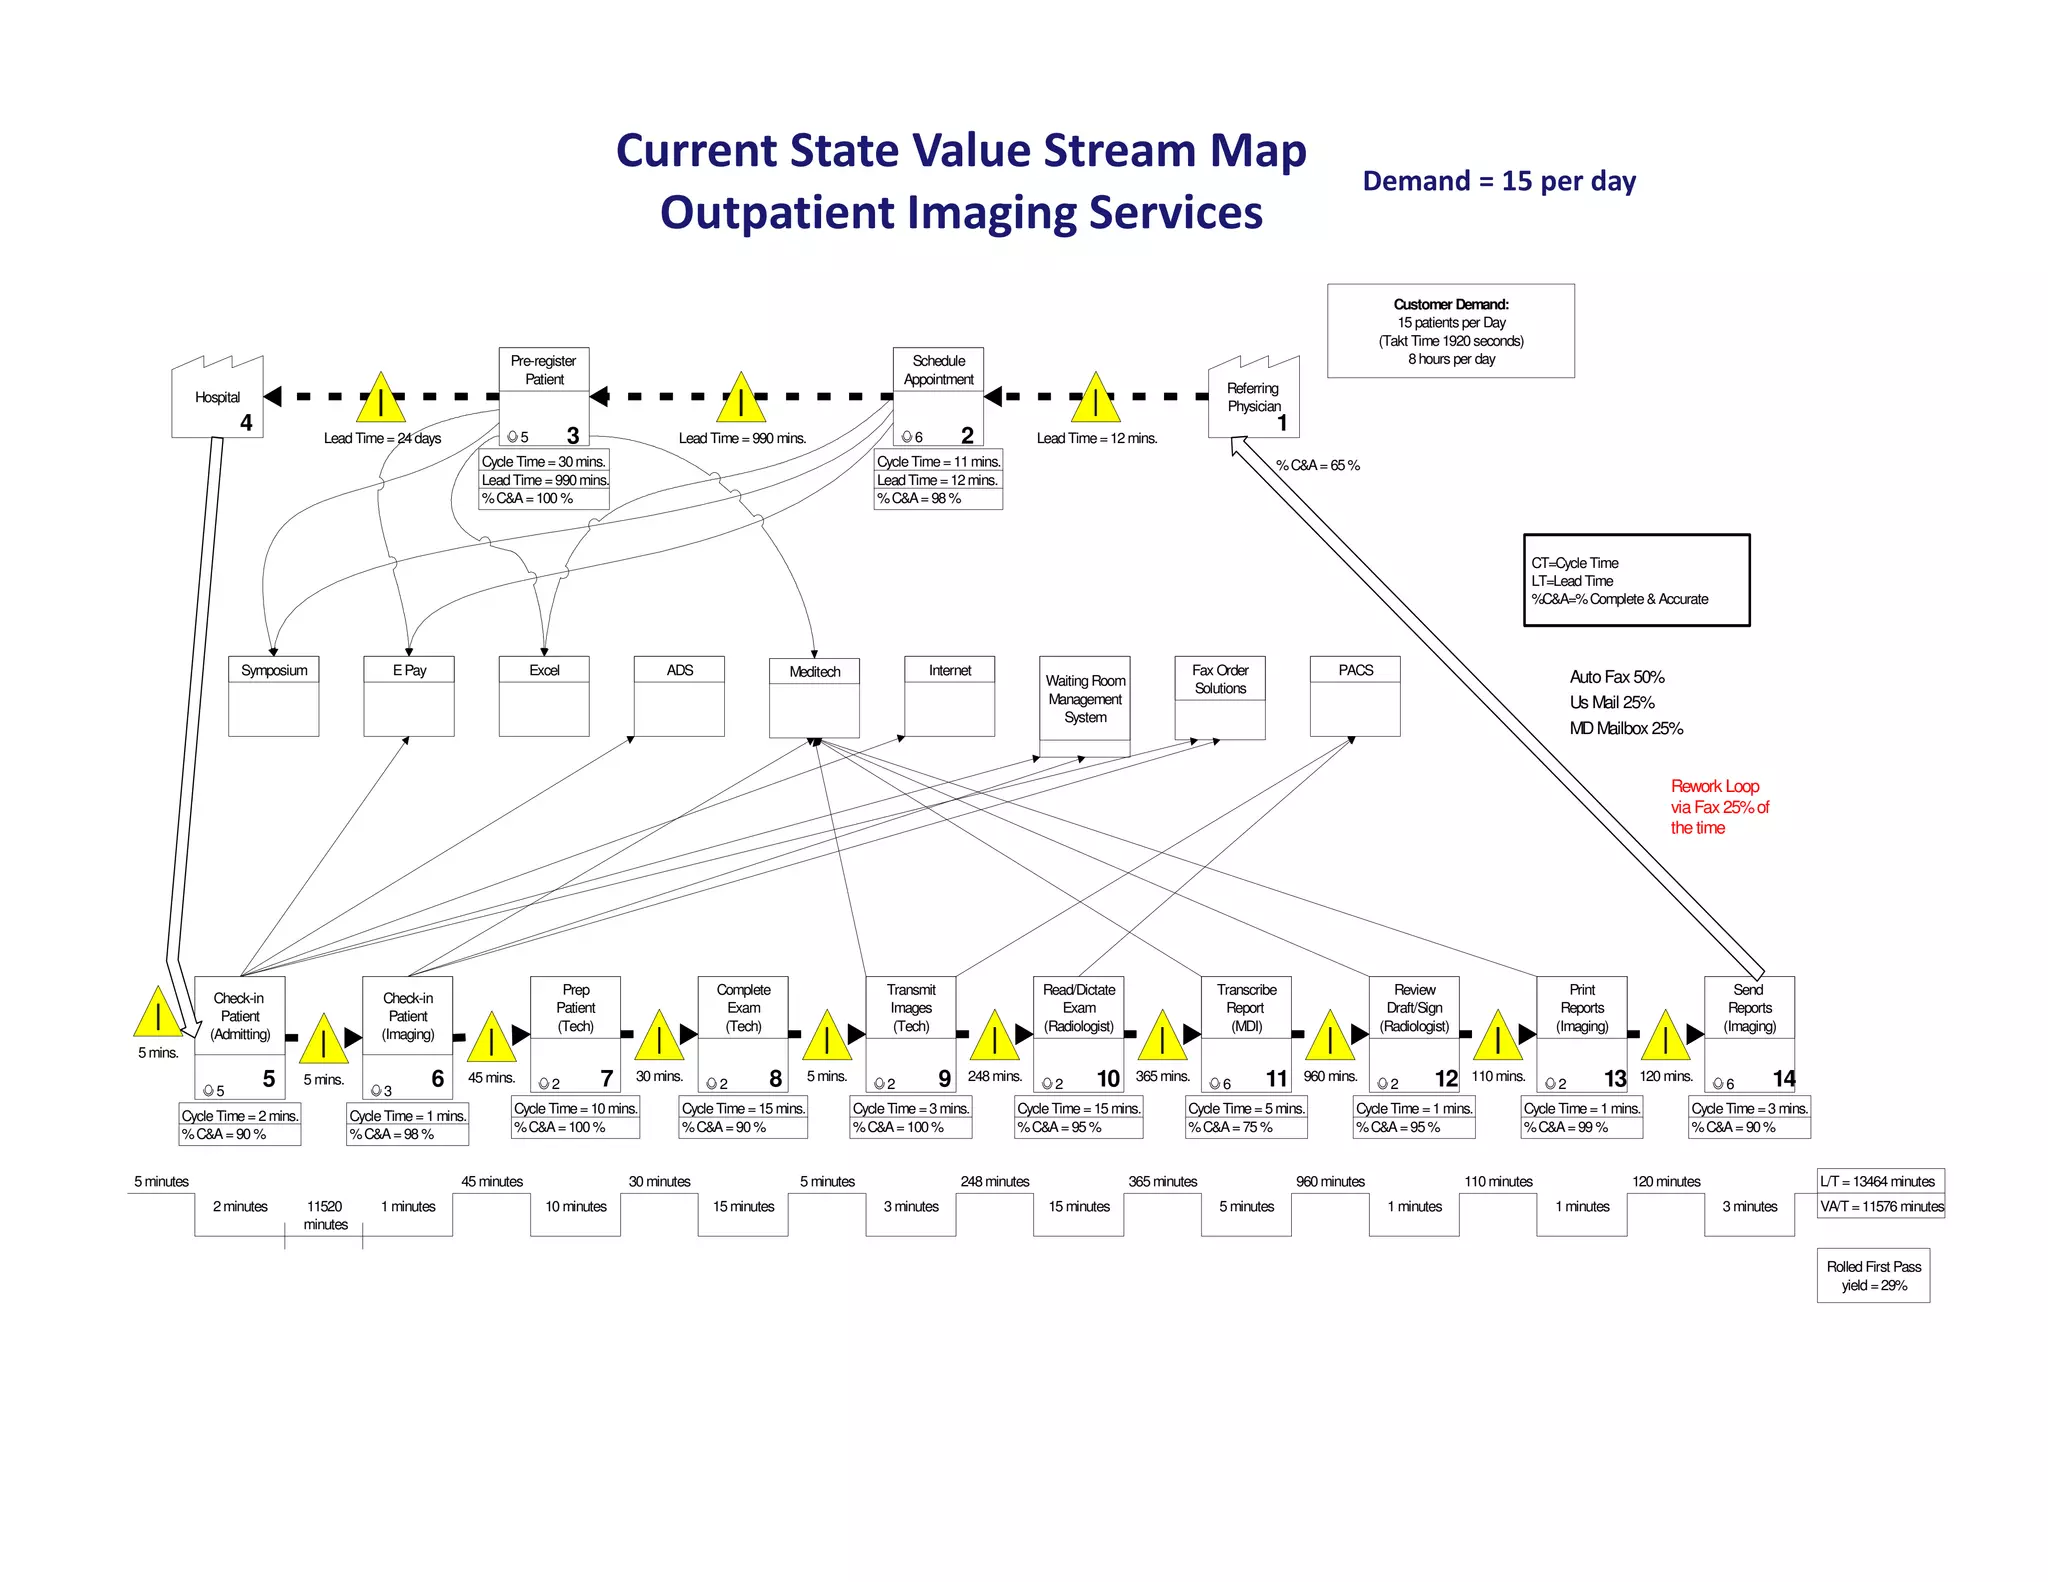
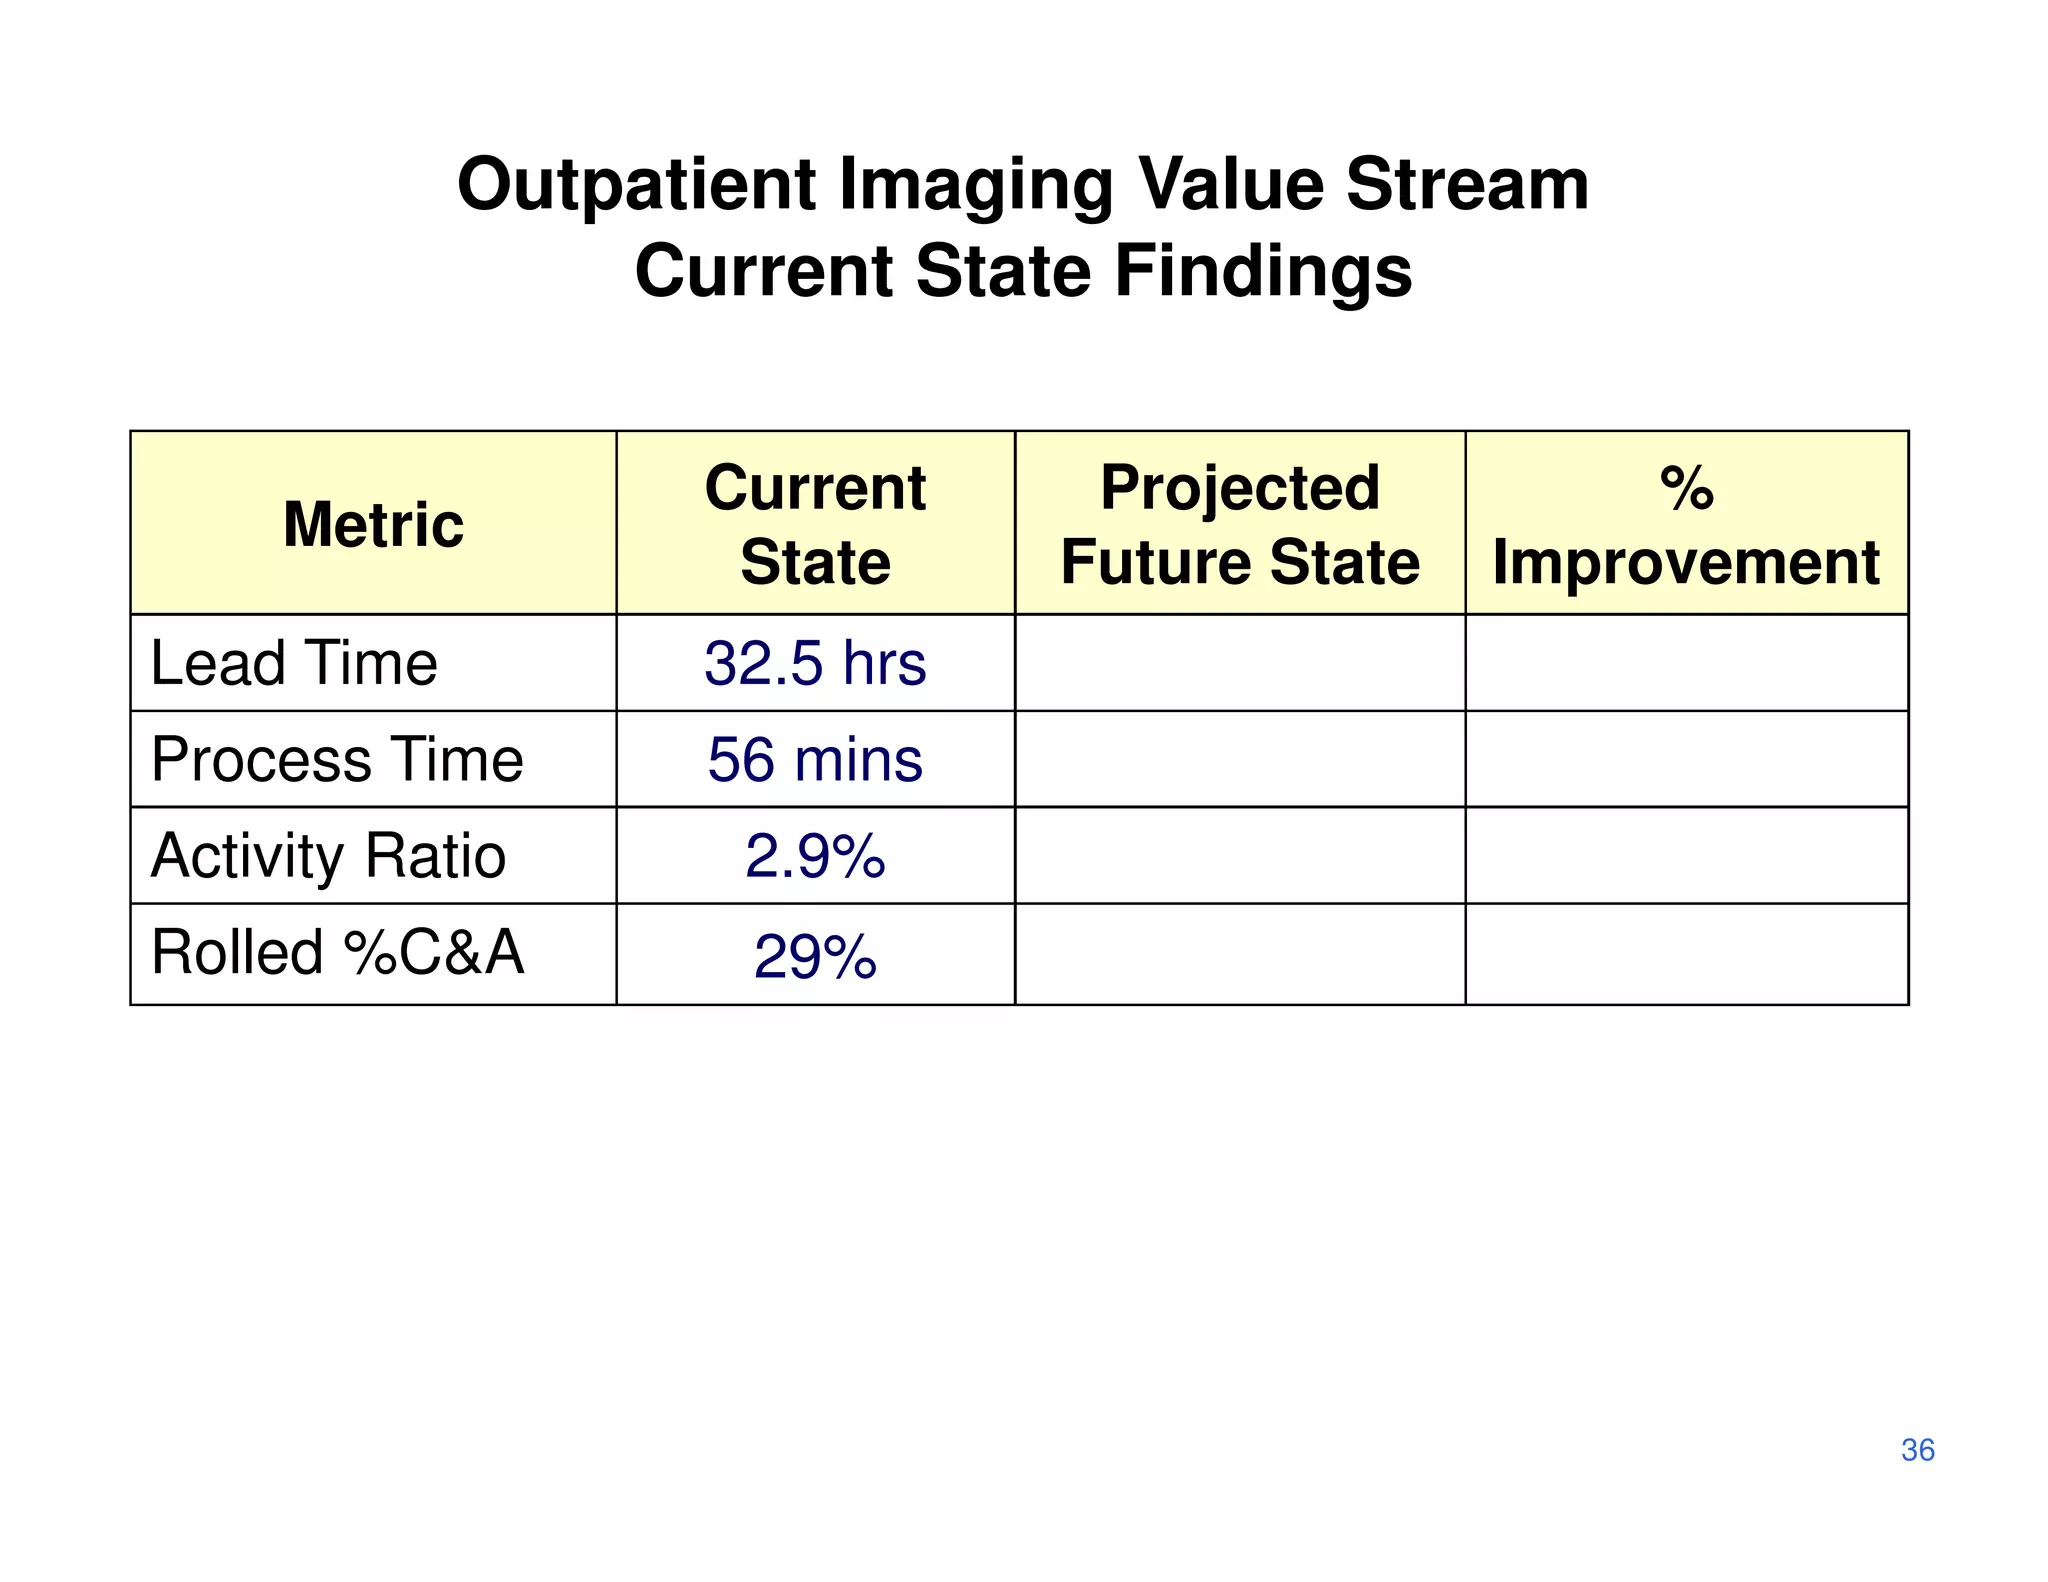
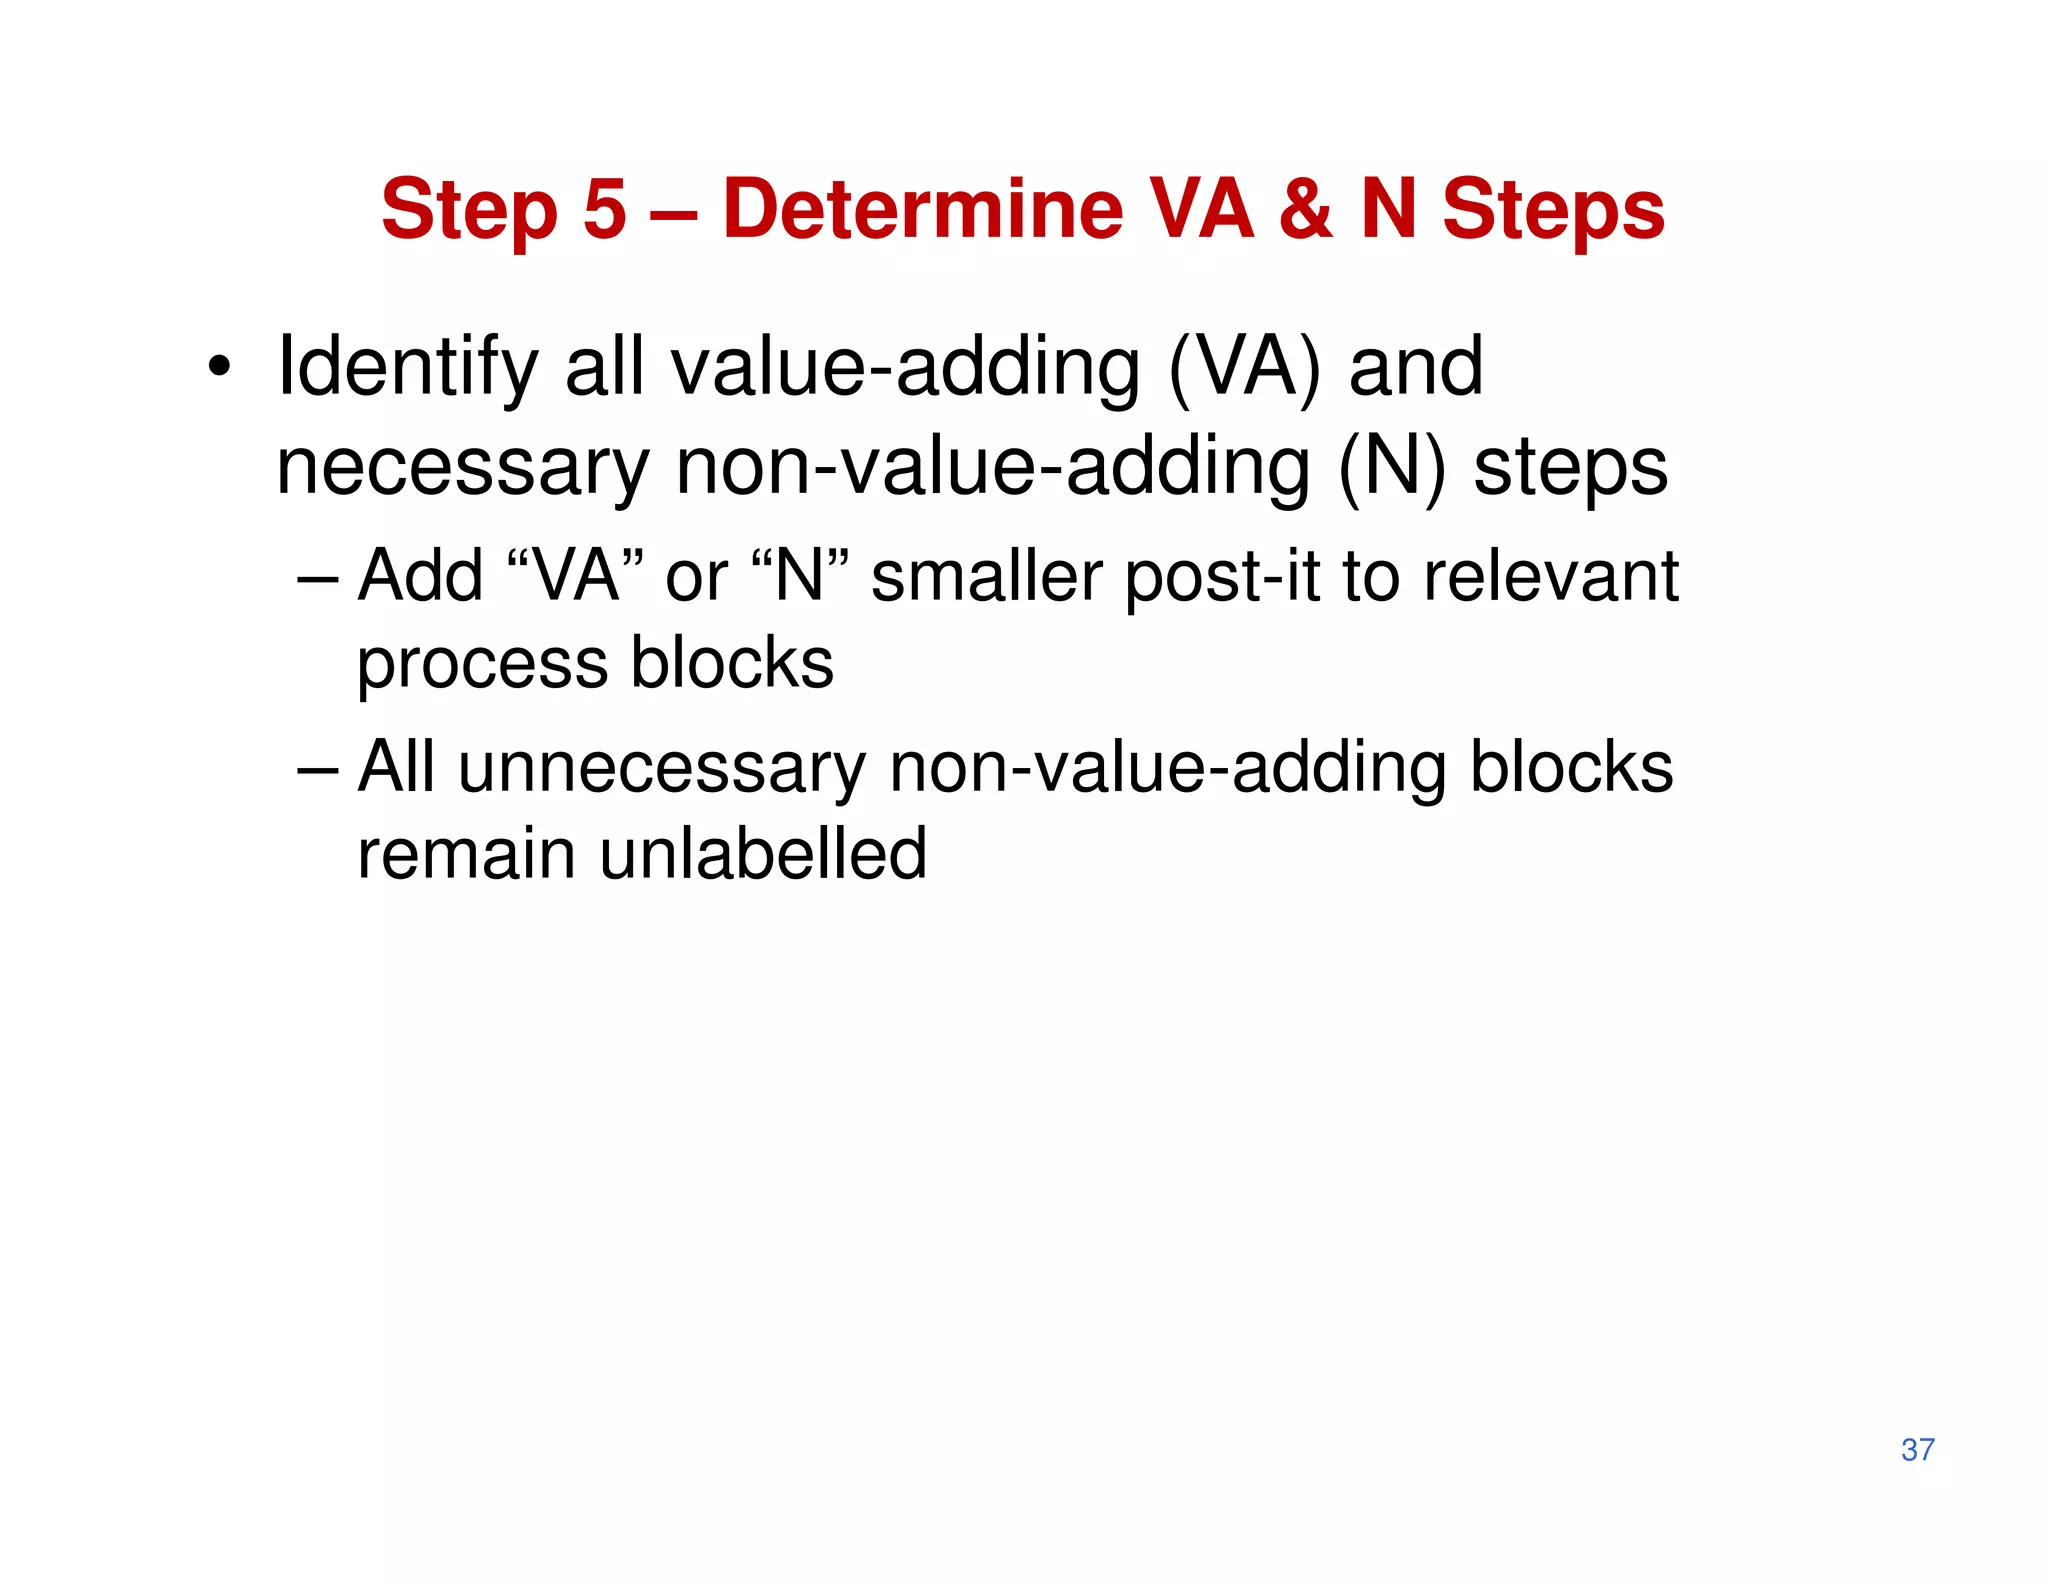
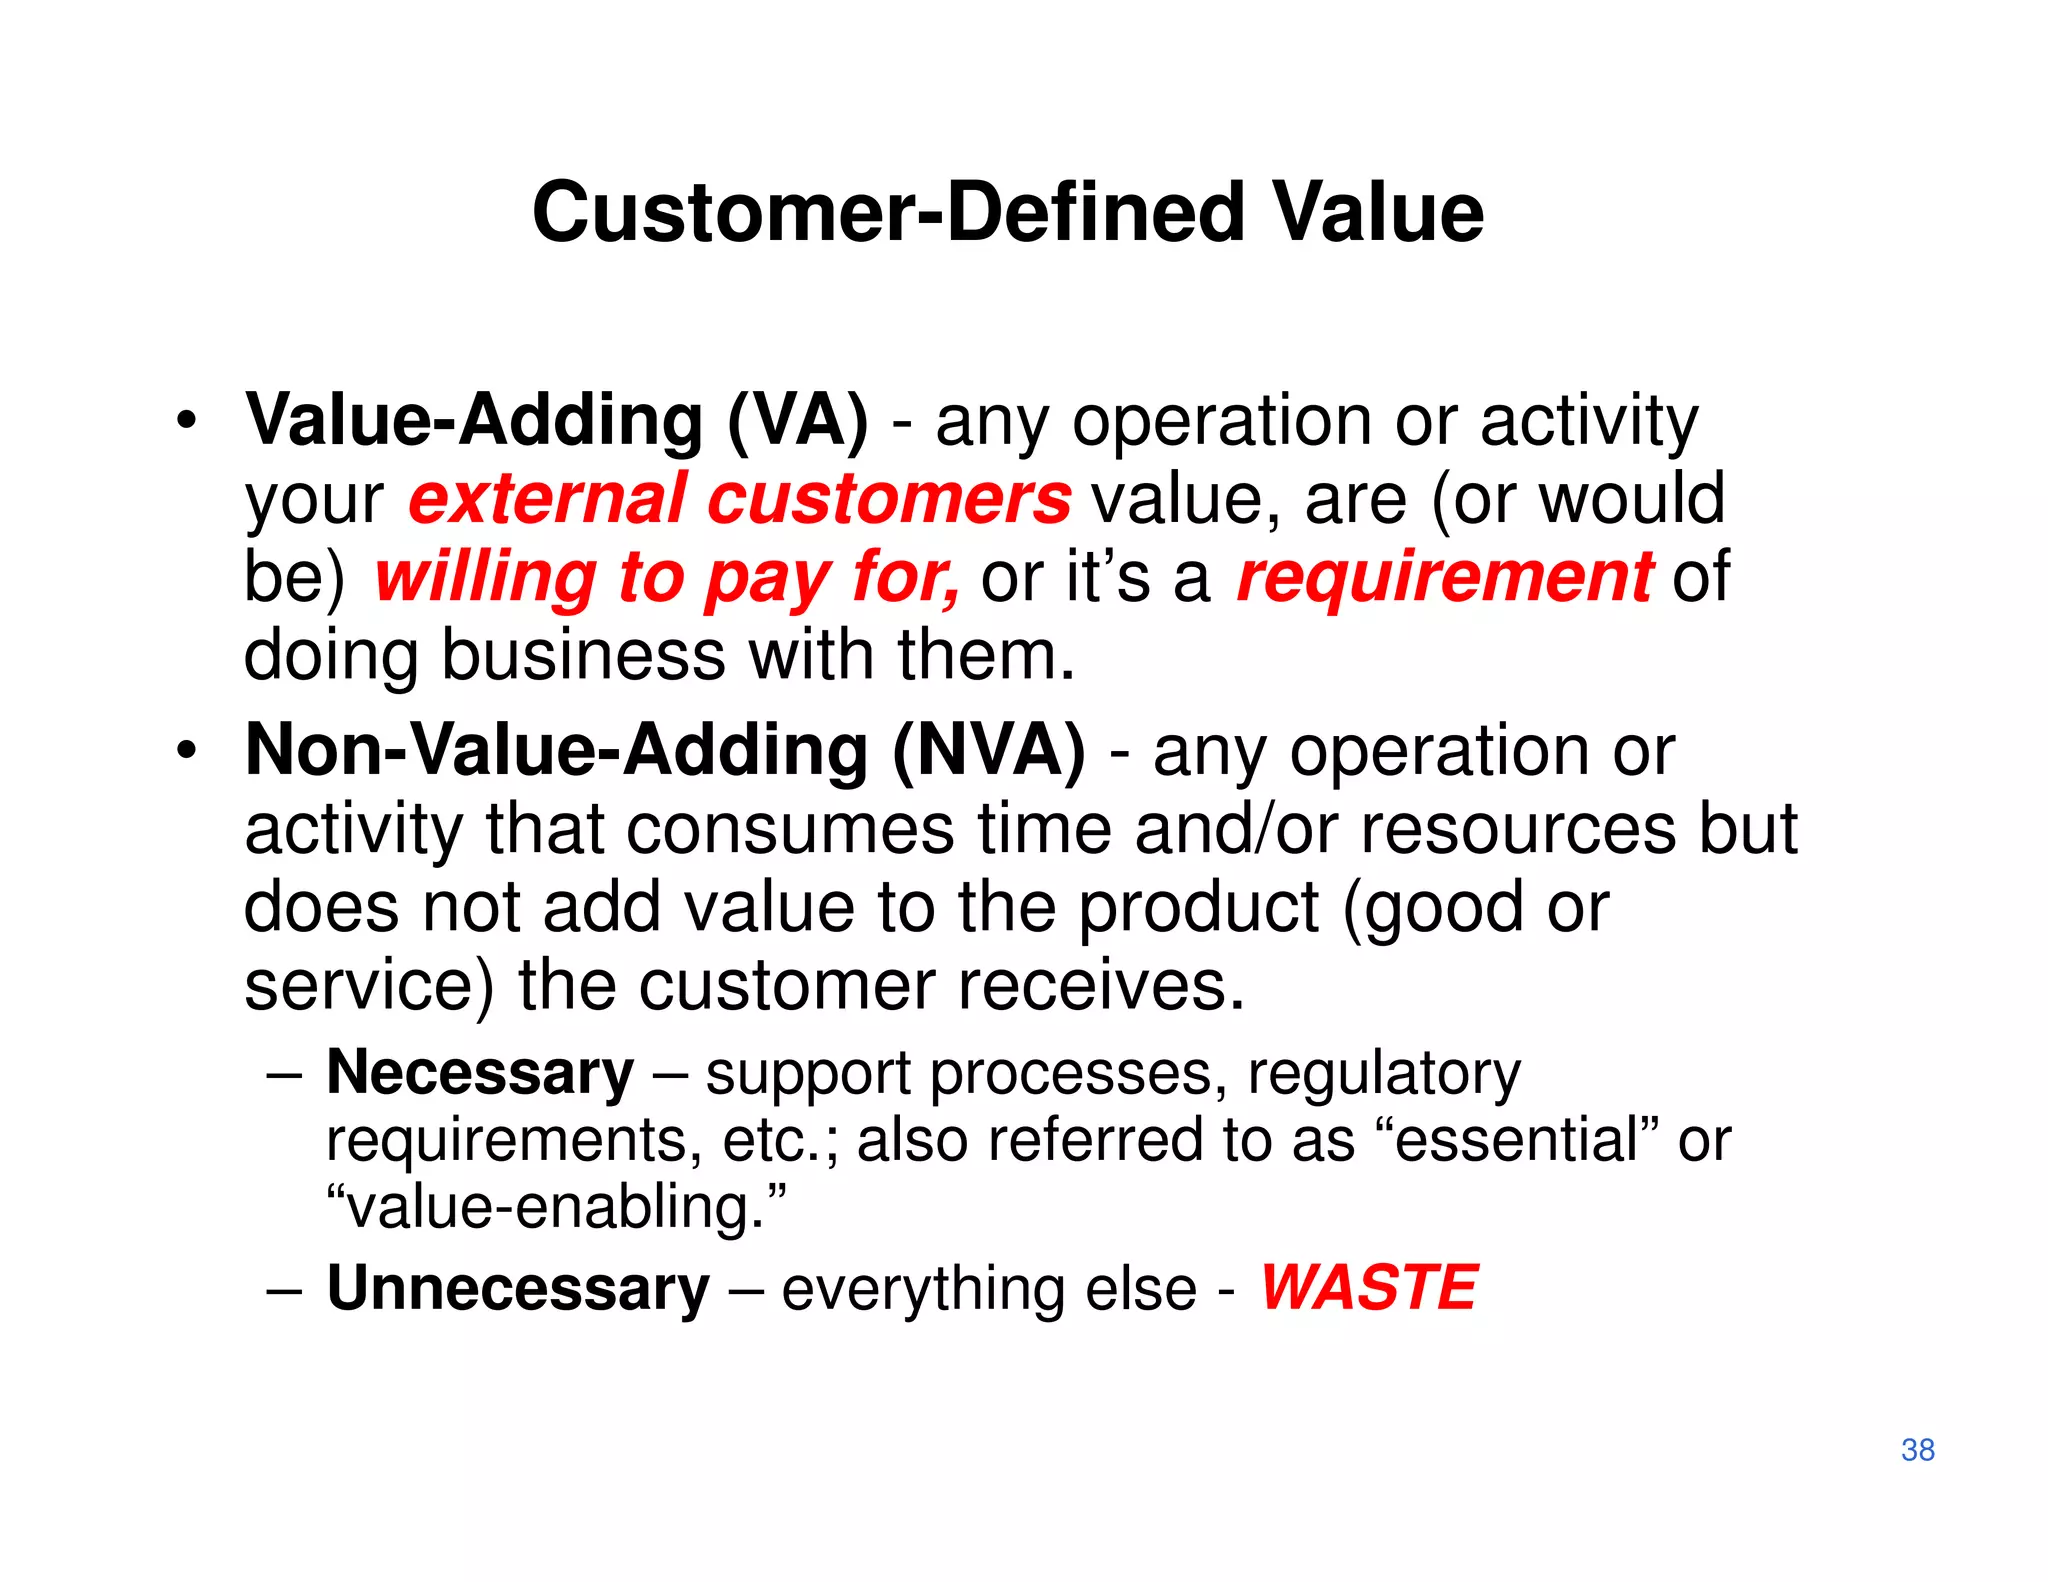
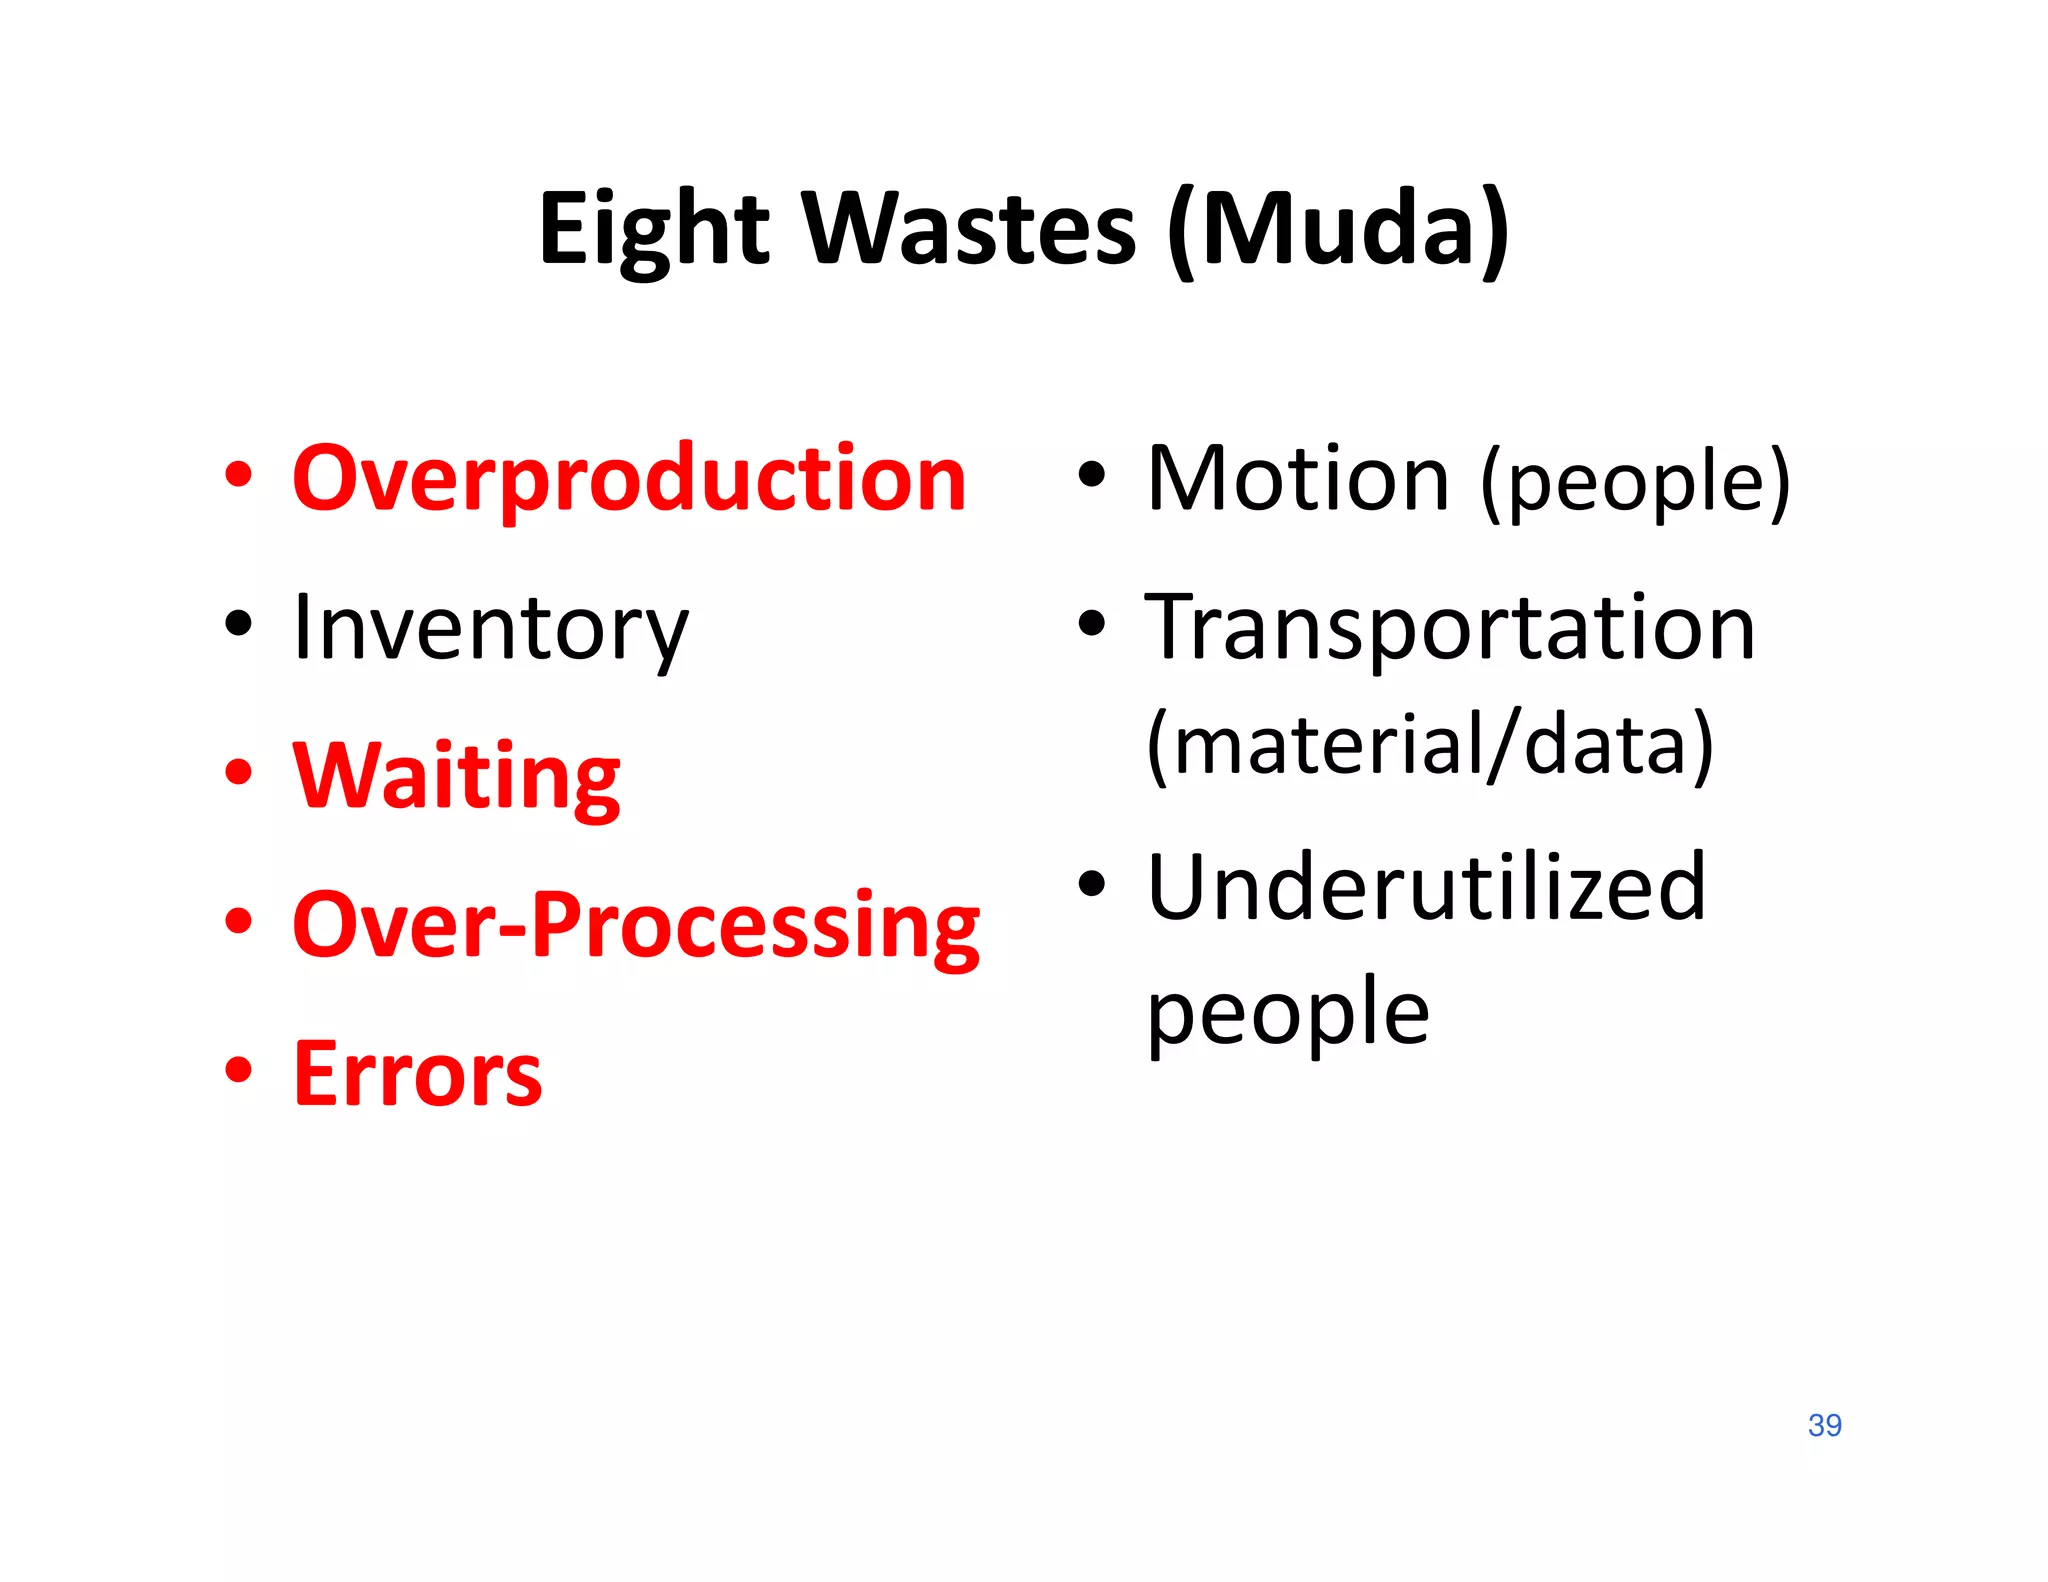
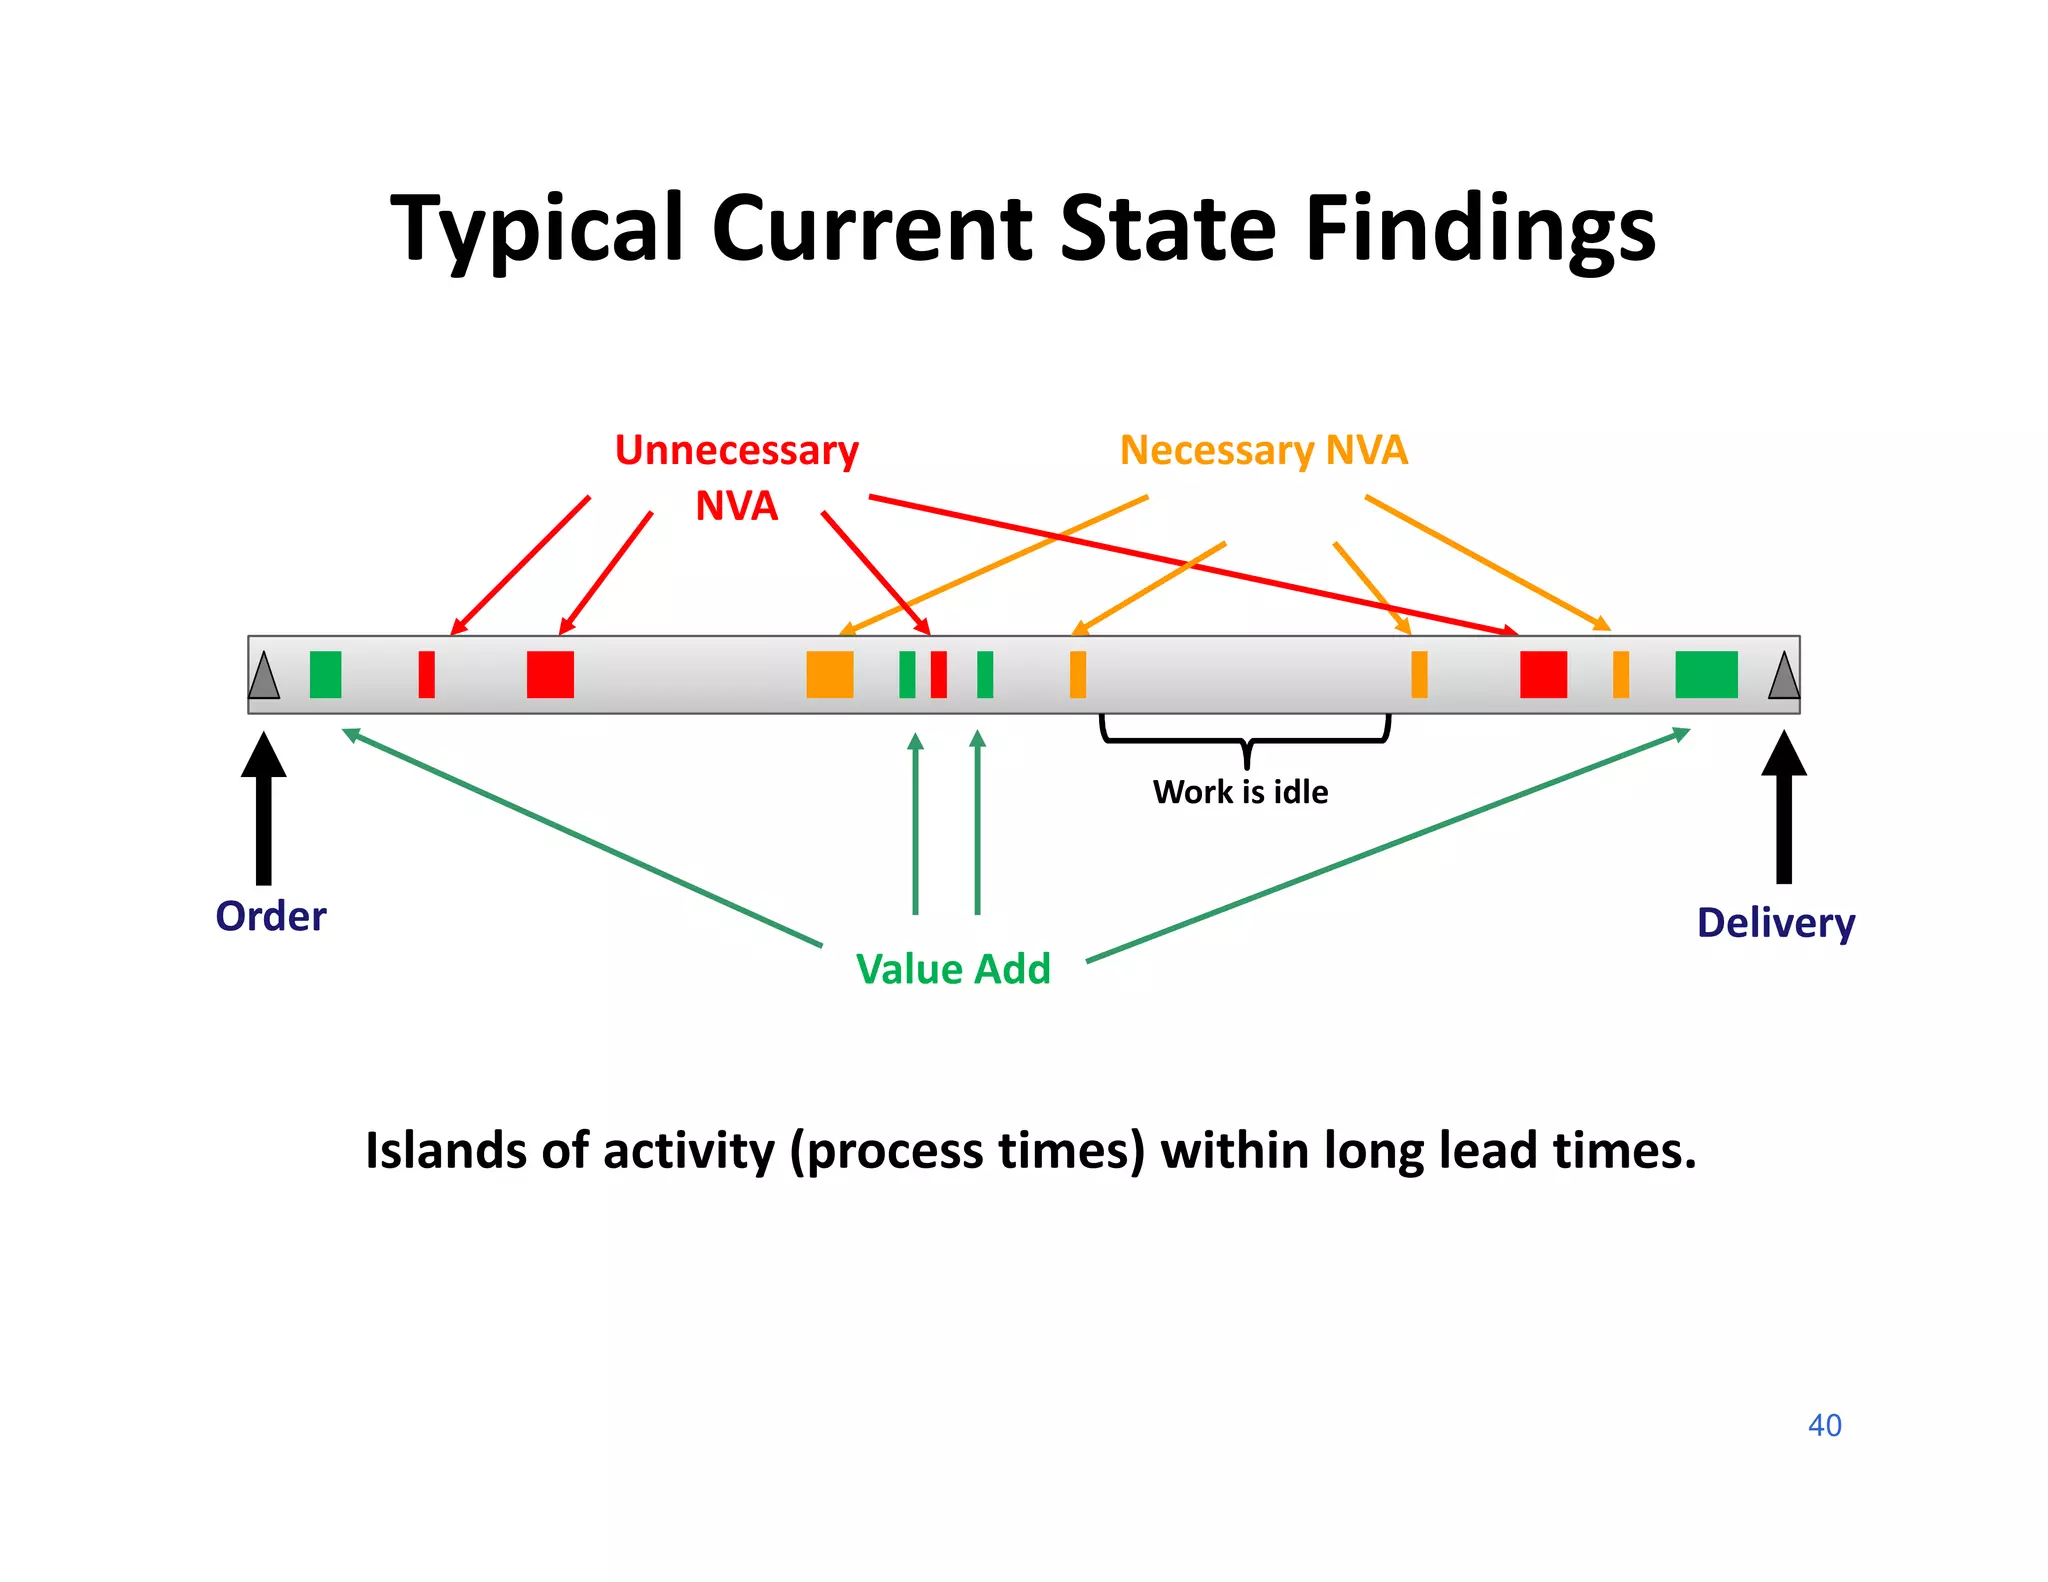
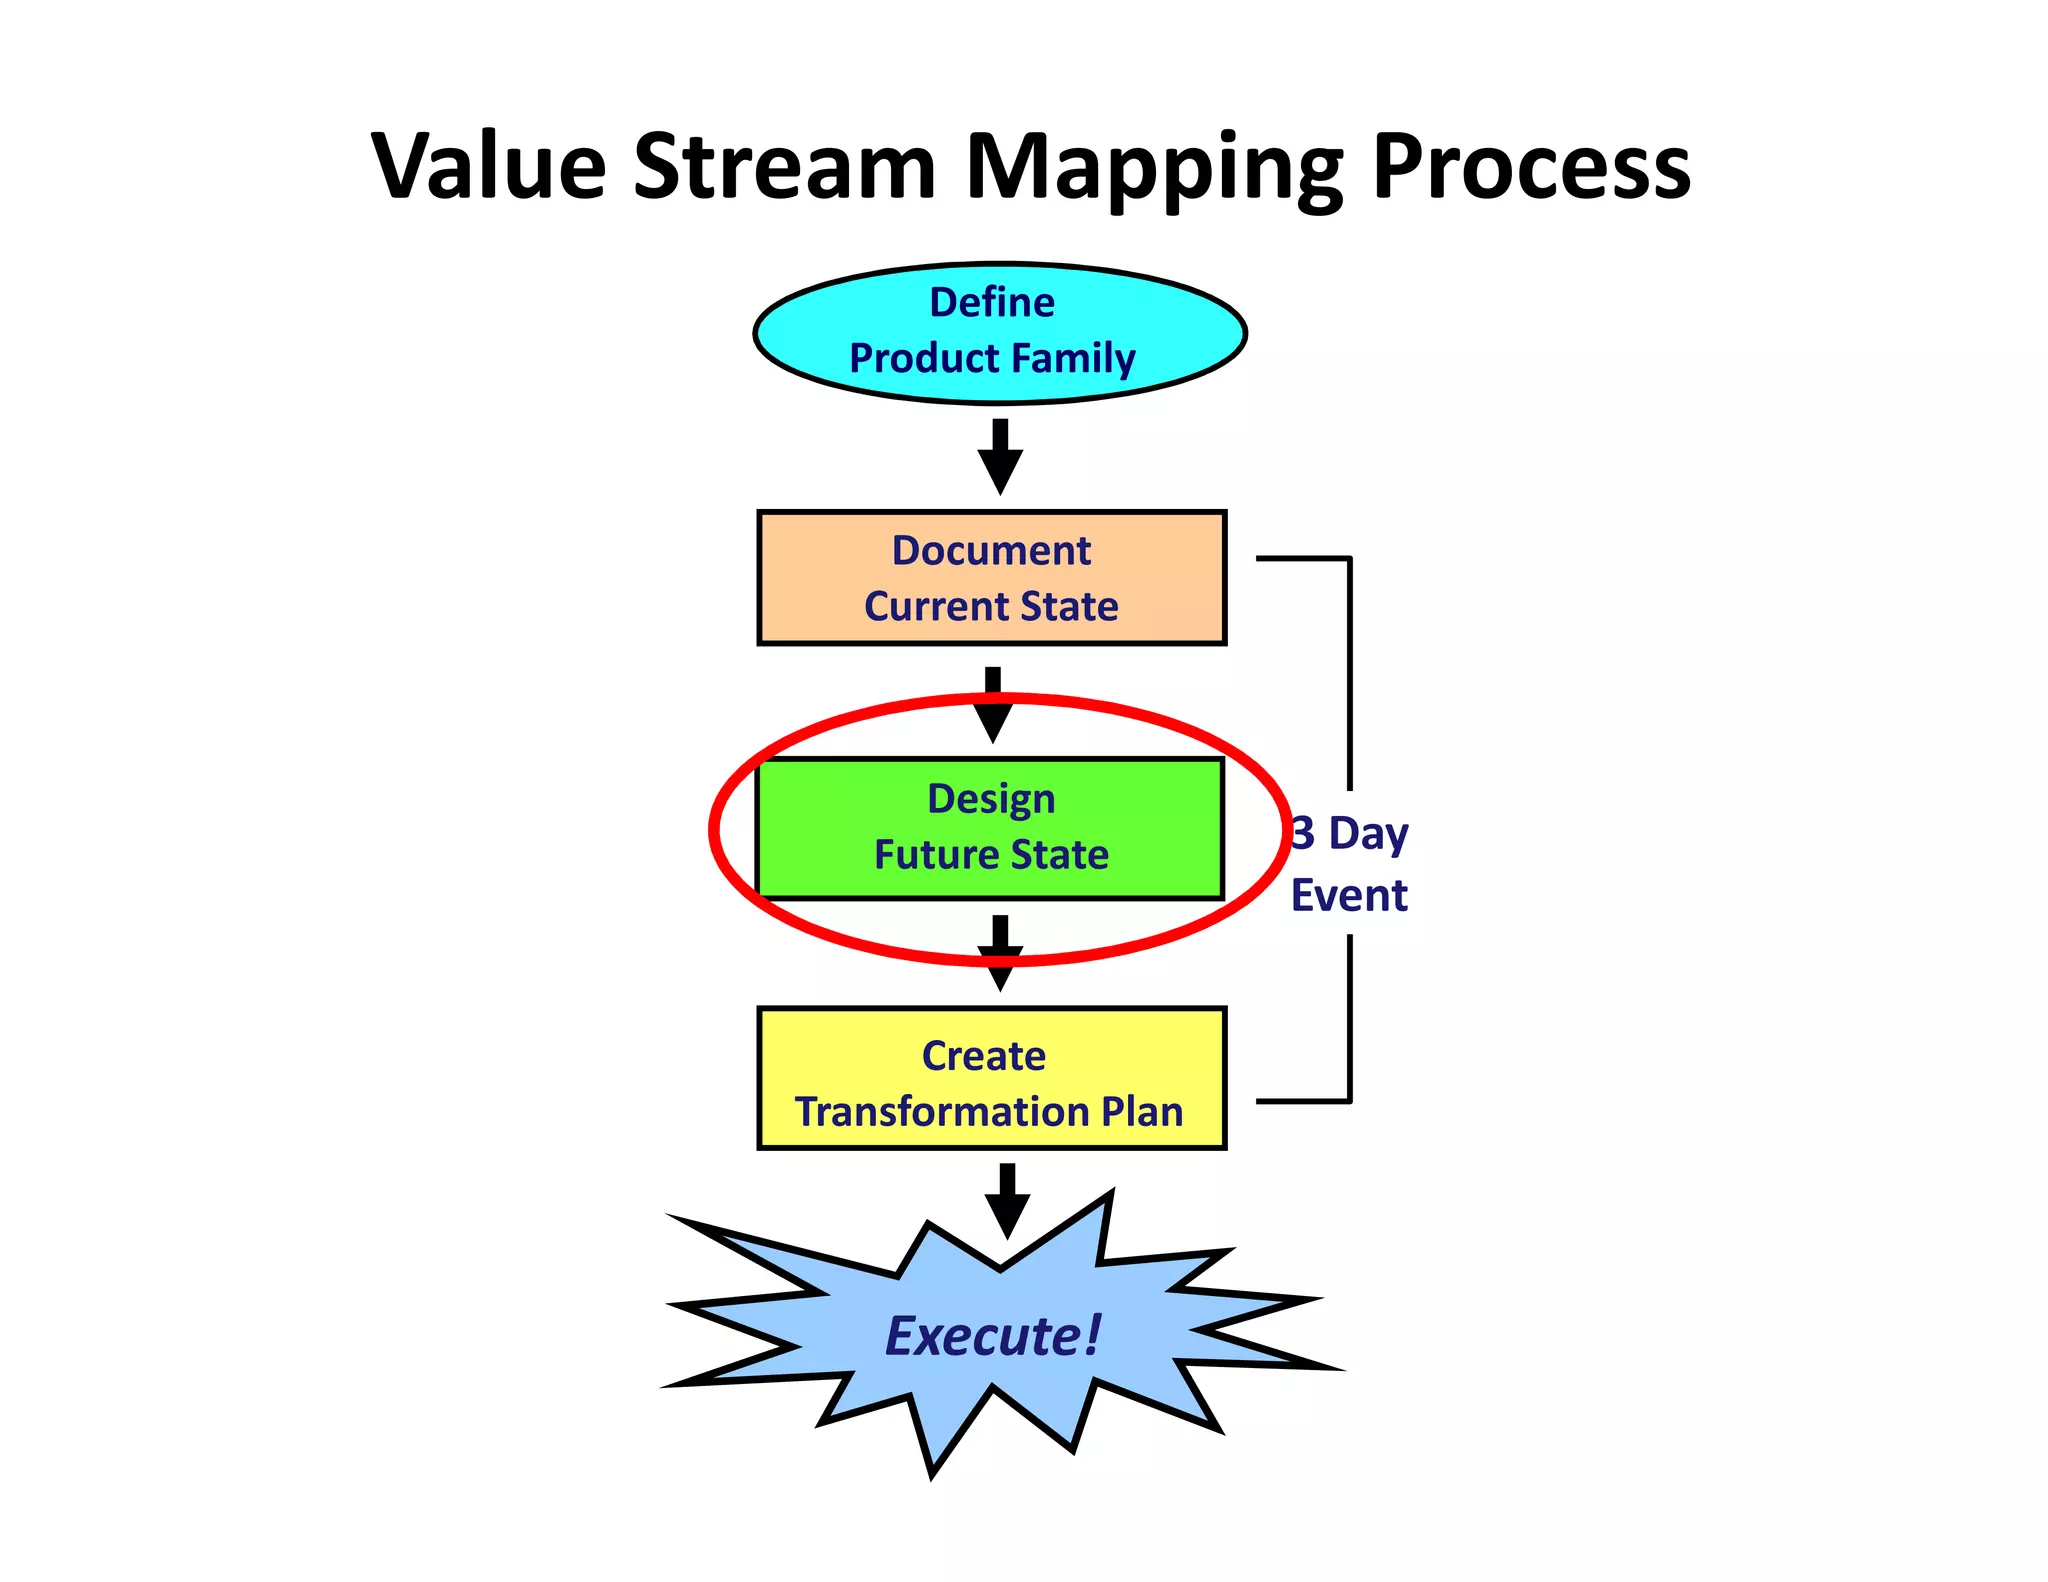

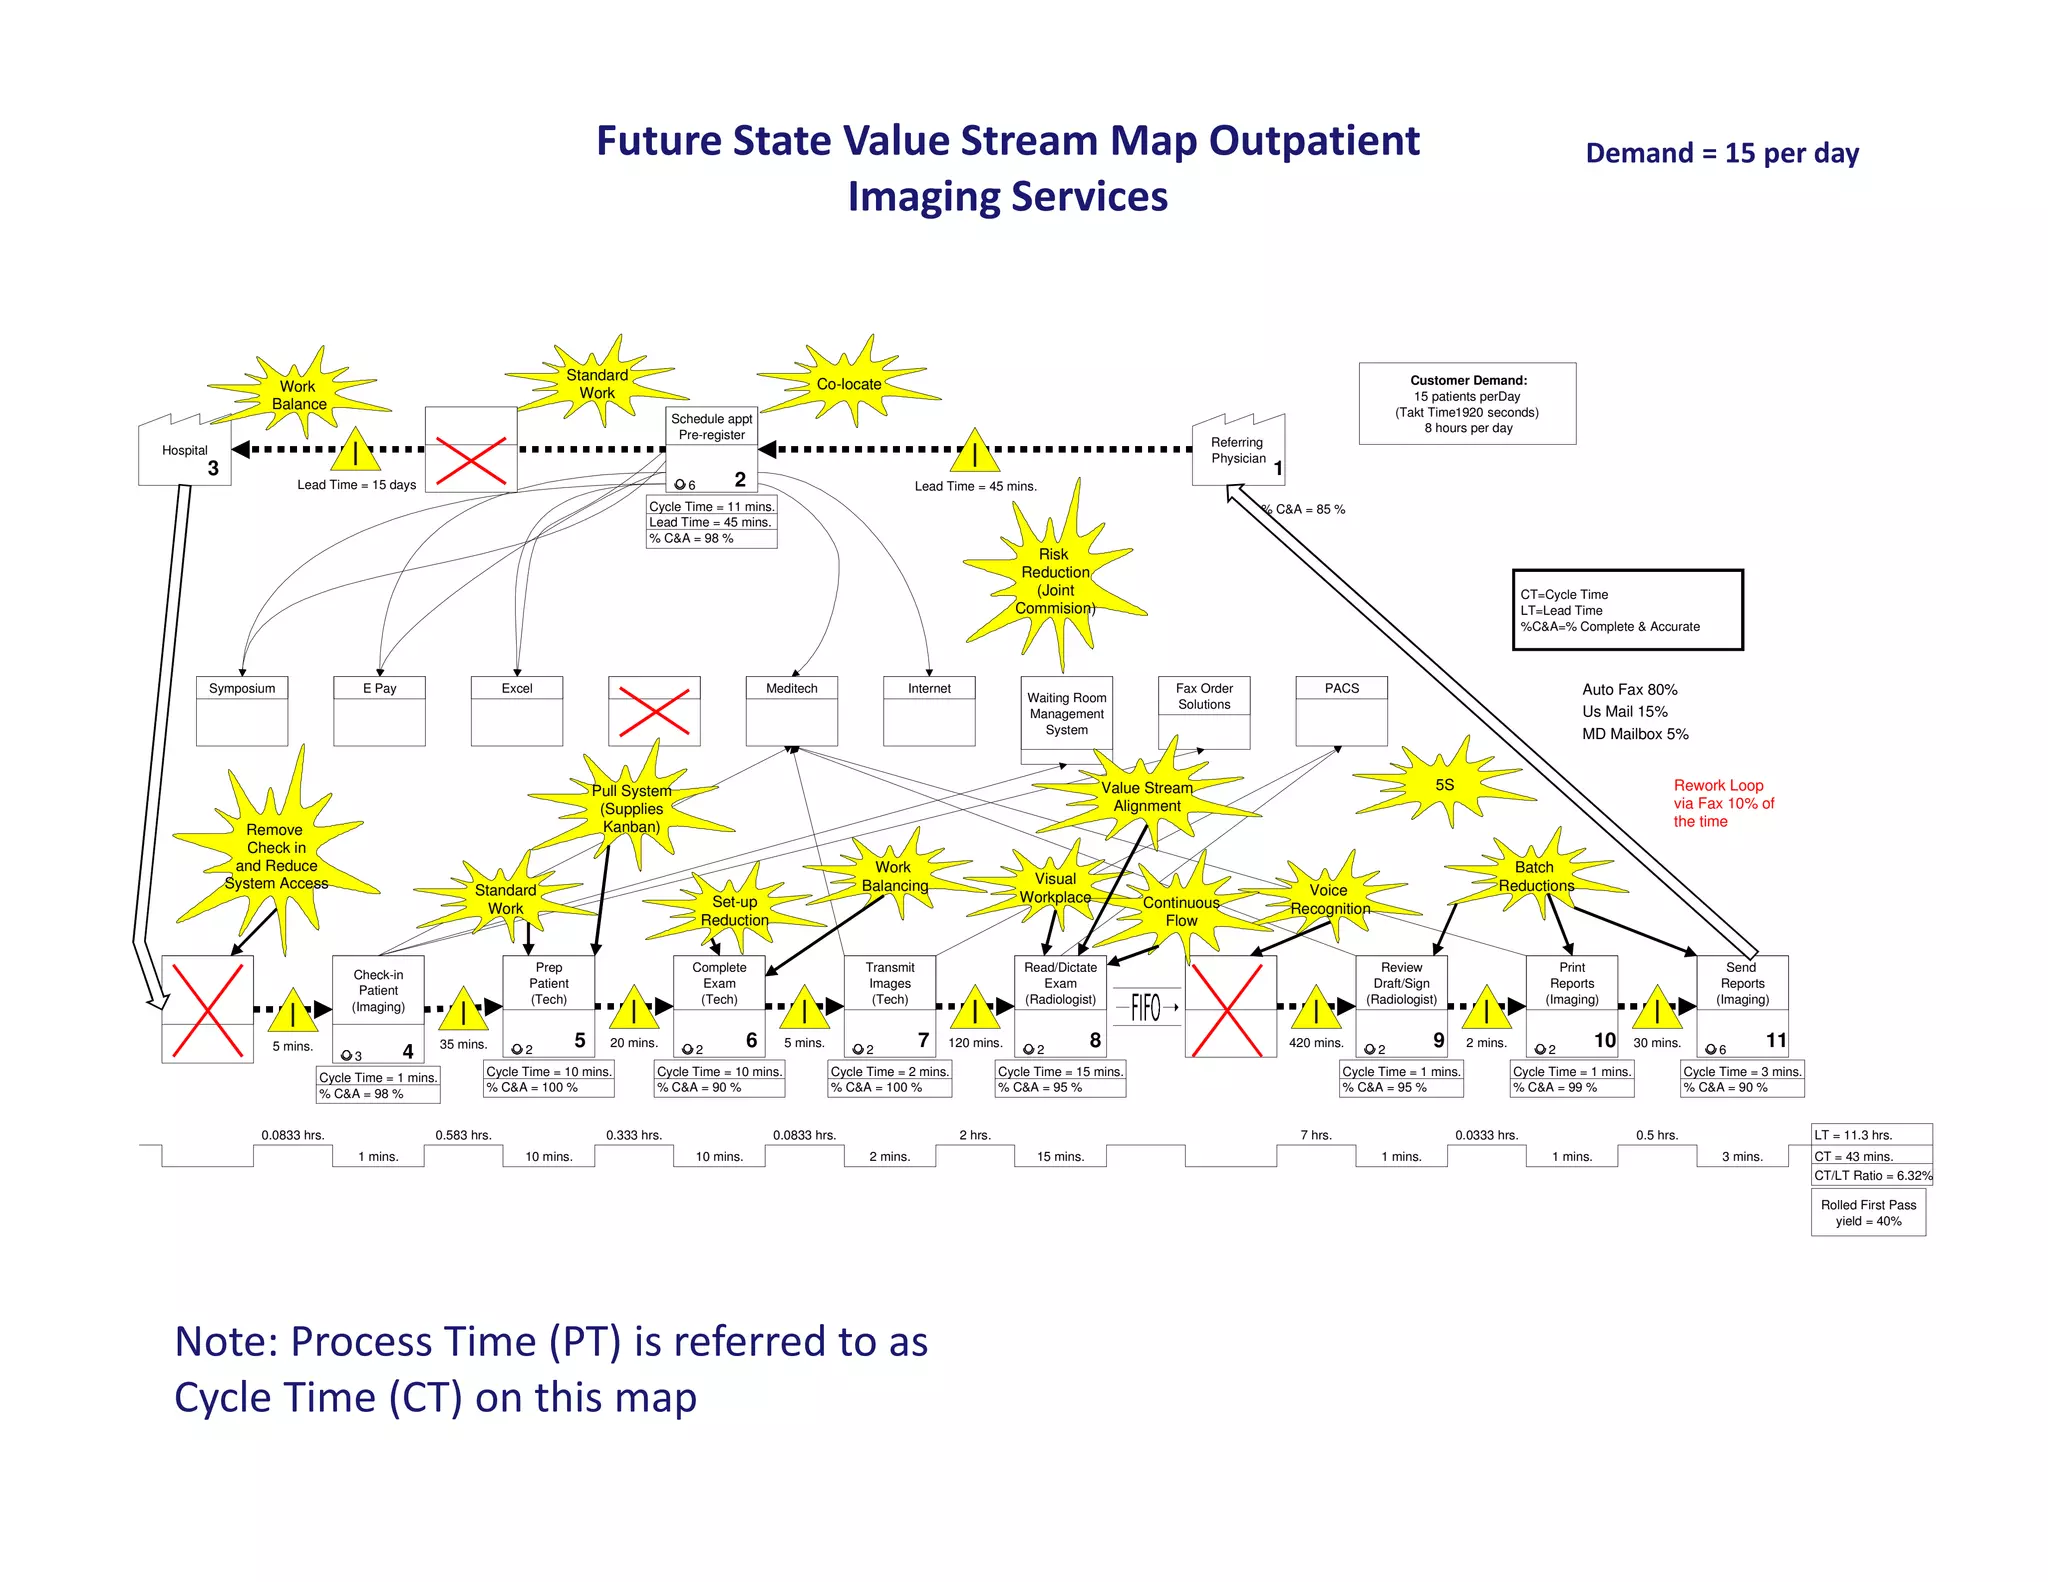
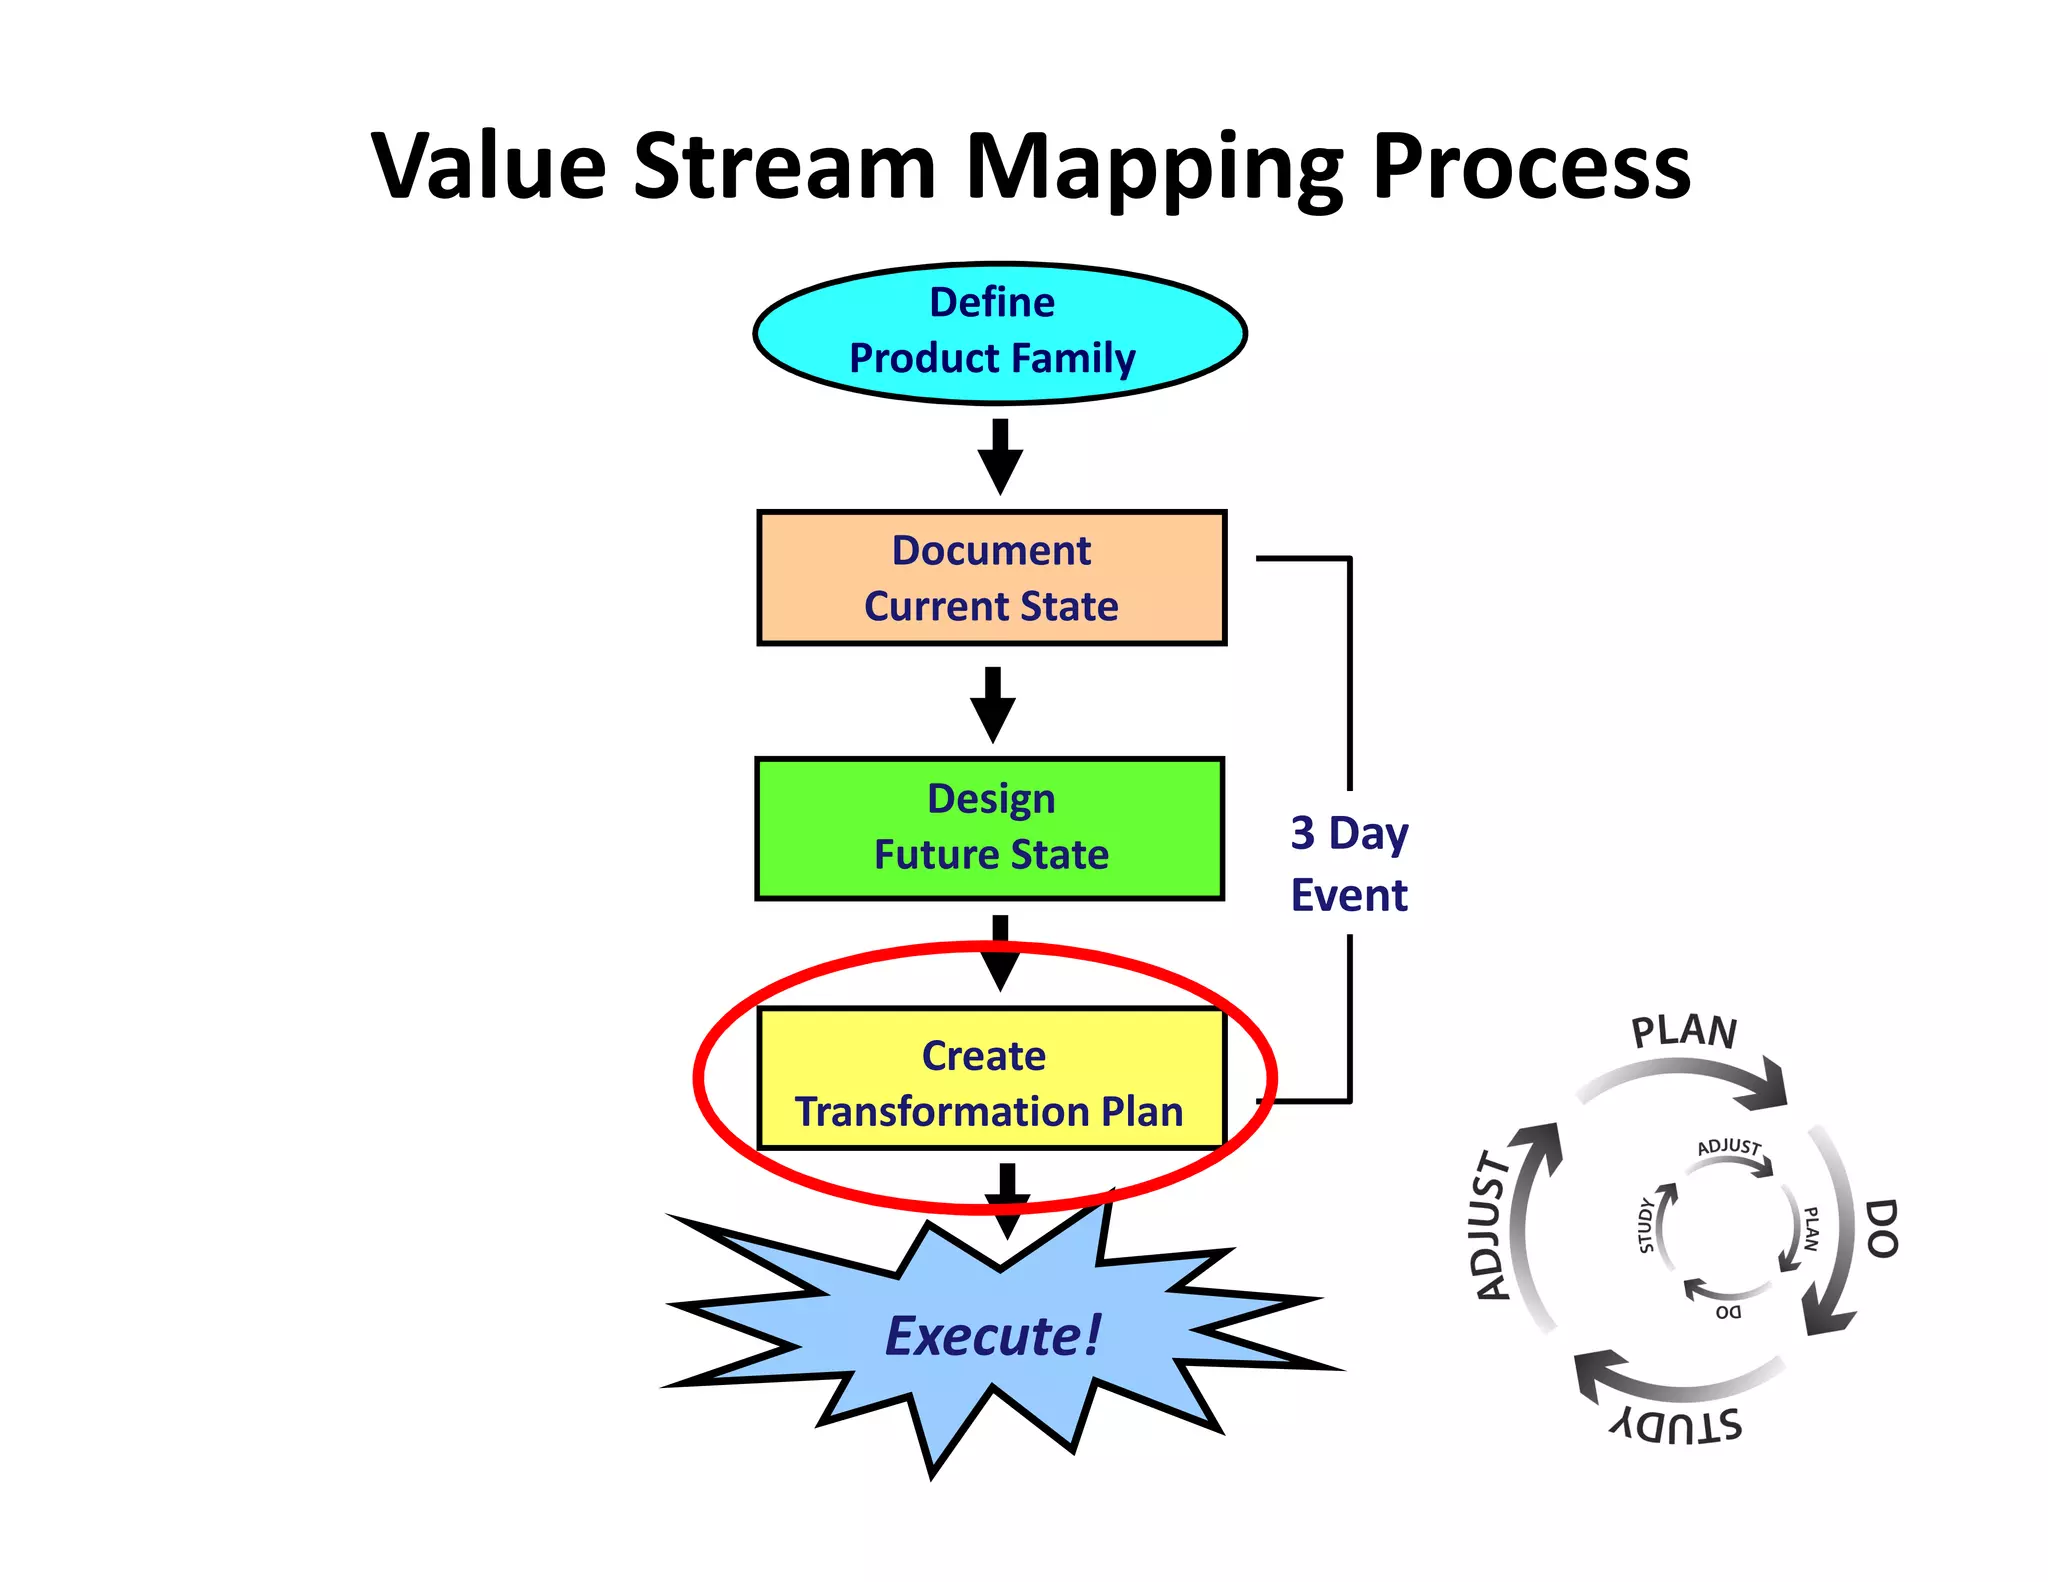
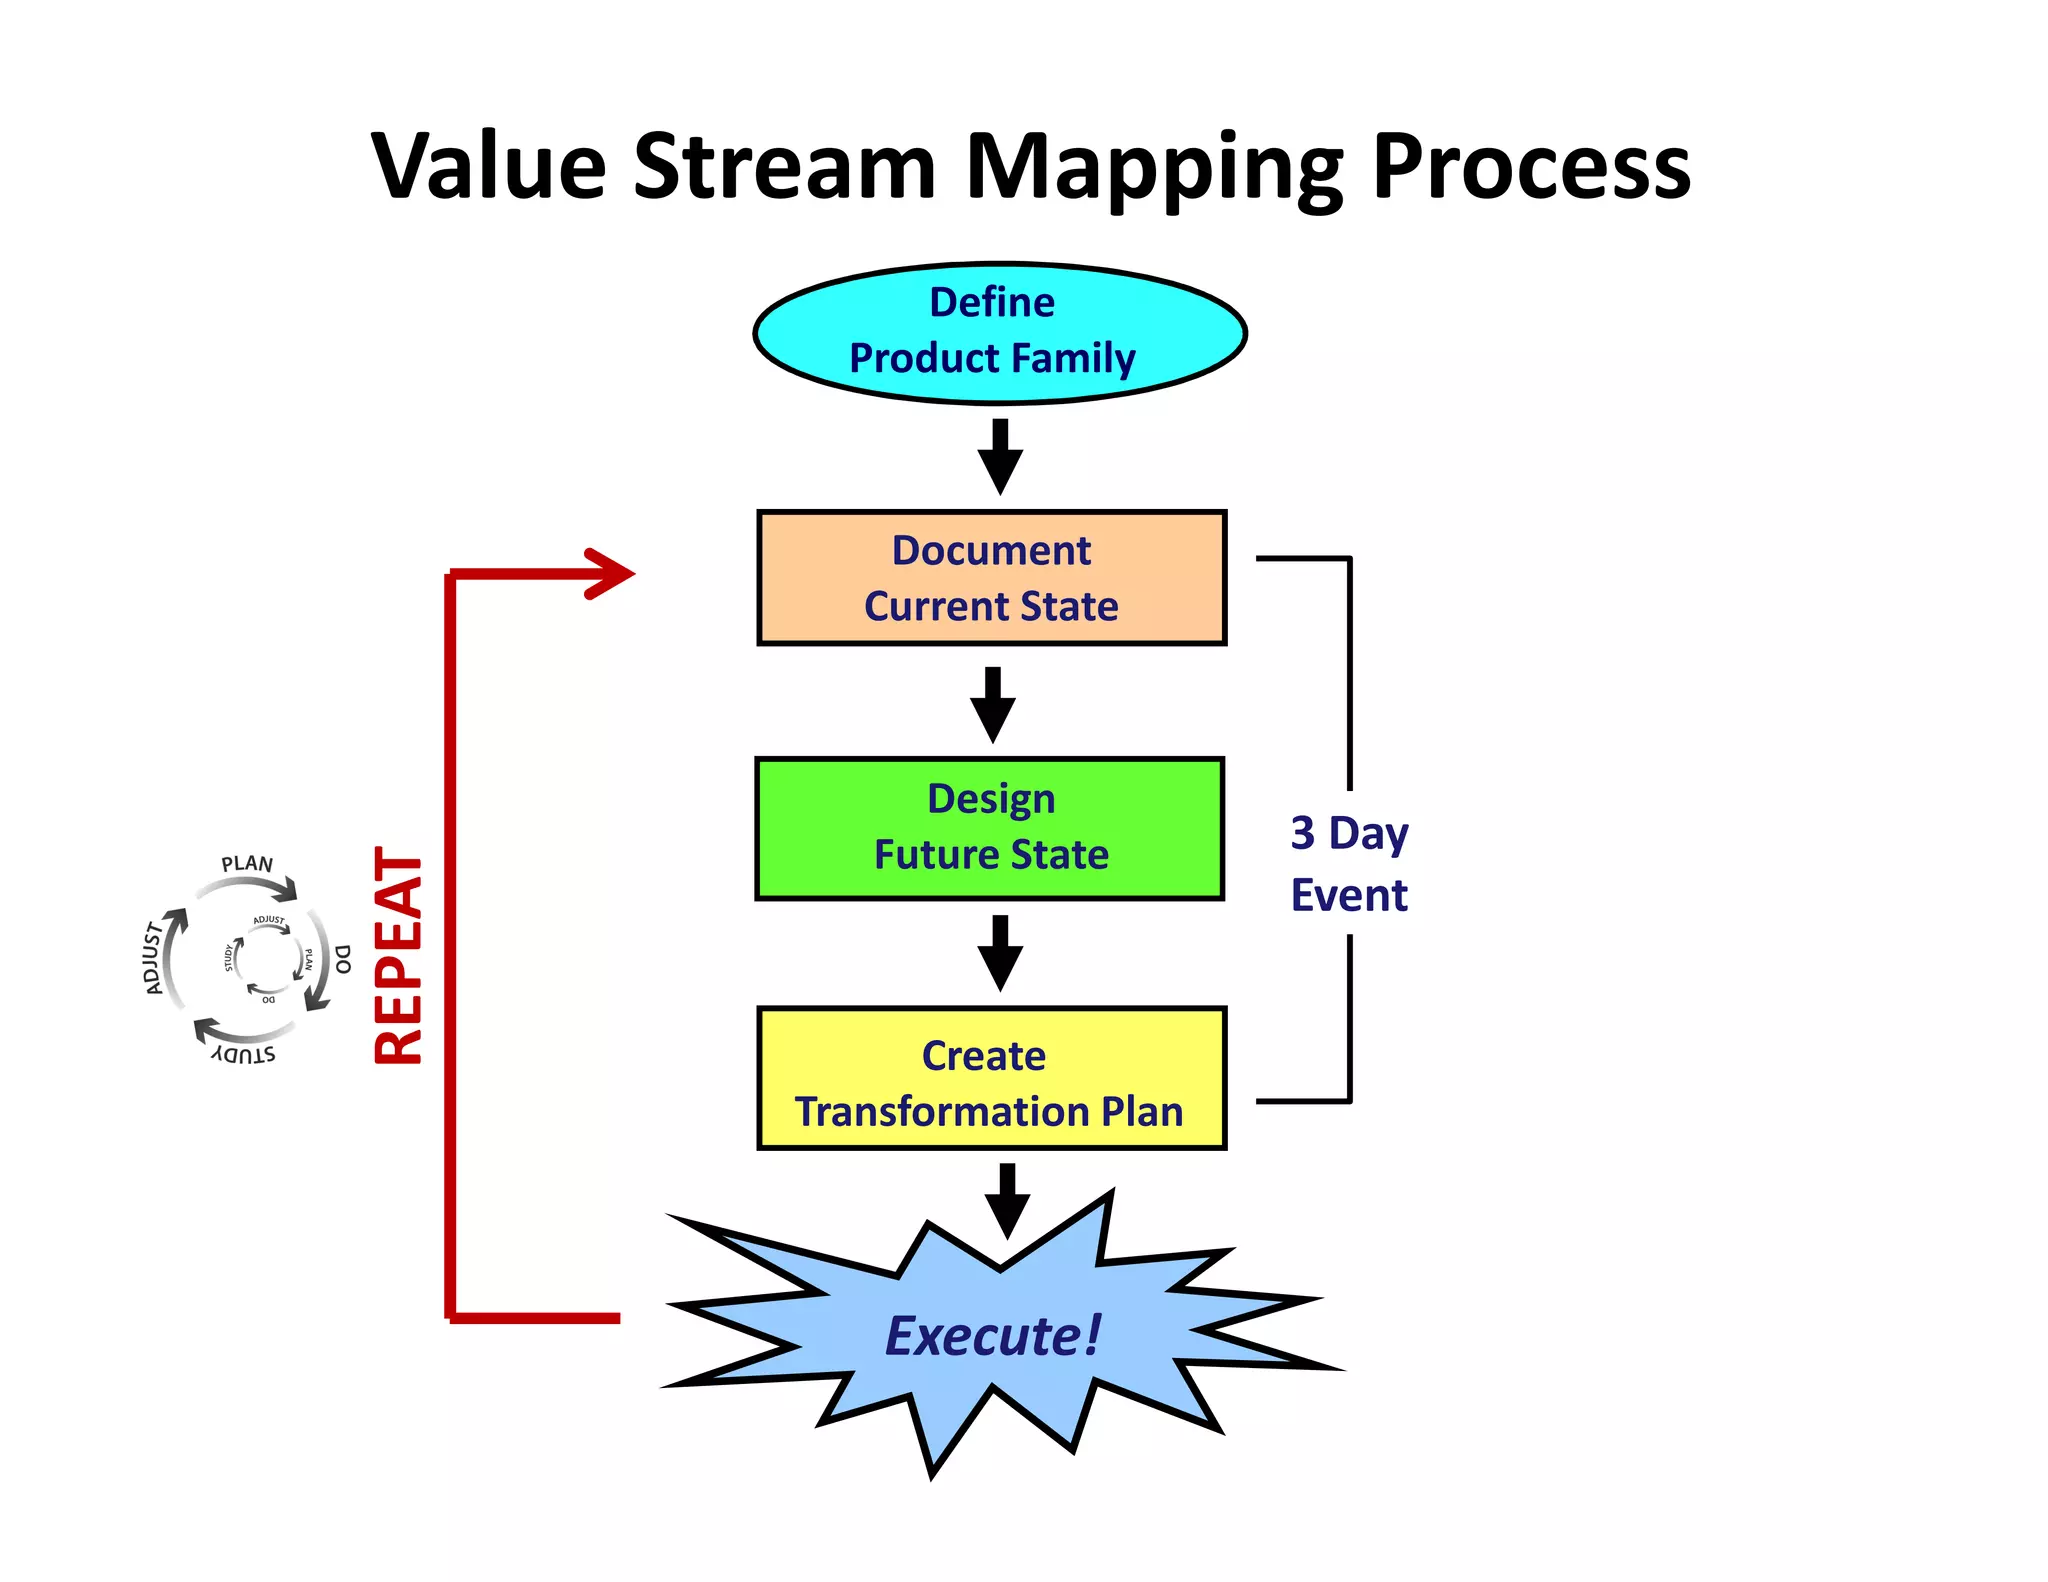
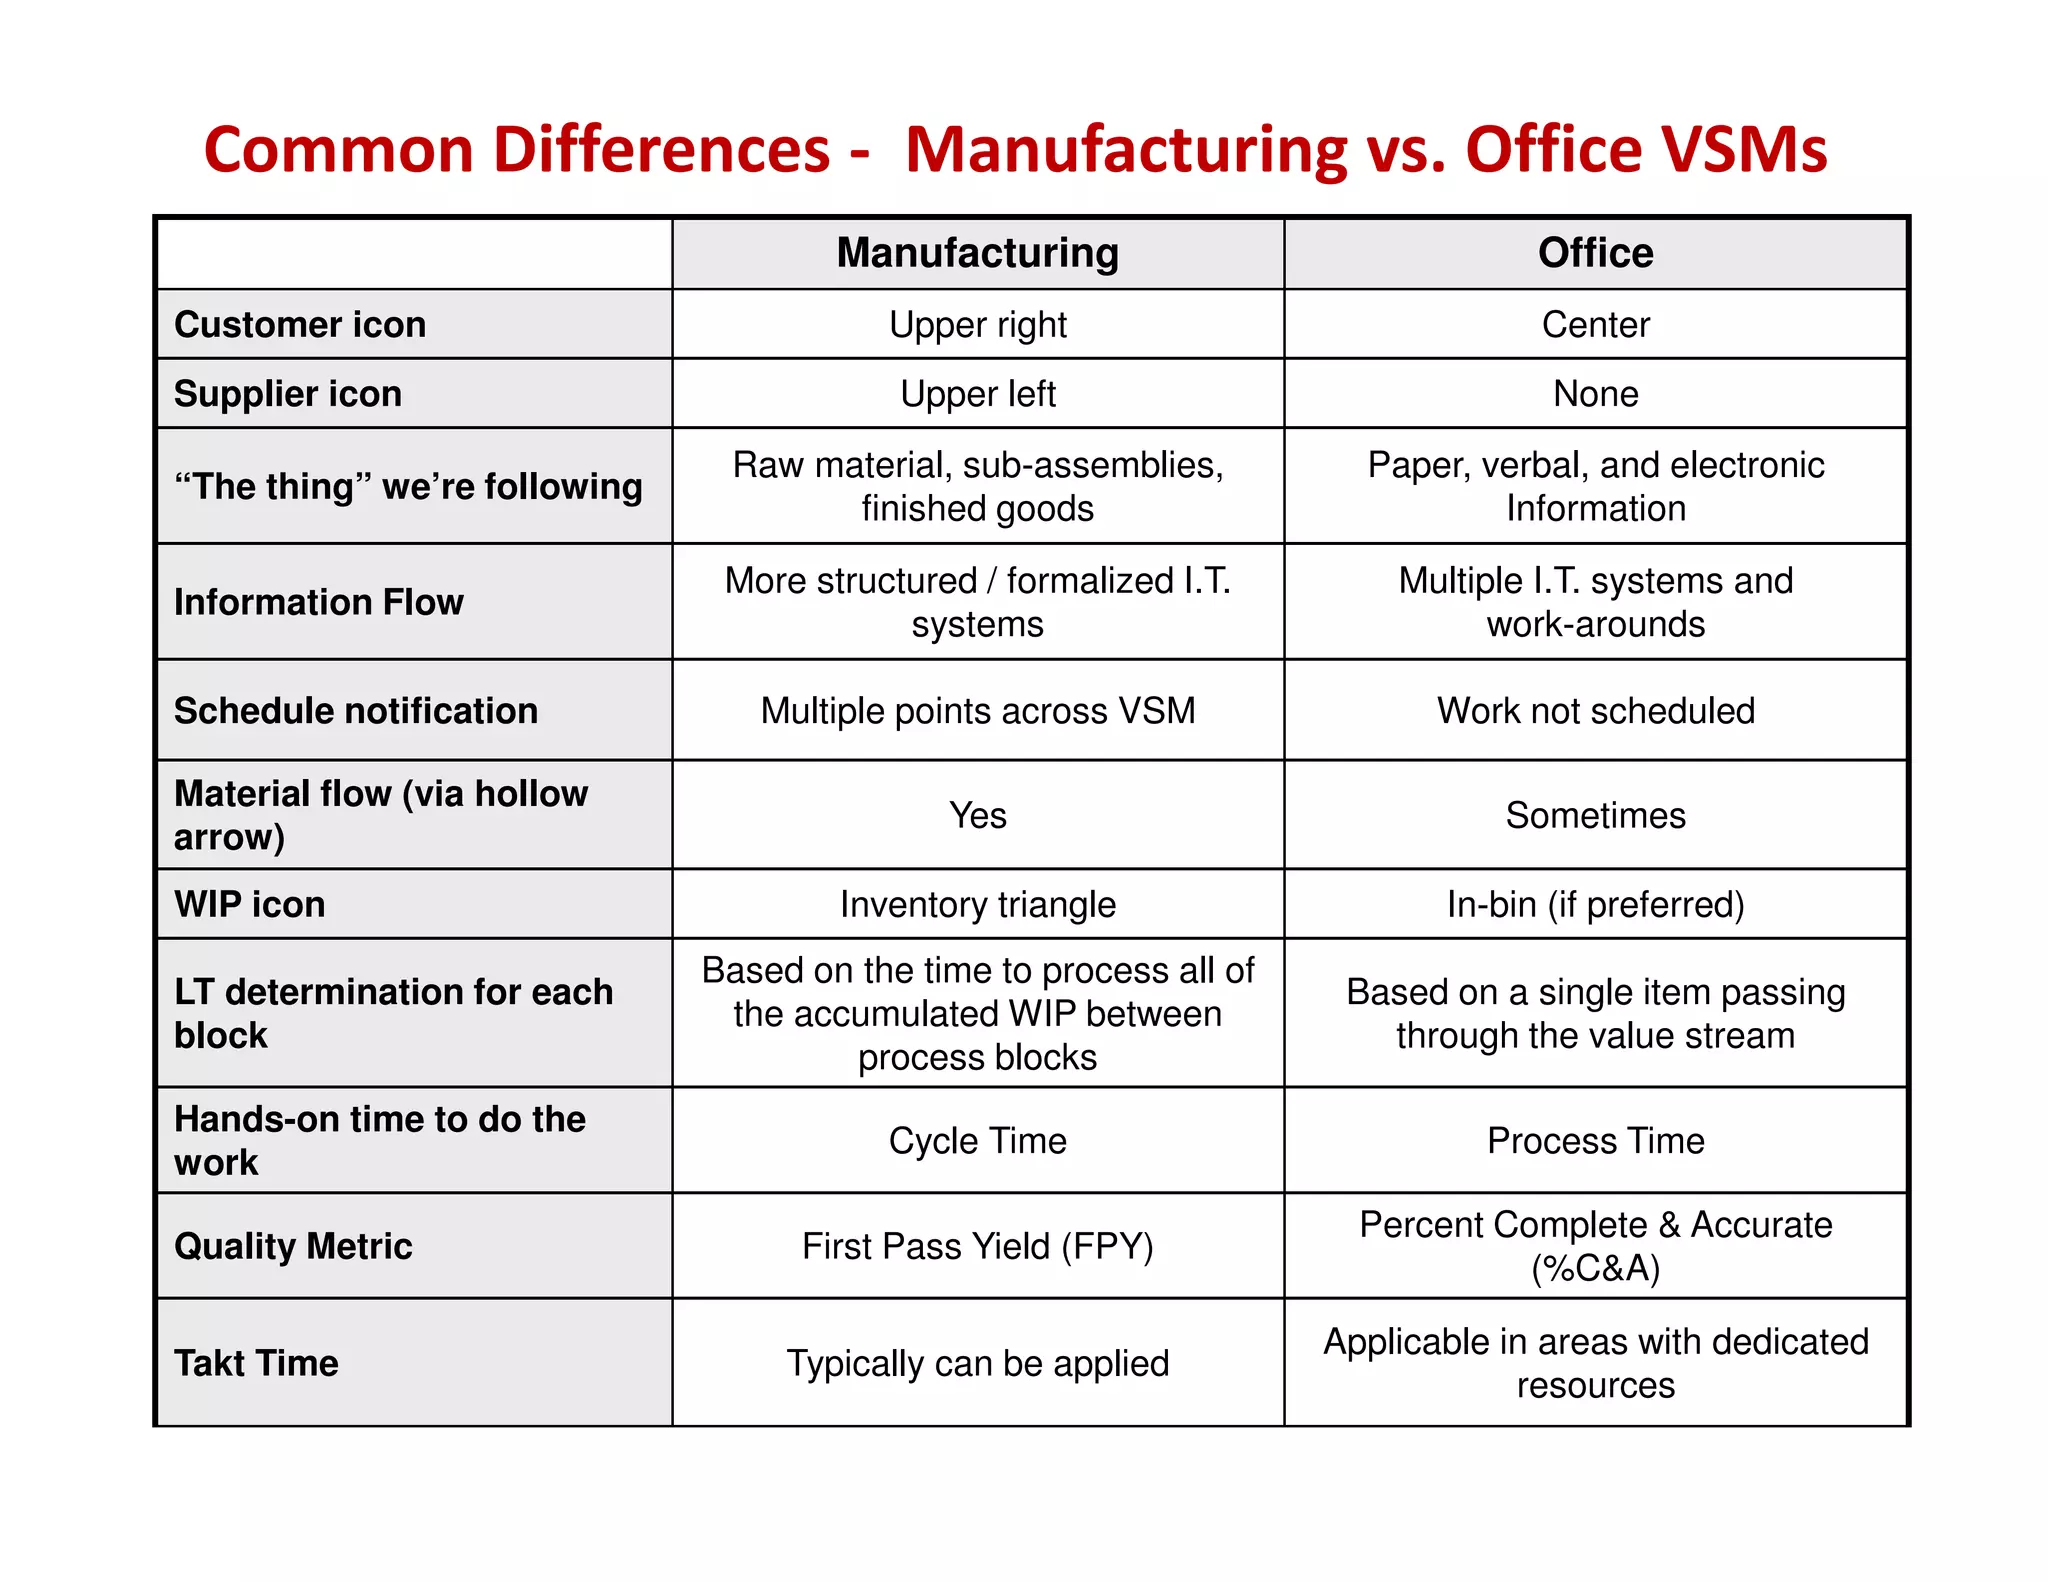

The document discusses value stream mapping (VSM) as a tool to improve office and service processes, emphasizing the importance of understanding the entire value stream from customer request to delivery. It details various examples of value streams across different industries, outlines the steps for creating a value stream map, and highlights the benefits of VSM in promoting systems thinking and improving overall efficiency. The presentation culminates in methods for analyzing and categorizing process steps to enhance performance metrics.


